


Still downloading templates?
There’s an easier way. Try a free AI Agent in ClickUp that actually does the work for you—set up in minutes, save hours every week.
Sorry, there were no results found for “”
Sorry, there were no results found for “”
Sorry, there were no results found for “”


A sound database system plays a pivotal role in supporting the day-to-day operations of any organization. It helps you organize, retrieve, and compare all kinds of data, from tracking inventory to recording customer info and transactions.
Creating and managing high-performing repositories requires a blueprint, though. Database entity relationship diagrams help you develop that initial outline by defining individual attributes and inter-relationships within records.
Originally proposed by Dr. Peter Chen, a Taiwanese-American computer scientist, this flowchart model promotes a precise understanding of database schemas for tech and non-tech users.
If you’re looking for top-quality tools to create the perfect ERD, you’re in luck! We’ll explore 10 practical ERD tools that provide visual clarity to create cohesive database models.
An entity relationship diagram (ERD) is a type of flowchart used in database design. It illustrates the structure and relationships within a database through three components:
This interplay between attributes and relationships reveals a clear and concise way to depict data organization within any complex system. Let’s say you’re creating entity relationship diagrams for a school—an ER diagram will help you logically map out the connection between students, courses, and faculty members.
While an ERD tool must meet your specific needs and preferences, here are some general factors to consider:
With the fundamentals of ERD tools covered, let’s delve into the top 10 options for your database diagram needs.
ClickUp is much more than a mere diagramming tool—it’s a comprehensive productivity platform that seamlessly integrates tasks, discussions, and documents.
Take collaborative concept mapping and diagramming sessions to a whole new level with ClickUp Whiteboards. It’s a free-form canvas for brainstorming and project planning, allowing multiple users to contribute simultaneously through sketches, texts, images, shapes, connectors, sticky notes, and other media elements.
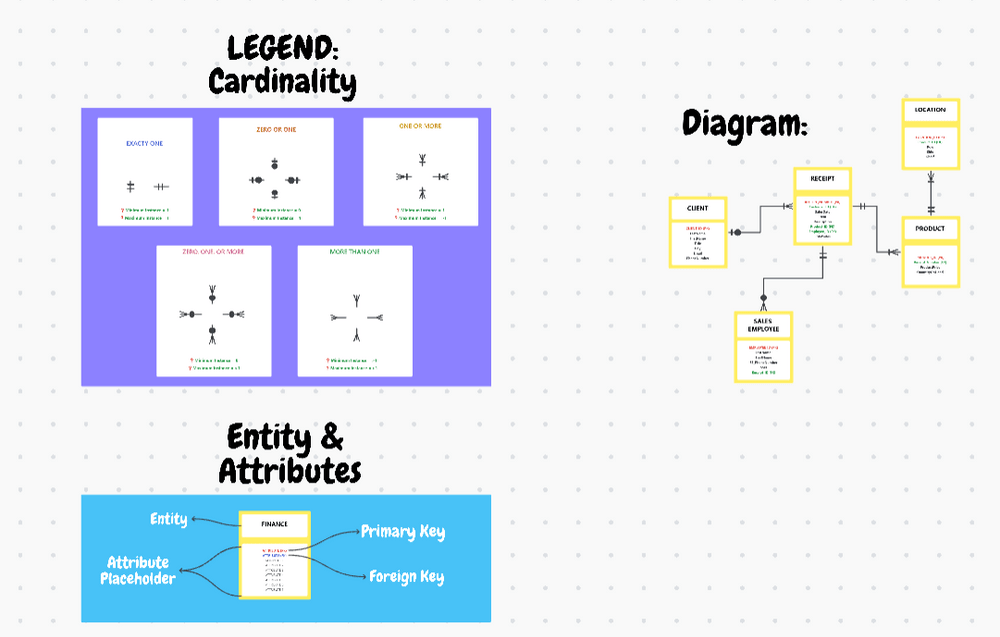
Don’t want to build an ERD from scratch? Tap into ClickUp’s extensive library of templates for diagramming and mapping! Effortlessly map out your ERD with the ClickUp Entity Relationship Diagram Template—ideal for laying out complex data structures without coding skills.
This Whiteboard template lets you create primary and foreign keys effortlessly using Custom Fields, providing at-a-glance insights into your ERD relationships. Establish connections within seconds with drag-and-drop nodes. Leverage the zoom levels to model your data at any scale. We recommend using simple ClickUp Automations to apply constraints to ER models. That way, you can ensure consistent and error-free outputs.
ClickUp Mind Maps is another diagramming feature you can explore. It lets you organize projects, ideas, and tasks by illustrating relationships and hierarchies.
Overall, ClickUp is a highly visual project management solution. With highly customizable Dashboards, 1,000+ integration options, and 15+ views you can represent, review, and logically connect database structure elements in no time!
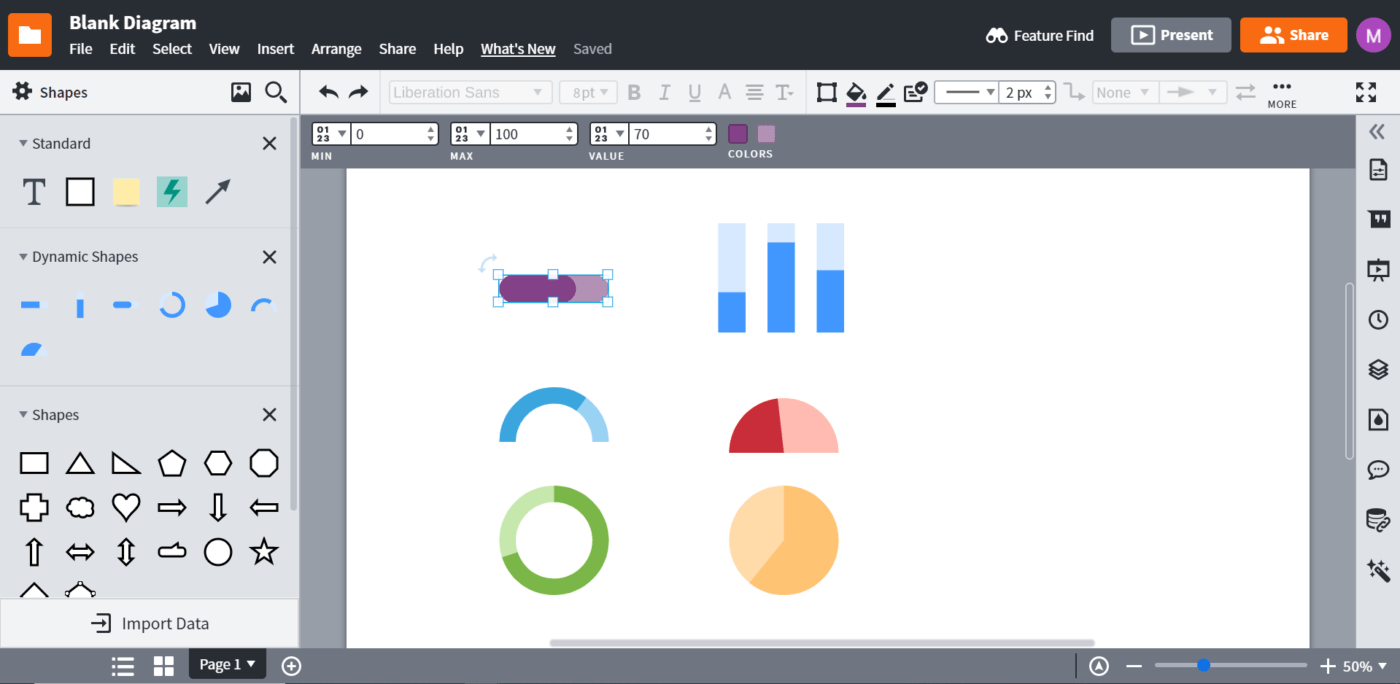
Lucidchart, like its top competitors, is a versatile tool for crafting professional-grade ER diagrams and design ideas, even for the most complex datasets. It allows real-time editing in the cloud, making it an ideal option for remote and distributed teams.
It enables you to create diagrams from scratch or use a wealth of templates, symbols, and notations to fast-track the process.
Create a blank diagram and access Lucidchart’s ERD shape library by clicking the + Shapes button from the menu on the left side of the screen. Once enabled, you can effortlessly drag and drop ERD shapes onto the canvas, giving you a decent head start.
Connecting these shapes is equally intuitive, as you can link them by dragging from the red dots at the shape borders and customizing the line endings using the toolbar above the canvas.

QuickDBD is a free ER diagram tool of choice if you’re all about precision and keyboard efficiency. It lets you rapidly sketch out database schemas just by typing—all you have to do is feed info about entities, and relevant data boxes will appear on the display! ⌨️
But it doesn’t stop there!
QuickDBD also shines in the collaboration department. Its nifty share-link feature makes working with your team on ongoing structures a breeze. Plus, it supports schema imports from databases like MySQL, MariaDB, Oracle, and SQL Server, helping you generate ERDs without shuffling between platforms.
📮ClickUp Insight: 11% of our respondents leverage AI primarily for brainstorming and ideation. But what happens to these brilliant ideas afterward? This is where you need an AI-powered whiteboard, like ClickUp Whiteboards, which helps you instantly turn ideas from the brainstorming session into tasks.
And if you can’t quite explain a concept, simply ask the AI image generator to create a visual based on your prompt. It’s the everything app for work that enables you to ideate, visualize, and execute faster!
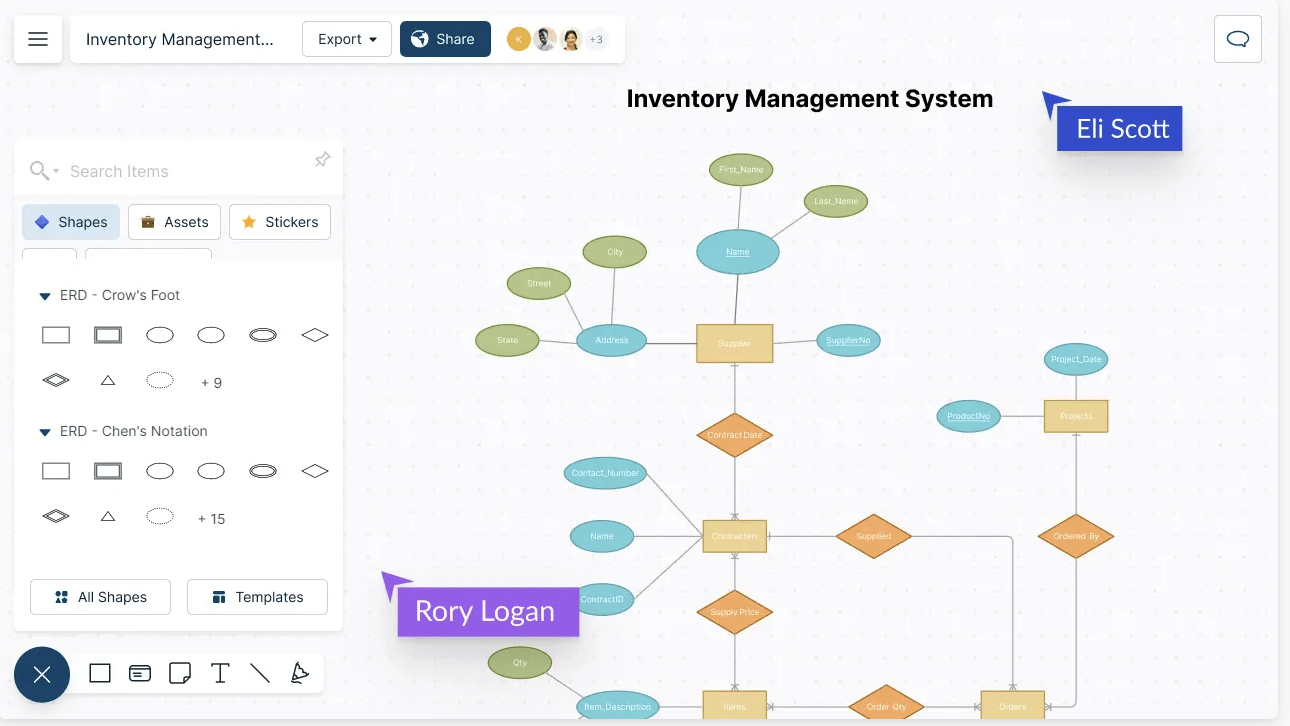
Creately takes the complexity out of the flowcharting equation by offering an intuitive platform that transforms rough data into polished ERDs.
With an interactive drag-and-drop interface and a handy toolbar, you have the freedom to build conceptual, logical, or physical data structures. Customize them by adjusting colors, fonts, and attributes that align with your design plan. You can do a diagram text search to find a particular node in a large network.
Creately offers unlimited real-time cursors, helping you team up with colleagues. You can also use comments for asynchronous discussions and follow-ups. Like ClickUp, this tool allows you to configure multiple access and role levels to manage the reviewing and approving of ER diagrams.
*All listed prices refer to the yearly billing model
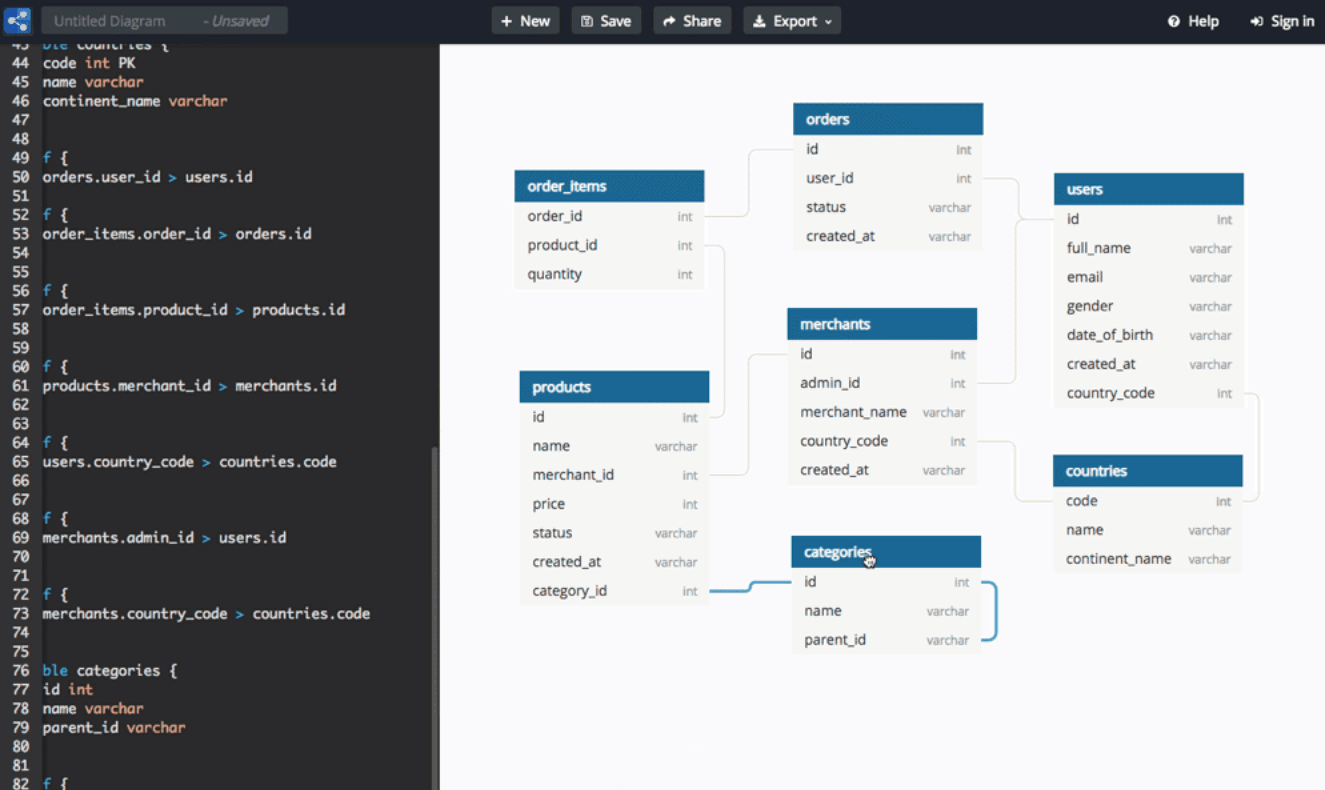
DBDiagram is a top choice for developers and analysts looking for a cost-effective web-based entity relationship diagram tool. It prioritizes user-friendliness, letting professionals turn their ideas into clear diagrams with minimal code.
But here’s the exciting part: DBDiagram goes the extra mile by allowing you to get ER diagrams directly from SQL dump files. It can even generate SQL statements to create a database schema. This tool is all about convenience as you can integrate with popular web frameworks like Rails or Django and upload your schema.rb or models.py files in a jiff!
Once your ER diagrams are ready, quickly turn them into PDFs and share them with your team or circulate them internally with a single click.
*All listed prices refer to the yearly billing model
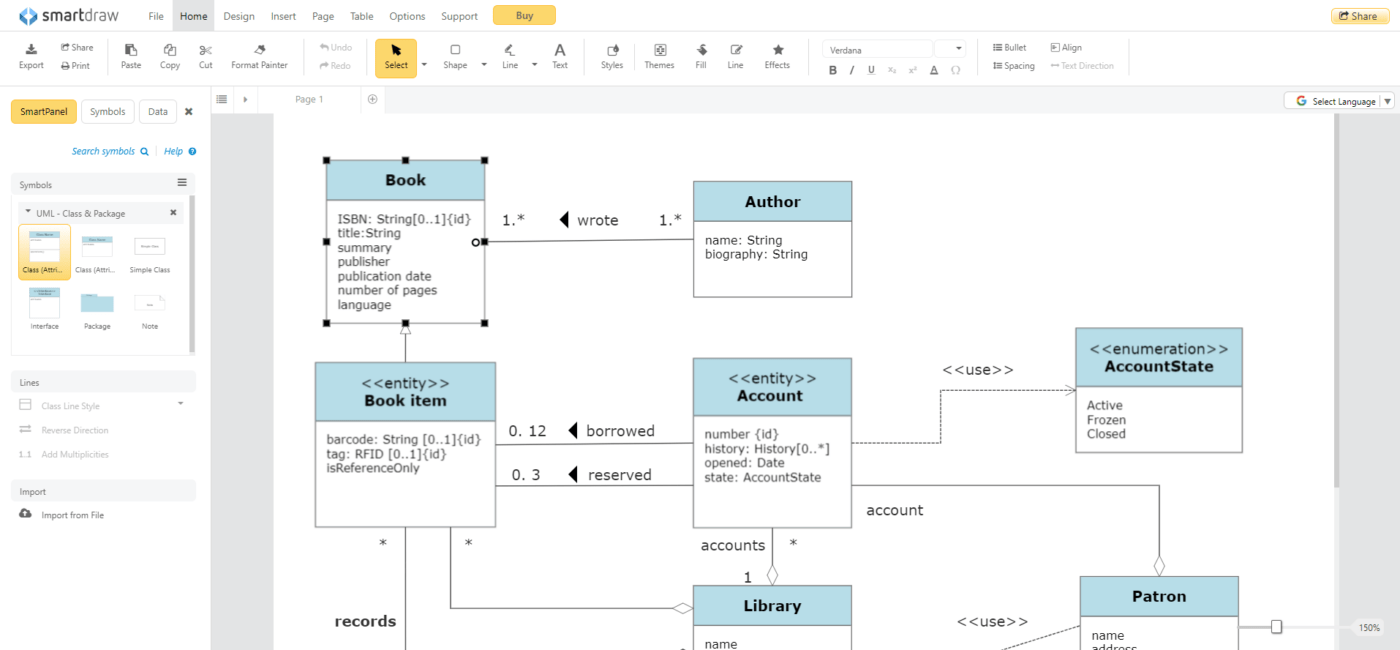
SmartDraw lives up to its name, offering a hassle-free approach to entity-relationship diagramming. What sets it apart is its ability to automatically generate ERDs using your existing database, providing an initial draft that you can customize further.
Its wide array of templates with tailored rectangular, oval, and diamond ERD shapes ensures a smooth journey from conception to completion. If the templates don’t quite fit your needs, you can handpick shapes and input data manually, ensuring the final results match your vision.
Easily add the generated diagrams to Microsoft Office or Google Workspace apps. SmartDraw integrates with common file storage systems, enabling you to store diagrams without creating parallel folders and permissions.
Check out the top SmartDraw alternatives to expand your search!
*All listed prices refer to the yearly billing model
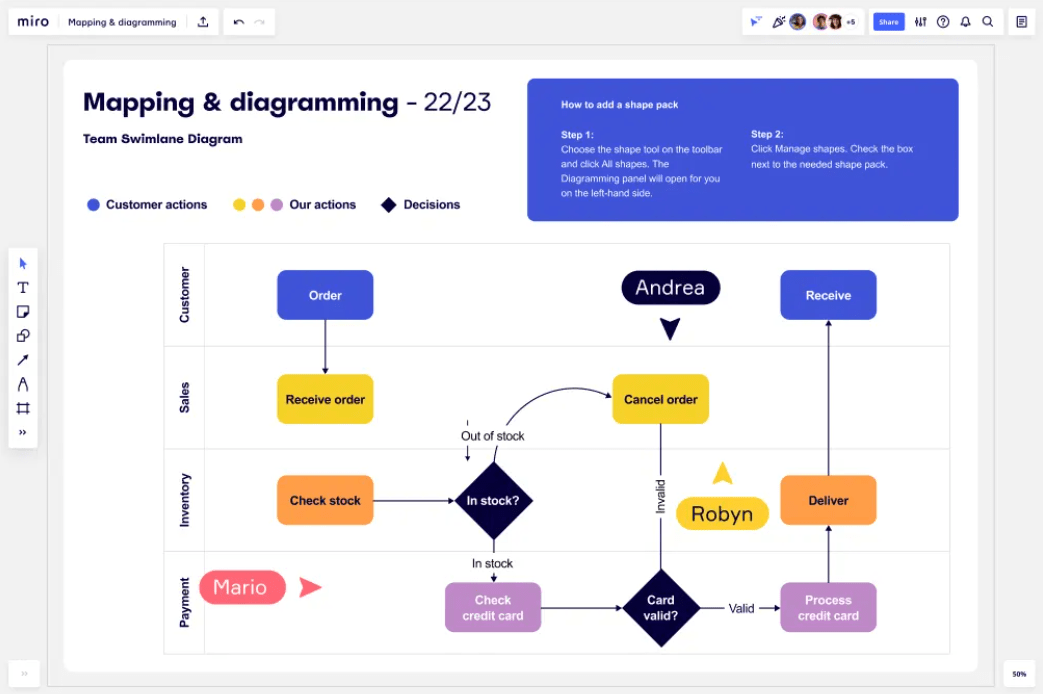
Like Lucidchart and ClickUp, Miro has your back with numerous templates covering everything from value chains to project scopes. Its ERD template comes with a predefined map to create your data model. The typical steps include:
Miro adds a touch of magic with advanced interactive features that elevate your collaborative diagramming experience. Think of it as brainstorming on a real whiteboard, whether you’re in the office or working from home. Everyone can pitch in, thanks to features like digital post-it notes and hand-drawing.
*All listed prices refer to the yearly billing model
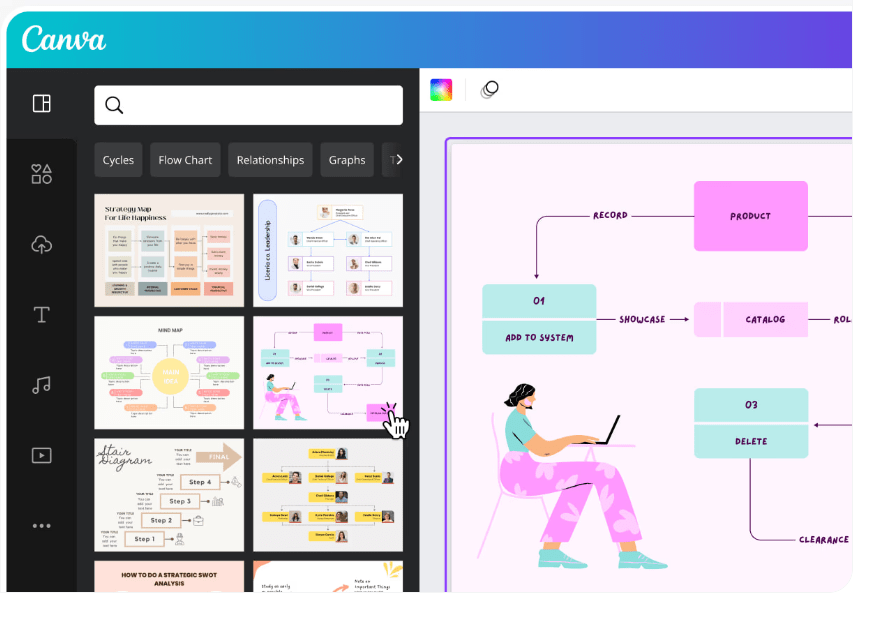
Canva’s ER diagram maker is not only convenient but also user-friendly. It impresses with well-sketched-out features to showcase intricate connections within your dataset, helping you detect potential logic flaws or design bugs faster.
Canva lets you choose from over 20 graph types to represent ER models in diverse situations, ensuring your diagrams are both comprehensive and visually appealing. It also enables easy-to-read graphs with high-resolution publishing.
What sets Canva apart are its rich customization options. You can display entities, attributes, and relationships with plenty of design elements, including images and graphics. To share and embed your diagrams, just use the download and export buttons integrated into the diagram software.
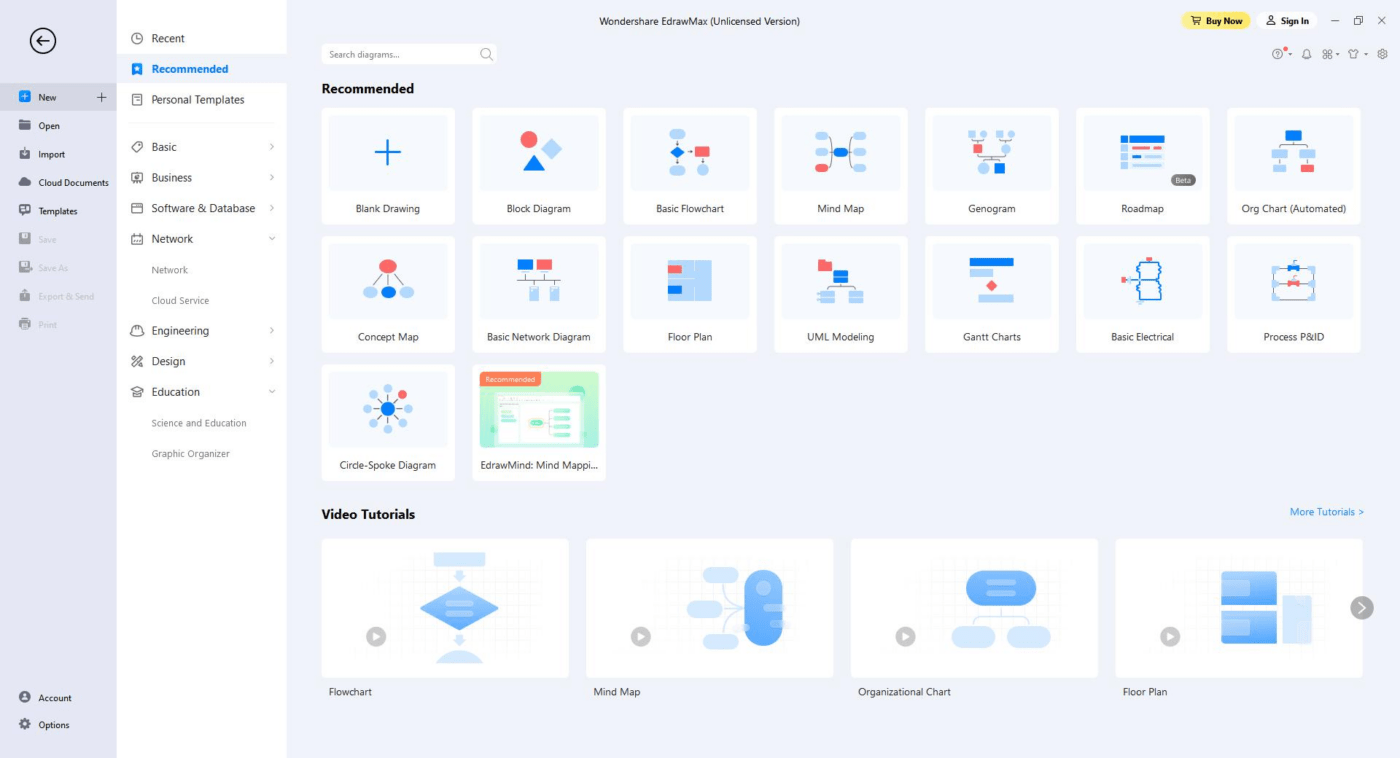
EdrawMax is your go-to tool for crafting visually stunning graphs and charts with ease. It’s useful for designing entity relationship diagrams thanks to its customizable, eye-catching design tools.
To create a new ERD, open your EdrawMax account and navigate to the Database Modeling section (on the left side of the screen). Pick from one of the templates to get started, or just use a blank canvas.
EdrawMax makes it easy to define complex entity relationships with connectors and lines and convert them into the relational schema. The resulting diagram may help you become problem-aware way ahead of time, especially if you want to limit deployment errors.
Once you go into problem-solving mode, you can fine-tune your diagram by adding or removing elements. Save your files securely on the cloud or export them in popular formats like PDF, Visio, HTML, and SVG.
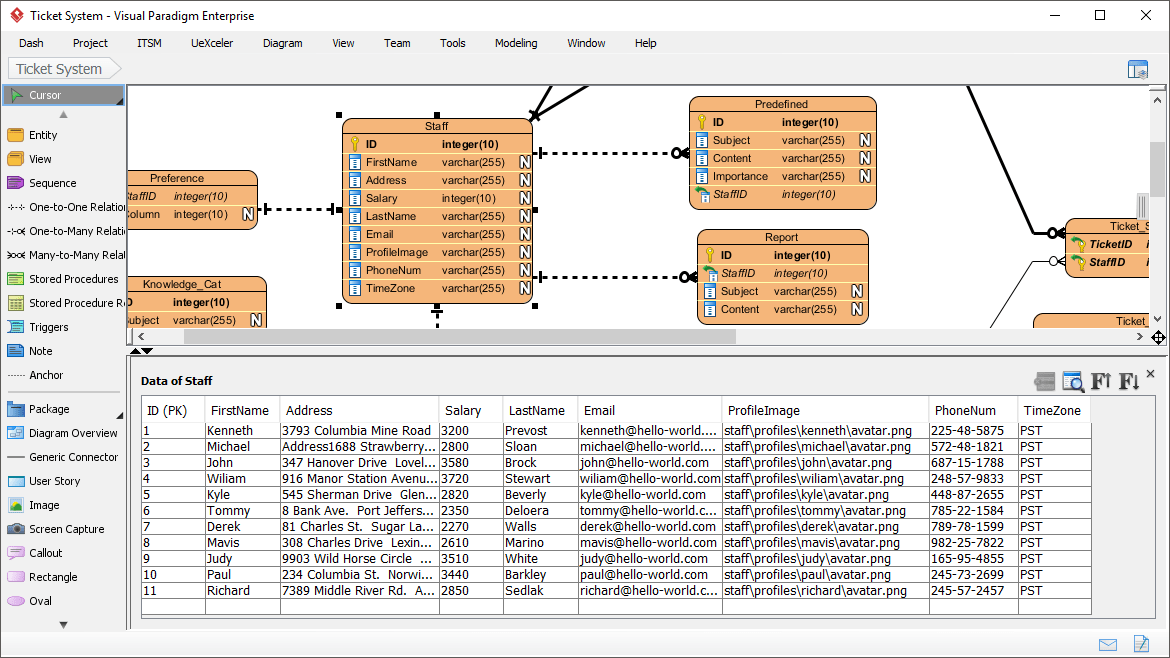
Visual Paradigm is an online tool with an intuitive editor for ERD modeling. Its ad-free interface ensures your experience is free from salesy distractions.
Create ERD entities with sample datasets or use Model Transitor to duplicate existing diagrams and transitions. Use the Table Record and Database View editors to model your data structure methodically and add tables, columns, and inter-relationships for an accurate visual representation. You can directly generate ad-hoc SQL statements for your data tables.
With unlimited diagram creation and watermark-free image export options, this platform is a versatile choice for both individuals and teams.
In your quest to find top-notch tools for crafting entity relationship diagrams, it’s always smart to choose a tool that aligns with your specific requirements. The products we discussed today are highly accessible and available at multiple price points, so your decision-making process should be smooth.
As a standout choice, consider ClickUp—it not only simplifies diagramming for database managers but also offers a myriad of other productivity features.

© 2026 ClickUp

There’s an easier way. Try a free AI Agent in ClickUp that actually does the work for you—set up in minutes, save hours every week.