


Still downloading templates?
There’s an easier way. Try a free AI Agent in ClickUp that actually does the work for you—set up in minutes, save hours every week.
Sorry, there were no results found for “”
Sorry, there were no results found for “”
Sorry, there were no results found for “”
A SaaS company once sent a ‘we miss you’ email to win back a churned customer. The customer replied: ‘I canceled because your product stopped working two months ago, and nobody responded to my support tickets. But thanks for the discount code, I guess.’
Churn happens way before the cancellation.
Your product stopped being useful, the onboarding confused them, or they hit a problem nobody fixed. By the time they cancel, you’ve already lost them weeks ago.
Most churn reduction strategies involve frantically calling customers after they hit the cancel button, which is like trying to save a relationship by showing up at the airport with flowers. Slightly too late. 🙃
A customer churn reduction playbook catches problems before customers start Googling your competitors. This guide shows you how to build one that your team will use with ClickUp, the everything app for work. 📒
Customer churn is the rate at which customers stop doing business with you over a specific period. They cancel subscriptions, stop making purchases, or simply move on to a competitor.
Think of it like a leaky bucket. You’re pouring water in (acquiring new customers), but if there’s a hole at the bottom (churn), you’re constantly fighting to keep it full.
Here’s why churn should keep you up at night:
🧠 Fun Fact: Not all churn is voluntary. In one study, ‘involuntary churn’ (due to payment failures, etc.), customers actually showed higher loyalty when brought back than those who left voluntarily.
Customers don’t just leave randomly. There’s always a reason, even if they don’t tell you what it is. Let’s break down the real culprits:
If customers don’t experience a win in their first week, you’re in trouble. A messy client onboarding process where people can’t figure out basic features or see immediate value creates frustration from day one.
They signed up excited, and you let that momentum die. When someone spends 30 minutes trying to complete a simple task that should take three, they start questioning their purchase decision.
📮 ClickUp Insight: Only 12% of our survey respondents use AI features embedded within productivity suites. This low adoption suggests current implementations may lack the seamless, contextual integration that would compel users to transition from their preferred standalone conversational platforms.
For example, can the AI execute an automation workflow based on a plain text prompt from the user? ClickUp Brain can! The AI is deeply integrated into every aspect of ClickUp, including but not limited to summarizing chat threads, drafting or polishing text, pulling up information from the workspace, generating images, and more! Join the 40% of ClickUp customers who have replaced 3+ apps with our everything app for work!
Out of sight means out of mind. When you only reach out to upsell or when their payment fails, that’s not a relationship.
Smart companies know that effective customer communication management means staying relevant without being annoying—sharing tips, checking in on progress, and celebrating milestones. If the only emails customers get from you are invoices, don’t be surprised when they cancel.
Markets move. Customer needs evolve. Your product? Maybe it’s still doing the same thing it did two years ago. Or perhaps it’s bloated with features nobody asked for while ignoring the ones that matter.
A solid churn prediction model can flag at-risk customers before they leave, but it won’t help if your product genuinely isn’t cutting it anymore.
They were fine paying $99/month when they used your product daily. Now they’re logging in twice a month and seeing cheaper alternatives everywhere. If customers can’t justify your price based on the value they’re getting, they’ll find someone who offers a better deal.
🔍 Did You Know? In subscription businesses, companies found that offering a ‘pause’ or flexible plan helped them stay at a renewal rate of 95.6% on average, showing that letting customers ‘step back’ instead of fully canceling is powerful.
Think of a customer churn reduction playbook as your roadmap for turning at-risk customers into loyal advocates. Each step builds on the last, creating a comprehensive system that catches issues early and addresses them systematically.
ClickUp’s CRM Solution is the everything app for work that combines project management, knowledge management, and chat—all powered by AI that helps you work faster and smarter.
Let’s walk through how to build your churn reduction strategy step by step with ClickUp. 📈
Before fixing churn, you need to know where it’s happening.
Begin at sign-up and work your way forward chronologically. What happens during their first login? When do they create their first project or send their first email campaign? What milestones matter most?
Suppose you run a SaaS platform for email marketing. Your journey likely includes trial sign-up, first campaign creation, reaching 100 subscribers, upgrading to paid, and eventually renewal. Plot all of these out.
Now comes the critical part: identifying where people drop off. Pull your analytics and look for patterns. Maybe 40% of trial users never send their first campaign. Perhaps users downgrade after hitting certain feature paywalls. These friction points tell you exactly where your experience breaks down.
Don’t just note the numbers, though. Talk to customers who churned at these stages and understand the ‘why’ behind the data.
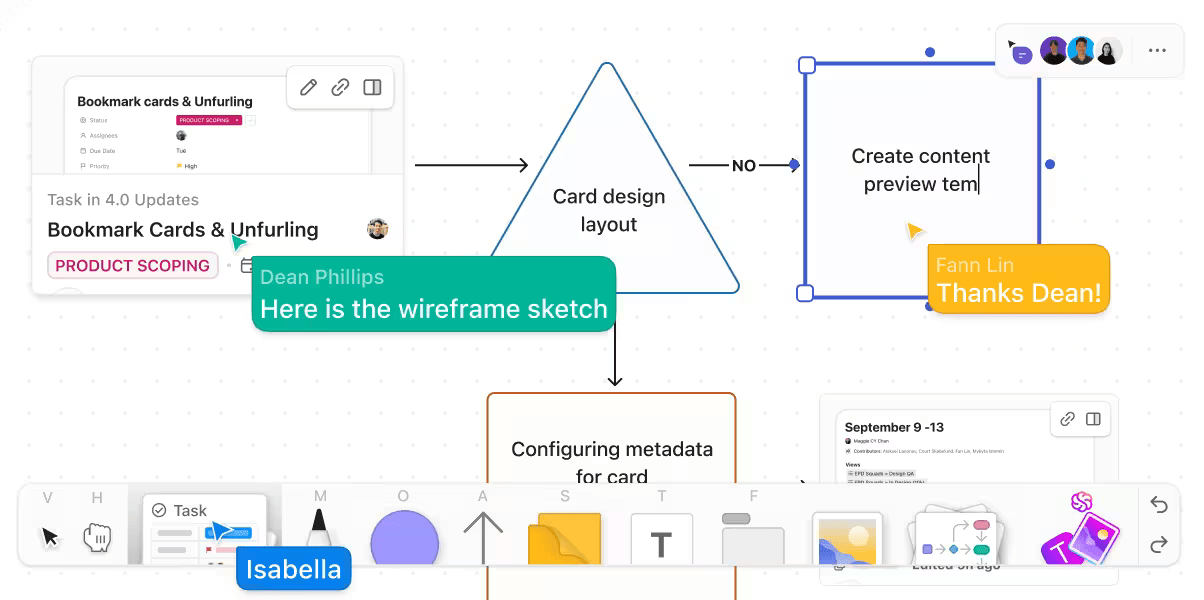
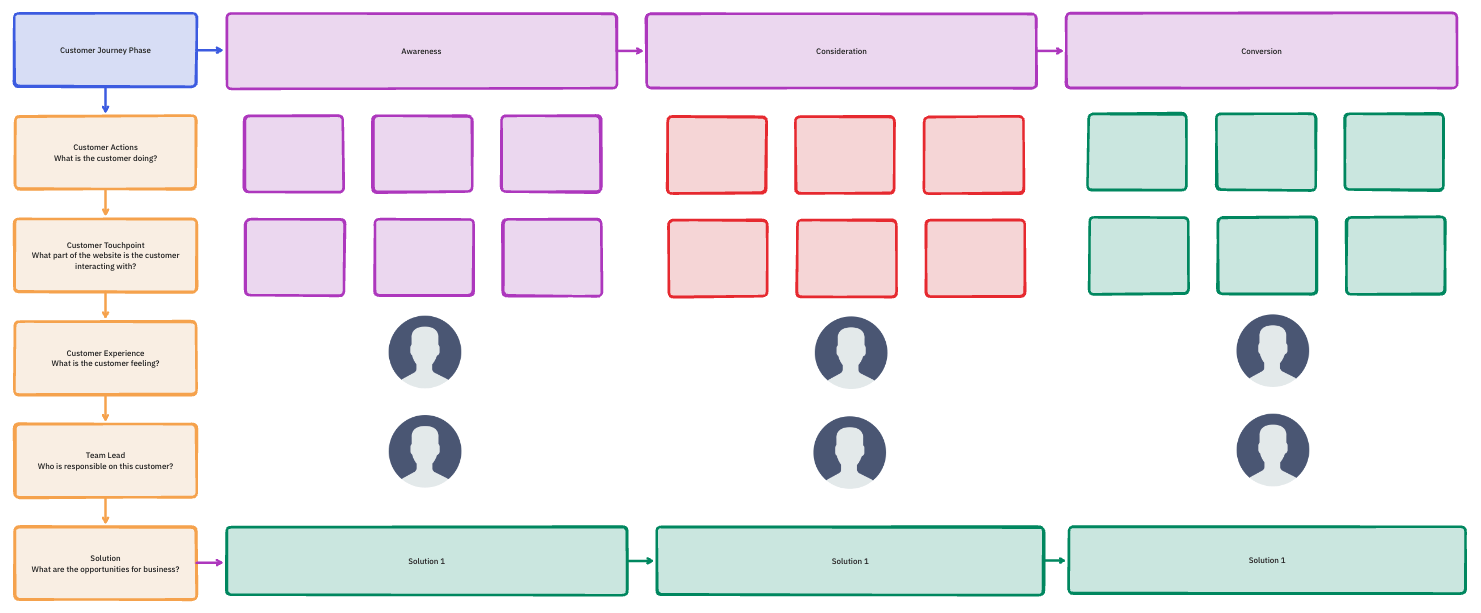
To bring this to life visually, use ClickUp Whiteboards. You can outline every stage, add touchpoints as sticky notes, and connect them with arrows to show how customers move through your funnel.
The beauty here is that everyone can collaborate in real time, so your CS team can add insights while your product team highlights technical constraints and your marketing team notes where messaging might be off.
To get started faster, use the ClickUp Customer Journey Map Template. It helps you map stages like Awareness, Consideration, Purchase, Retention, and Advocacy without any hassle.
You can add usage data, link to customer interview notes, and assign owners to specific improvement initiatives. Plus, it reveals patterns in loyalty and dissatisfaction to inform targeted improvements.
Once you know where customers typically fall off, shift your focus to predicting who’s likely to churn.
Get clear on what churn means for your business. For subscription companies, churn might mean a canceled subscription. For usage-based products, it could mean engagement dropping below a certain threshold even if the account remains technically active.
Then start identifying the warning signs that precede churn. You’ll likely spot patterns: login frequency declined, they stopped using core features, support tickets went unanswered, or payment issues surfaced.
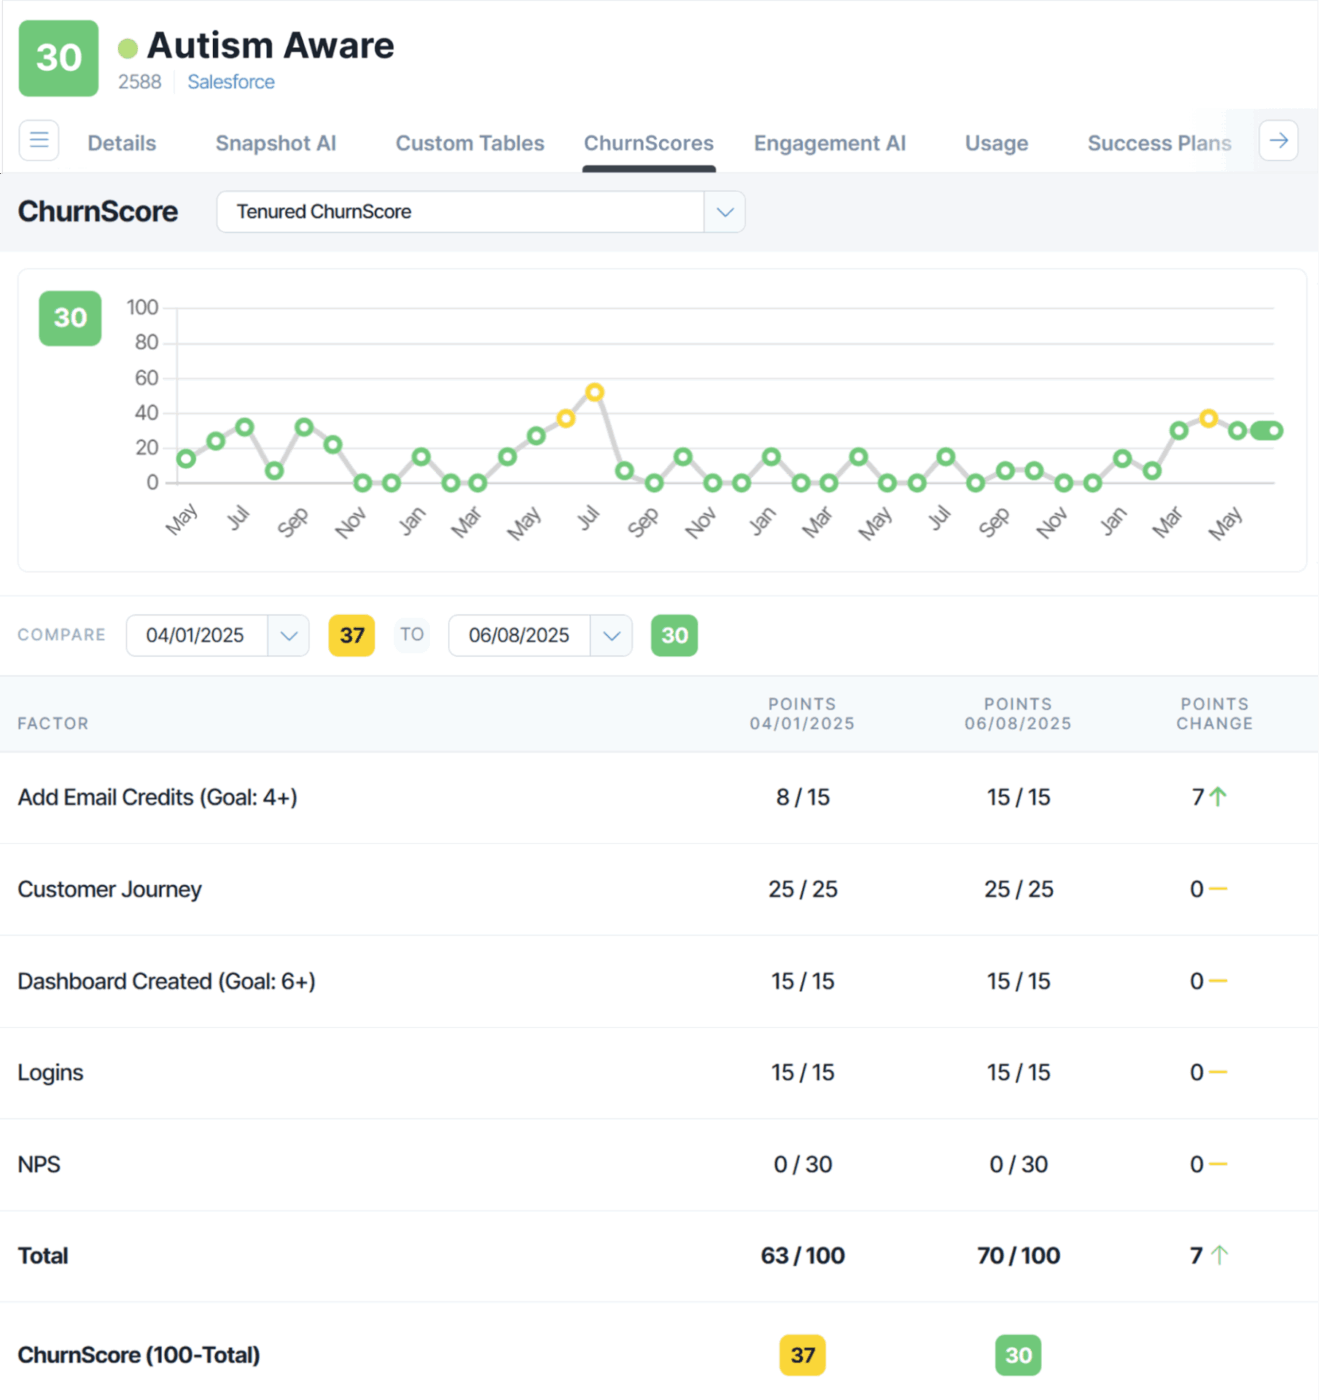
Build a scoring system that assigns health scores to every customer account. Start simple: green for healthy, yellow for at-risk, and red for critical. As you get more sophisticated, create numerical scores incorporating multiple factors.
You can automate scoring using AI Fields in ClickUp. Use the Sentiment AI Field in a Space, Folder, or List to gauge task sentiment as positive, neutral, or negative using task descriptions, Custom Fields, and comments.
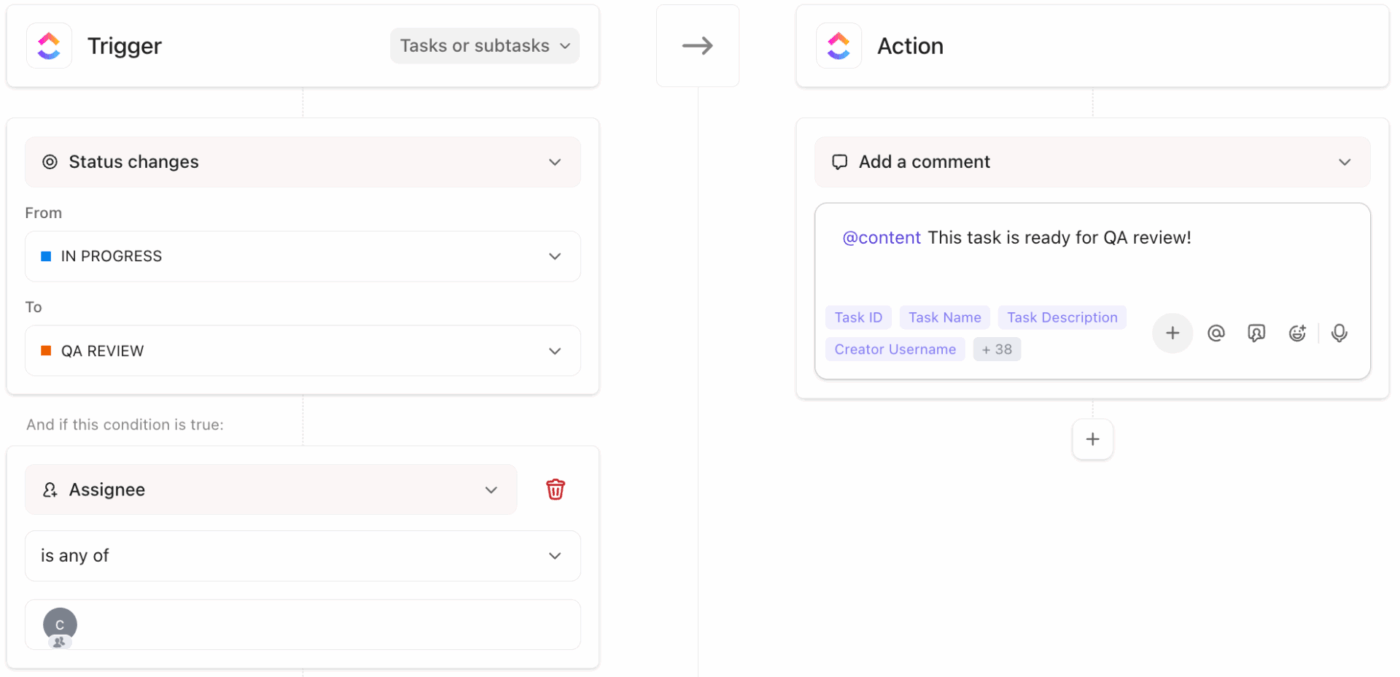
Set up automated alerts using ClickUp Automations. You can create smart workflows that trigger alerts, assign tasks, or update statuses based on customer activity.
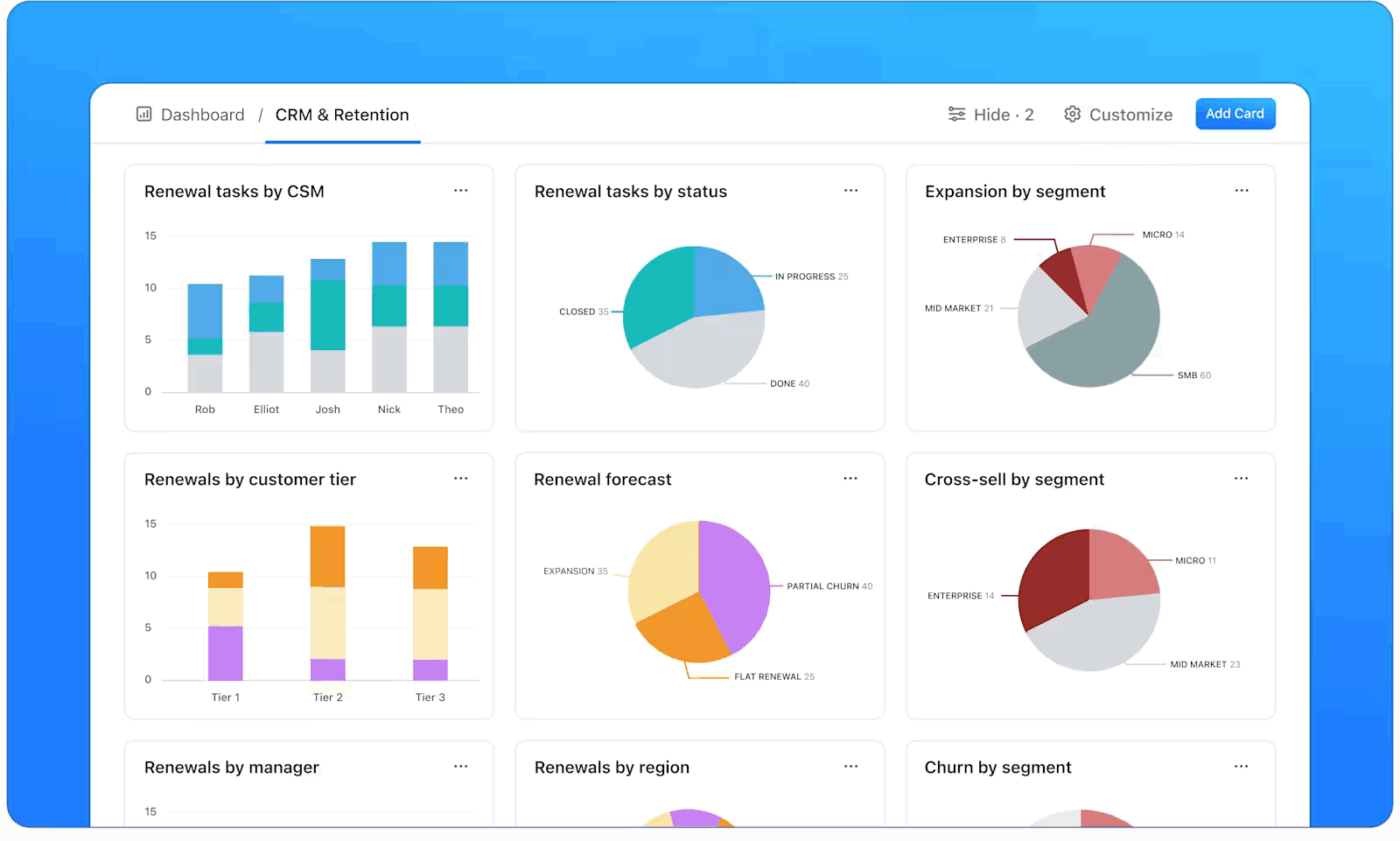
Once these automations are running, visualize their impact through ClickUp Dashboards. Add cards for retention KPIs such as health scores, engagement frequency, NPS trends, and churn rate over time.
These insights show what needs attention and which client retention strategies are working best.
Most churn happens in the first 90 days, so getting onboarding right is non-negotiable.
Build a structured onboarding flow that educates new users and helps them see value early. Start with milestones like account setup, first success, and advanced adoption. Assign ownership across your CS team for each milestone.
For example, a marketing automation platform might break onboarding into four stages: account setup, campaign launch, analytics review, and optimization. The CS team can then track how each customer progresses through these stages and identify where engagement slows down.
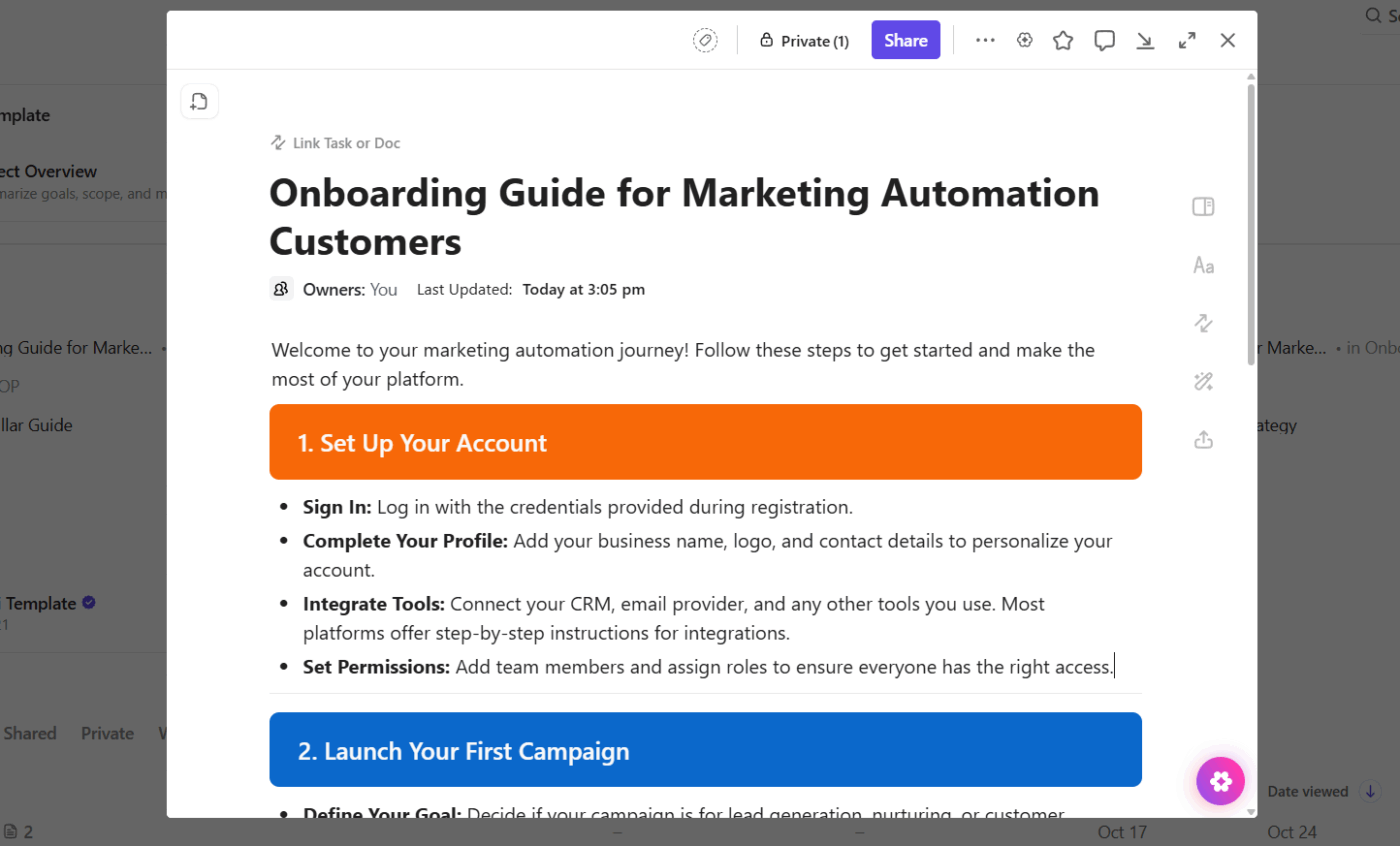
To organize all this knowledge and keep it accessible, use ClickUp Docs. It acts as your central hub for onboarding playbooks and training material.
Here’s how you can make it work:
You can also set up templates so every new client gets the same onboarding process without manual setup each time.
🚀 ClickUp Advantage: Onboarding becomes a lot smoother when your team doesn’t have to write every guide from scratch.
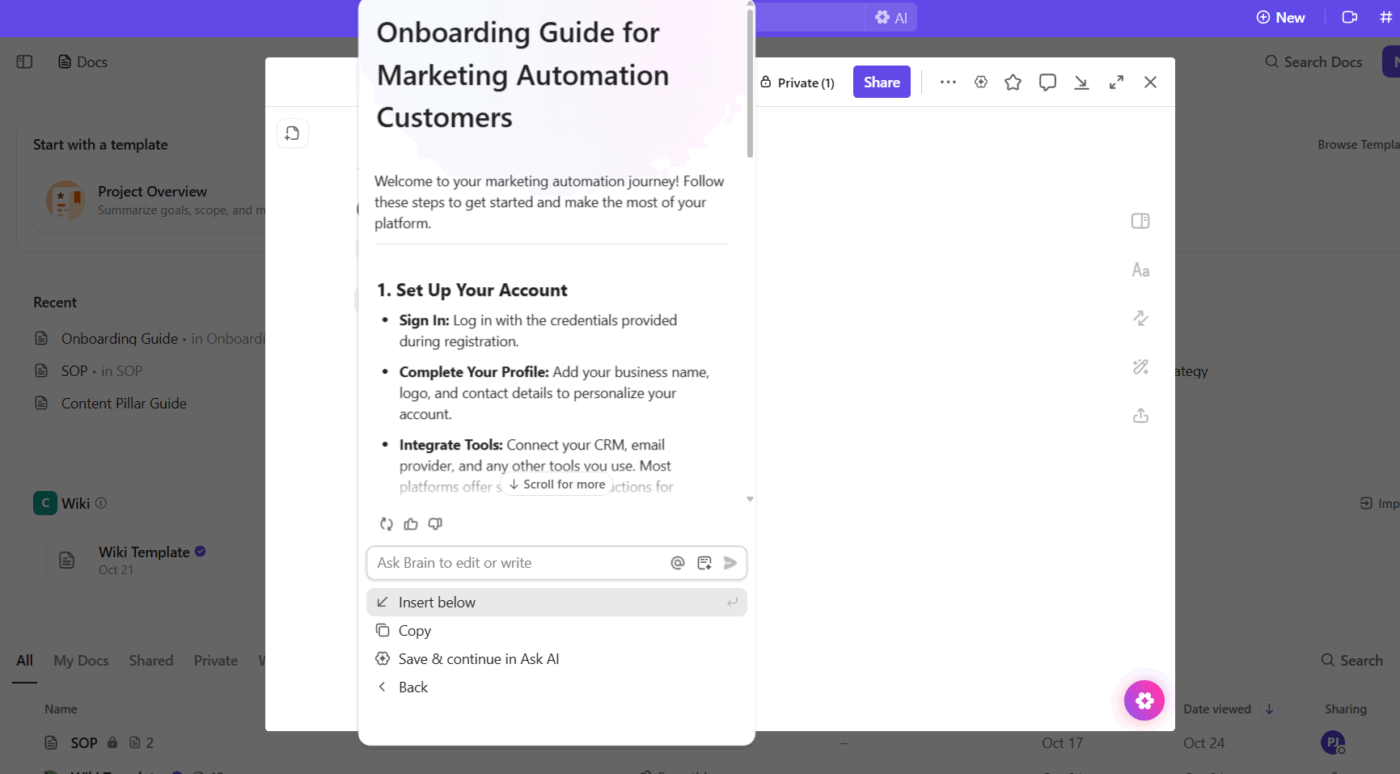
ClickUp Brain, the AI integrated within the platform, helps you instantly draft customer-ready onboarding content using your existing docs, tasks, and training materials.
It understands your workspace context and can create stage-wise walkthroughs, milestone checklists, or even personalized success guides for new users.
📌 Try this prompt: Write a step-by-step onboarding guide for new marketing automation customers, covering account setup, first campaign launch, analytics review, and optimization tips. Use a friendly, helpful tone and keep it under 500 words.
Reactive support waits for customers to hit problems and raise their hands for help. Proactive support spots issues brewing and steps in before customers even realize something’s wrong. This shift transforms your relationship from vendor to partner.
Start by creating a simple engagement cadence for different customer types. For example:
Encourage every team member to note key interactions, common issues, and feedback themes. When these insights stay documented, your team can respond faster and personalize every follow-up.
Use ClickUp Forms to gather quick feedback after each touchpoint—product updates, training sessions, or renewals.
Once responses come in, they become tasks for your success or product team to follow up on instantly. This eliminates the delay between feedback and action.
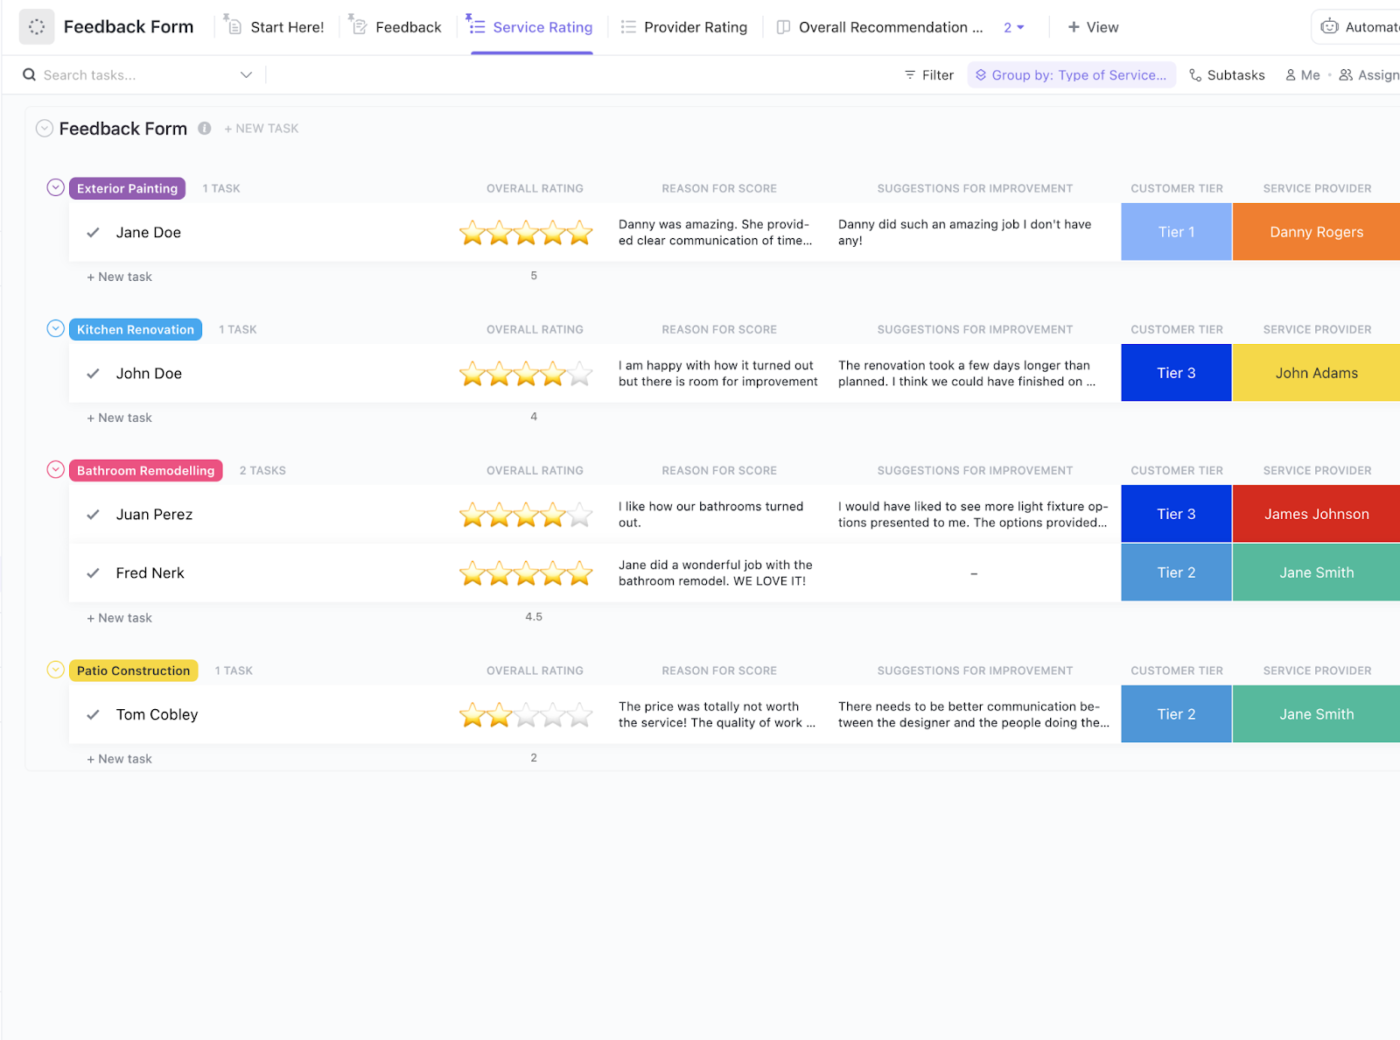
What’s more, when a form submission indicates dissatisfaction or highlights a critical issue, set an Automation to create a high-priority task, assign it to a team member based on the issue type, and set a due date.
If the task remains unresolved past the due date, another workflow automation can send reminders to create accountability.
🚀 ClickUp Advantage: When customers reach out with questions, every minute counts.
ClickUp Ambient Agents, specifically the Answers Agent, help your product and success teams respond faster by automatically answering common queries right inside ClickUp Chat Channels. It shares information drawn from your workspace, freeing up your team to focus on more complex issues.
Collecting feedback is pointless if you don’t close the loop. The real value lies in analyzing what you hear, identifying patterns, implementing changes, and then communicating those improvements to customers.
Start by establishing a predictable rhythm for feedback collection. Suppose you run monthly onboarding surveys and quarterly customer satisfaction check-ins. Over time, you’ll notice where sentiment dips and what triggers it. That’s your signal to act.
The loop has three layers: collection, collaboration, and action.

Here’s how to build it efficiently in ClickUp:
📖 Also Read: Customer Lifecycle Marketing: A Marketer’s Guide
Churned customers are data goldmines. You need to separate who’s worth re-engaging from who’s truly done, and build targeted workflows to bring the right ones back.
Start simple: segment churned users based on churn reason and potential value.
Let’s say half left because of missing integrations, and the rest due to pricing. The first group needs a product update email once the feature goes live; the second needs a loyalty offer or flexible plan.
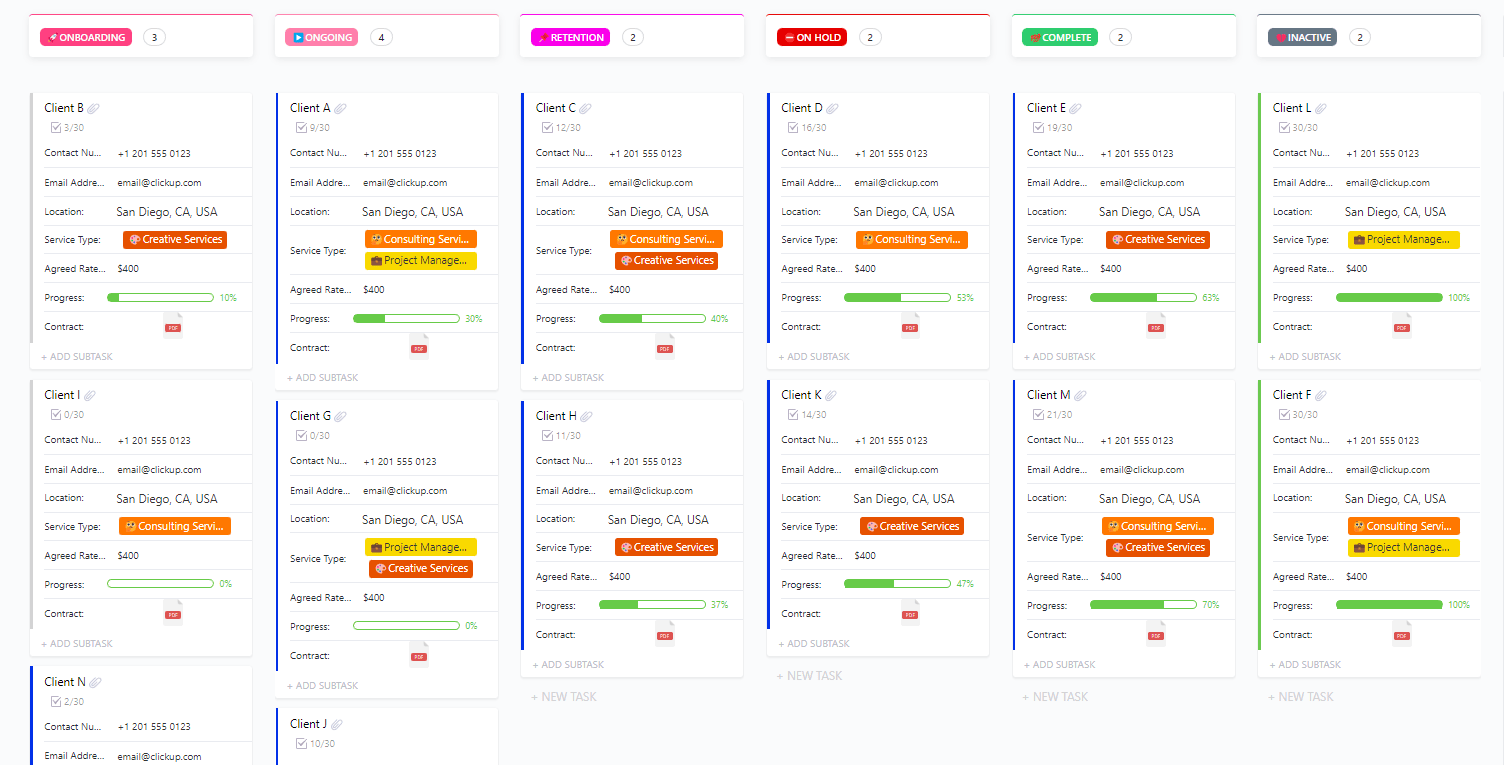
Organization is everything here. The ClickUp Account Management Template helps you create a structured space to log churned customers, note exit reasons, record last interactions, and assign account owners.
Once that foundation is in place, your re-engagement strategy can move smoothly.

Trigger reminders for CSMs to follow up after specific time intervals with Automations—say, 30, 60, or 90 days post-churn—based on account size or previous engagement. That way, no potential reactivation slips through.
Once reactivation starts, Dashboards give you a clear picture of what’s working: how many accounts re-engaged, which offers converted, and which touchpoints led to replies. These customer experience KPIs help your team refine future campaigns.
🤝 Friendly Reminder: Win-back campaigns only work when they feel intentional, not transactional. When your communication sounds like, ‘We heard you, we fixed it, and we’d love to show you,’ customers feel valued.
A churn reduction system works best when every team knows what triggers action, who’s responsible, and how success is measured.
Here’s a simple playbook you can adapt in ClickUp. 📝
| Trigger event | Action plan | Owner | Metric to track |
| Customer inactive for 14 days | Launch automated reactivation email sequence using ClickUp Automations, personalized based on past product usage | Customer Success Manager | Email open and click-through rate |
| Onboarding milestone missed | Assign tasks and share the relevant onboarding checklist via ClickUp Docs; track completion progress | Implementation Specialist | Time-to-activation |
| NPS score drops below seven | Ask ClickUp Brain to analyze patterns across accounts and suggest next actions | Customer Success Lead | Improvement in NPS after follow-up |
| Customer logs multiple support tickets in 10 days | Track account health in ClickUp Dashboards to spot recurring issues and assign follow-up tasks automatically | Product Manager | Reduction in repeat tickets |
| Churned account 45 days inactive | Use ClickUp Brain to identify engagement patterns and suggest tailored outreach; track win-back campaign progress in Dashboards | Account Executive | Win-back conversion rate |
🧠 Fun Fact: For churn models, longer tenure = less churn. One regression study found that each additional month of a subscription had a small but negative coefficient for churn likelihood. That means the longer you stay, the less likely you’ll leave.
Measuring the impact of your customer churn reduction playbook means tracking metrics that reflect customer behavior data, loyalty, and long-term value. You’ll want to keep a close eye on:
It tracks the percentage of customers lost each month by dividing the number of customers who left by your total at the start of the period.
Aim for a month-over-month decline of at least 5-10% to confirm your strategy is gaining traction.
🔍 Did You Know? Usage matters: in one churn-analysis study, customers who churned had significantly lower usage frequency (average ~14 times) compared to those who stayed (~16 times) over a period. This is subtle, but measurable.
This reveals customer sentiment and loyalty by asking how likely customers are to recommend your product on a scale of 0-10.
Rising NPS scores often precede improved retention by 2-3 months, making this a valuable leading indicator.
⚡️Template Archive: Once you’ve defined what NPS means for your business, the ClickUp Net Promoter Score® (NPS) Survey Template lets you collect customer feedback, organize responses, and track trends without leaving your workspace.
This metric shows the percentage of loyal customers you’ve kept over time. Track cohort retention to see how specific customer groups behave after implementing changes—strong retention rates typically exceed 85% for B2B SaaS.
It measures how often customers interact with your product or service.
Customers who engage weekly are less likely to churn than those who engage monthly, making this a critical leading indicator.
This metric ties everything together financially by showing the total revenue a customer generates over their relationship with you.
As your churn reduction efforts succeed, CLV should increase by 20-30%.
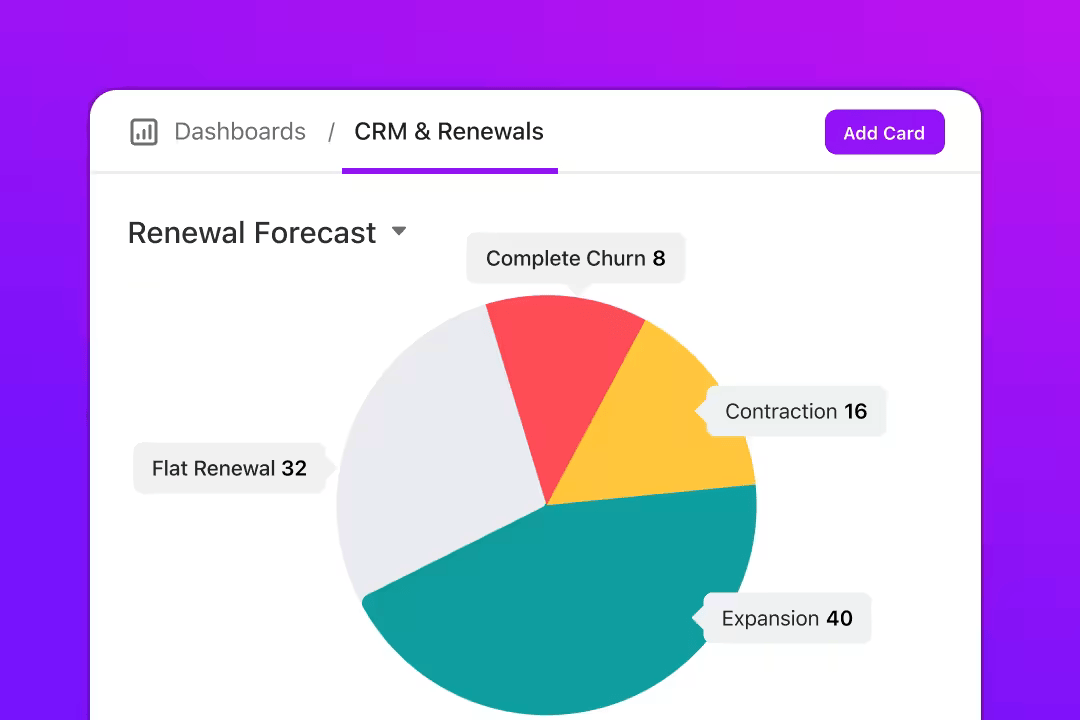
To track and interpret these metrics effectively, set up a retention dashboard in ClickUp. Dashboards bring all your churn data together through custom Cards, giving every team real-time visibility.
Here’s how you can build it out:
Here are some essential tools to include in your churn reduction playbook. 🧑💻
| Tool | Best for | Best features | Pricing* |
| ClickUp | End-to-end customer retention and churn management for SaaS teams, mid-market companies, and enterprises needing cross-functional visibility | Templates to structure onboarding and renewal workflows, Custom Task Statuses for churn risk tracking, flexible Views for customer segmentation, ClickUp Brain for identifying churn patterns and drafting outreach, Agents for automated follow-ups | Free forever; customizations available for enterprises |
| ChurnZero | Real-time churn monitoring and engagement for customer success teams managing large SaaS account portfolios | Product usage and engagement tracking in real time, ChurnRescue for prioritizing high-risk accounts, lifecycle-based NPS surveys, automated task creation, and weighted health scoring dashboards | Custom pricing |
| Custify | Core customer success operations for B2B SaaS teams that need clear health scoring and guided workflows | Customer 360 view combining usage, billing, and support data, configurable health scores tied to churn drivers, Playbooks for journey-based engagement, predictive analytics, and AI-assisted task automation | Custom pricing |
| UserMotion | Product-led retention analysis for SaaS companies where usage behavior drives churn and expansion | Automated lifecycle stage tracking, usage-based health scoring, churn and upsell signal detection, and intention-based account prioritization | Free; Starts at $199/month |
| Qualtrics CustomerXM | Enterprise-scale customer feedback and sentiment analysis for experience-led organizations | Text iQ for large-scale qualitative analysis, closed-loop follow-up workflows, sentiment and theme detection across channels, and statistical modeling to link feedback to retention outcomes | Custom pricing |
Your retention strategy fails when teams work in silos, run separate tools, and miss what happens between onboarding and renewal.
With the ClickUp Customer Service PM Software, you bring product, CS, and support teams into one place, so you see the full journey and act where it matters.
Start by using the ClickUp Customer Success Plan Template. This template:
For example, suppose a mid-tier SaaS customer enters Onboarding status and their Time-to-First-Value target slips. You open the template, assign the Onboarding Owner a task, set the status to At Churn Risk, and monitor until the value is delivered.
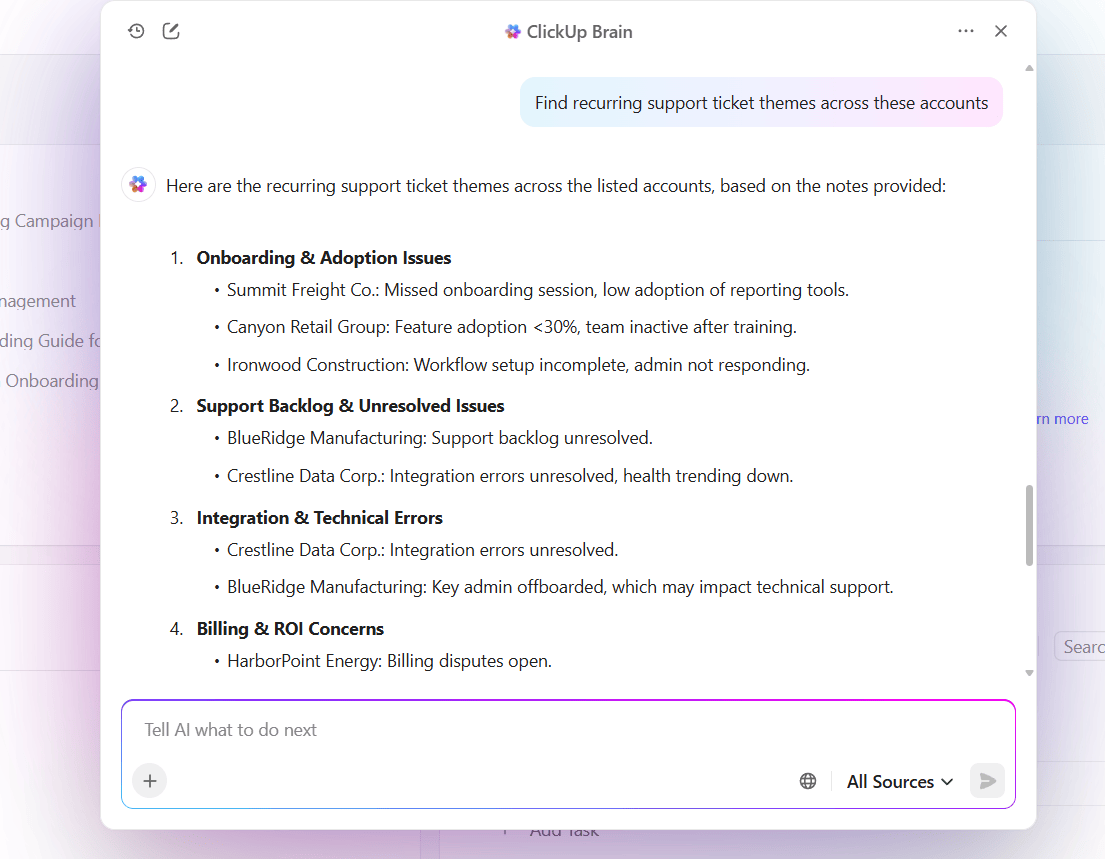
Once your workflow is in place, you need an engine that monitors trends and warns you of trouble. That’s ClickUp Brain. This AI layer is baked into your workspace and scans tasks, docs, chats, and data to highlight trends, flag risks, and suggest next steps.
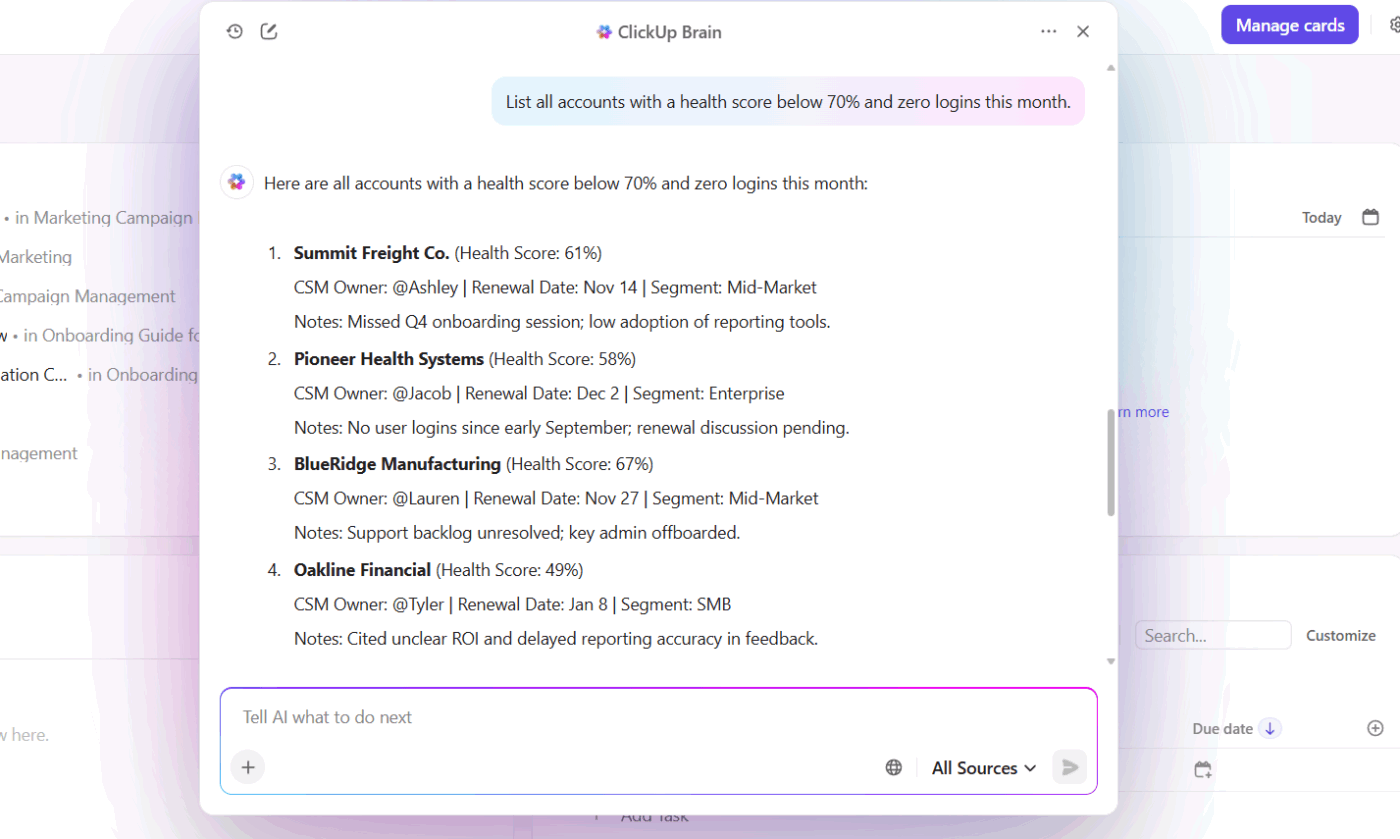
For example, you ask ClickUp Brain: ‘List all accounts with a health score below 70% and zero logins this month.’ The AI tool can:
Once you have structure and insight, move into action mode with ClickUp Ambient Agents. These are no-code, trigger-based agents that execute tasks automatically based on rules you define.
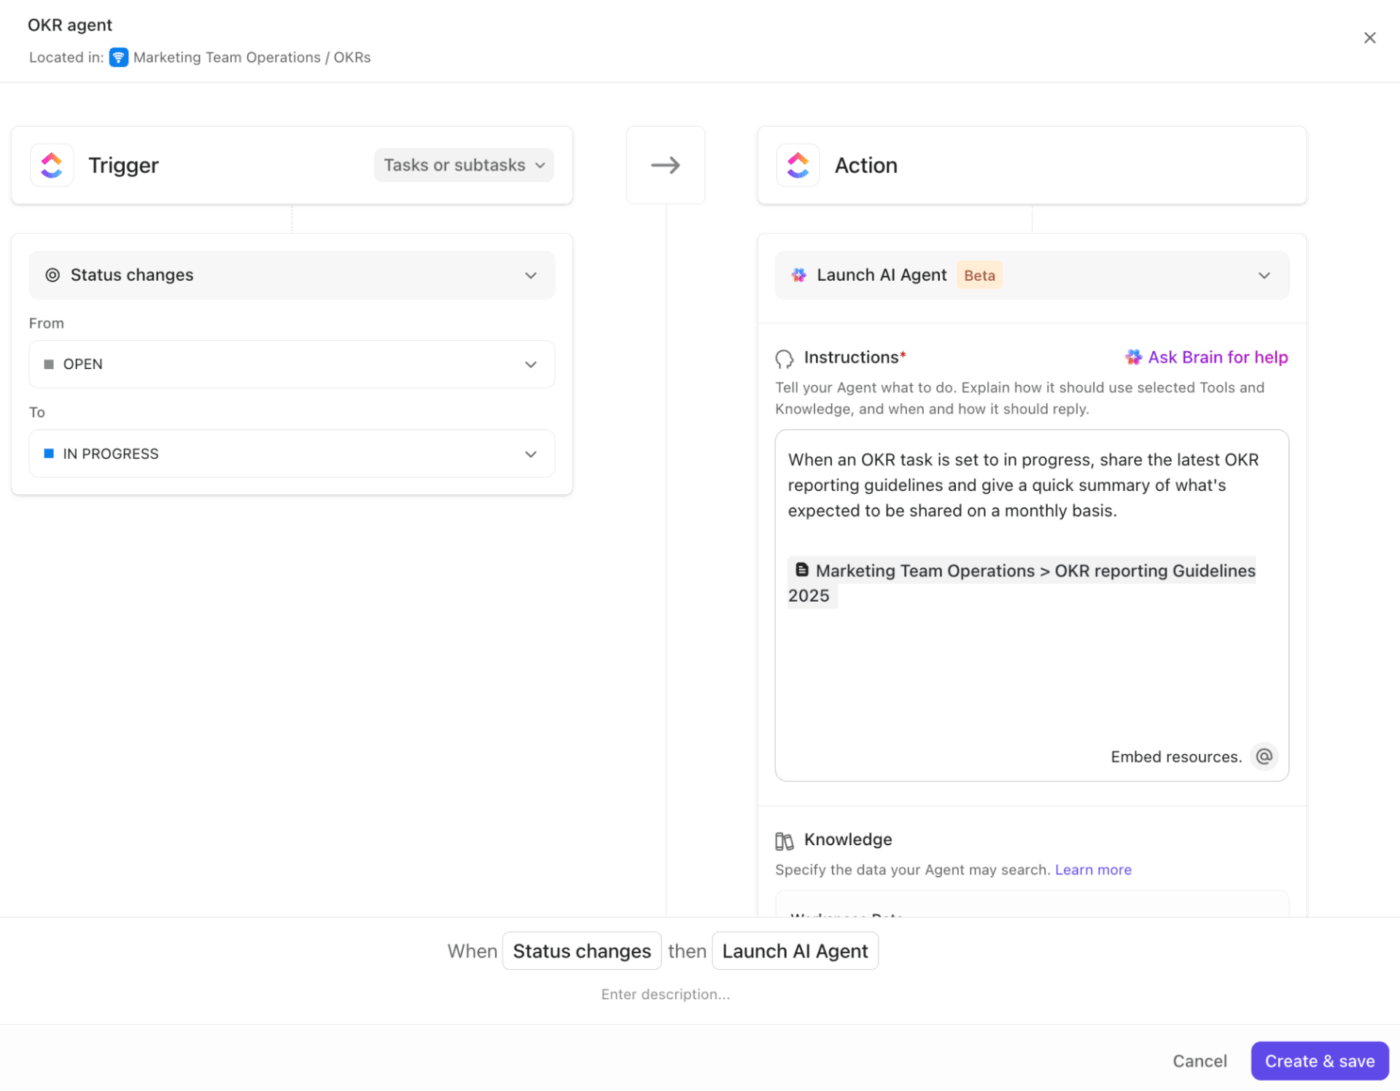
For example, when an account logs three support tickets in seven days, you configure an Ambient Agent to update the status to ‘At Churn Risk’, assign the account manager, and send an in-chat alert tagging the team. Meanwhile, the client sees a proactive check-in email from their success lead.
A G2 review shares:
I love the versatility of ClickUp and that our team can customize it to suit any situation – it’s not just a project management tool; it’s a whole Operational Hub for us! We manage everything from Client work to our CRM and love the flexibility of options and the in-built automations. We also love that ClickUp is constantly evolving and that they listen to their clients!
Watch this video to learn how you can use AI in customer service:
ChurnZero pulls together product usage data, health scores, and engagement metrics so your CS team can see what’s happening. The customer success software sends targeted messages and creates tasks automatically, so your team isn’t manually tracking hundreds of accounts.
The system watches customer activity in real time, flagging accounts that need intervention before they become a problem.
💡 Pro Tip: When users cancel, don’t send a generic ‘We’re sad to see you go.’ Use AI to identify the exact reason (pricing, complexity, lack of results) and offer a quick solution path, even if it means pointing them to a simpler plan.
Custify focuses on core customer success functions: tracking accounts, measuring health, and taking action. It aggregates data from your CRM, support desk, and product analytics, then shows you which accounts need attention and why.
You get a clean interface that makes sense on day one, not after three weeks of training videos. The predictive analytics tool lets you build workflows for different customer segments, so your enterprise accounts get white-glove treatment.
🧠 Fun Fact: Many fancy churn models fail to translate to business value because they focus on accuracy metrics like AUC, but neglect profit-driven evaluation metrics, e.g., is the retention action cost justified by the retained customer’s value? Research flags this gap.

UserMotion looks at churn from a product angle rather than a relationship angle. The customer retention platform analyzes how customers interact with your product, then surfaces the accounts showing signs of trouble or opportunity.
Instead of manually reviewing usage dashboards, UserMotion scores accounts automatically and tells you which ones deserve attention right now. This works particularly well for product-led companies where usage drives everything.
📖 Also Read: How to Calculate and Increase User Retention
Qualtrics CustomerXM analyzes customer feedback and sentiment, plus turns that input into action plans. Where Qualtrics shines is in processing large volumes of qualitative feedback—open-ended survey responses, support conversations, social media mentions—and finding patterns that predict churn.
The text analytics engine reads through thousands of comments and identifies recurring themes, sentiment shifts, and specific pain points.
💡 Pro Tip: Offer long-time users early previews or influence opportunities, such as co-creating features or giving input on roadmap items. People stay where they feel seen and valued.
Many teams fall into common traps that reduce their ability to retain customers effectively. Let’s take a look at these and how to avoid them.
| Mistake | Why it happens | Better approach |
| Treating all churn as equal | Teams lump voluntary, involuntary, and downgrades together, skewing metrics and masking root issues | Classify churn by type and reason (e.g., payment failure, poor fit, competitor switch). Use this segmentation to prioritize product or retention fixes with the highest revenue impact |
| Ignoring silent churn | Accounts that stop expanding or using advanced features are not flagged because they haven’t canceled yet | Track expansion revenue, feature depth, and engagement per seat. Set up alerts for accounts that plateau for 2+ quarters without new adoption or upsells |
| Retention playbooks not evolving | Teams use the same renewal and success tactics across every lifecycle stage, even when product maturity and customer profiles change | Refresh playbooks quarterly using churn reason data and product usage trends. Tailor renewal strategies by customer segment and lifecycle phase |
🔍 Did You Know? Advanced churn prediction models, such as those using ensemble learning techniques, have achieved accuracy rates exceeding 99% in certain industries, like telecommunications.
Customer retention succeeds when every team understands what keeps customers engaged and acts before issues grow. A clear churn playbook helps teams stay coordinated, track signals that matter, and turn feedback into action that builds loyalty.
ClickUp makes that process seamless.
Use Dashboards to monitor engagement trends, Automations to trigger timely follow-ups, and ClickUp Brain to surface insights that guide smarter decisions. Every tool works together to strengthen relationships and keep customers invested.
Sign up for ClickUp today! ✅
A good churn rate for SaaS companies is usually under 5% per month for smaller businesses and under 1-2% per month for larger, established ones. Lower churn means customers are staying longer and finding value in the product.
Use this simple formula: Churn rate = (Customers lost during a period ÷ Total customers at the start of that period) x 100
For example, if you start the month with 1,000 customers and lose 50, your churn rate is (50 ÷ 1,000) x 100 = 5%.
AI can analyze usage patterns, support interactions, and payment behavior to spot early signs of dissatisfaction. It helps identify at-risk customers and suggests proactive actions to prevent them from leaving.
It’s best to review churn data monthly to track trends and quarterly for deeper analysis. Frequent reviews help teams respond quickly to problems before they grow.
Voluntary churn happens when customers actively choose to cancel their subscription. On the other hand, involuntary churn occurs due to failed payments or billing issues, not because the customer wanted to leave.
ClickUp helps customer success teams track renewals, feedback, and engagement in one place. With ClickUp Dashboards, teams can monitor churn trends; ClickUp Automations streamline follow-ups; and ClickUp Docs organize customer insights for better retention planning.

© 2026 ClickUp

There’s an easier way. Try a free AI Agent in ClickUp that actually does the work for you—set up in minutes, save hours every week.