


Still downloading templates?
There’s an easier way. Try a free AI Agent in ClickUp that actually does the work for you—set up in minutes, save hours every week.
Sorry, there were no results found for “”
Sorry, there were no results found for “”
Sorry, there were no results found for “”

Risk management Key Performance Indicators (KPIs) are far more than just numbers on a dashboard. They serve as an organization’s early warning system by identifying potential risks before they escalate, and as a roadmap for growth by highlighting improvement opportunities.
With risk management KPIs, you balance the big picture with the critical details. They help you identify and tackle potential vulnerabilities and strengthen your risk strategy.
So, whether you’re refining your current approach or starting from scratch, this blog is here to help you navigate the complexities of risk management KPIs.
Here’s a quick overview of risk management KPIs and their importance:
Business risk management is the systematic process of identifying, assessing, and mitigating potential risks that could negatively impact an organization’s goals and business performance.
It involves analyzing financial, operational, strategic, or compliance-related risks and implementing strategies to minimize their impact. The risk management process typically includes the following steps:
🔍 Risk identification: Recognizing potential risk factors that could impact the business
🎯 Risk assessment: Evaluating the likelihood and potential impact of these risks
🛡️ Risk mitigation: Implementing strategies to minimize or eliminate the identified risks
👀 Risk monitoring: Continuously overseeing the risk environment and the effectiveness of mitigation measures
Remember that risk management is not restricted to eliminating risks. You need to identify, prioritize, and manage risks efficiently to boost operational efficiency. Effective risk management requires a perfect balance of risk-taking and risk mitigation.
Risk management KPIs are quantifiable metrics used to assess the effectiveness of an organization’s risk management strategies. They provide insights into how well potential risks are identified, evaluated, and mitigated, ensuring that a business achieves its goals with minimal disruption and builds resilience.
🧠 Did you know? Risk management KPIs are different from key risk indicators (KRIs). KPIs measure success—how well you’re achieving business goals. For example, customer retention rate or revenue growth in a project. On the contrary, KRIs measure potential threats—they act as early warning signals. For example, high employee turnover or increasing customer complaints could indicate future risks.
KPIs help transform abstract risks into quantifiable data, helping businesses monitor risk exposure, measure the success of mitigation efforts, and align risk management with organizational goals.
Here are the key benefits of tracking risk management metrics:
Without risk management KPIs, organizations risk operating blindly, leaving them vulnerable to unforeseen disruptions. By setting clear benchmarks, businesses ensure risk management is not just a theoretical exercise but a practical, ongoing process.
🌻 Example: In 2018, Tesla faced scrutiny over workplace injuries at its Fremont factory. It closely monitored the Incident Frequency Rate (IFR) KPI and identified areas with higher injury rates. This improved Tesla’s injury record rate by 5%, which is better than the industry average.
Risk is everywhere—whether it’s a financial crisis, a cyberattack, or a bad business decision. And that’s why risk management needs to span across multiple domains, addressing distinct business challenges.
Below is a breakdown of key relevant areas in risk management:
| Risk type | Description |
| Financial risk | Involves managing risks related to market fluctuations, credit defaults, liquidity shortages, and investment losses. Think of a stock market crash wiping out investments |
| Operational risk | Covers risks arising from internal failures, human errors, technology breakdowns, or supply chain disruptions |
| Compliance risk | Ensures adherence to regulatory requirements and industry standards to avoid legal penalties and reputational damage. For example, a healthcare company tracks HIPAA Compliance Rate to avoid data privacy violations |
| Strategic risk | Concerns long-term business decisions, market competition, and external changes affecting organizational goals |
| Legal risk | Deals with exposure to lawsuits, contract disputes, intellectual property issues, and regulatory violations. A good example here would be a company being sued for patent infringement |
| Cybersecurity risk | Protects against data breaches, hacking, malware, and other digital threats that can compromise sensitive information |
| Reputational risk | Addresses potential damage to brand image due to negative publicity, customer dissatisfaction, or ethical lapses |
🧠 Did you know? KPIs trace their origins back to the 1870s, emerging during the industrial efficiency movement. Later, in the 20th century, influential thinkers like Frederick W. Taylor and Peter Drucker refined and expanded these ideas, bringing them into modern management practices.
Tracking the right risk KPIs is key to staying ahead. You can spot potential threats early, adjust your approach in real time, and stay ahead of risks before they turn into crises.
Let’s discuss the most essential risk management KPIs risk teams should track.
Monitoring specific risk metrics is essential to identify and mitigate risks within a business. Below are several critical KPIs viewed through an enterprise risk management lens:
This KPI tracks the number of risks an organization has recognized. Identifying risks early allows risk managers to take preventive actions against emerging risks and avoid costly surprises. This can include risks related to operations, finance, cybersecurity, and compliance. A well-maintained risk register helps prioritize threats and ensures resources are used efficiently.
🌟 How to track it effectively: Identify the severity of identified risks—whether they are low-impact risks or have medium or high impact.
Risk exposure measures the potential damage of a risk. It helps businesses understand the severity of threats and prioritize mitigation efforts. This KPI is often measured in financial terms but can also include reputational or operational impacts. By understanding exposure levels, businesses can set risk tolerance limits and allocate resources effectively.
🌟 How to track it effectively: Categorize Risks (e.g., financial, operational, cybersecurity, compliance) and monitor trends over time to detect potential threats.
This KPI measures how well an organization is reducing or controlling risks. Effective risk mitigation includes preventive measures, contingency plans, and process improvements. Regular assessments ensure strategies remain relevant and effective.
🌟 How to track it effectively: Assign a score (1-10 or Low-Medium-High) to each risk based on impact and likelihood. You can use ClickUp’s free risk assessment calculator to standardize scoring and track how the score changes post-mitigation efforts to measure progress.
Risk frequency tracks how often a particular risk occurs within a specific period. Frequent risks may indicate weaknesses in current processes or risk controls. Monitoring this KPI helps businesses spot patterns and take corrective actions.
🌟 How to track it effectively: Use a 3-month or 6-month rolling average to calculate risk frequency. This smooths out fluctuations and reveals long-term trends.
Risk costs refer to the financial impact of risks on a business. This includes direct losses, such as legal fines or data breaches, and indirect costs like reputational damage.
🌟 How to track it effectively: Maintain a centralized risk cost ledger to document financial losses, legal fines, and mitigation expenses. You can also compare risk costs against mitigation investments to ensure cost-effective risk management.
Employees play a crucial role in identifying and reporting risks in their daily operations. This KPI measures how well employees understand and respond to risks. A workforce that recognizes potential threats can prevent incidents before they escalate.
🌟 How to track it effectively: Use leaderboards or point systems for reporting risks, spotting phishing emails, or passing quizzes. You can also conduct security drills, or compliance breach simulations to measure employee responses.
This KPI tracks how effectively a business follows legal and industry regulations. Non-compliance can lead to fines, lawsuits, and reputational damage. Regular audits, compliance training, and strong internal policies help organizations stay compliant.
🌟 How to track it effectively: Implement a compliance management system, conduct regular audits, track compliance trends, and take corrective actions for non-compliant areas.
🧠 Did you know? The Raspberry Pi Foundation tracks credit limits for customers based on their payment history as a KPI. The Foundation reviews the credit limits regularly with debt aging and collection history to mitigate potential credit risks.
📮ClickUp Insight: 92% of workers use inconsistent methods to track action items, which results in missed decisions and delayed execution. Whether you’re sending follow-up notes or using spreadsheets, the process is often scattered and inefficient. ClickUp’s Task Management Solution ensures seamless conversion of conversations into tasks—so your team can act fast and stay aligned.
Cybersecurity risk KPIs help organizations measure the effectiveness of their security strategies, identify vulnerabilities, and improve incident response. Below are key KPIs that provide actionable insights into an organization’s cybersecurity posture:
Security ratings are scores that objectively assess an organization’s cybersecurity position. These ratings are often generated by third-party platforms and are based on factors such as endpoint security, patching cadence, web application security, network security, phishing risks, DNS health, and more.
🌟 How to track it effectively: Use platforms like SecurityScorecard that provide real-time security ratings—A-F letter grade on 10 security categories. This enables organizations to benchmark cybersecurity performance against industry standards.
MTTD measures the average time taken to identify a security threat or breach. A lower MTTD indicates a more efficient detection system, reducing the potential damage caused by cyberattacks. For instance, if an organization’s MTTD is 48 hours, it means it takes two days on average to detect a threat.
MTTD = Total Time to Detect Incidents / Number of Incidents
🌟 How to track it effectively: Deploy Security Information and Event Management (SIEM) tools like Splunk or Datadog to aggregate security alerts and detect threats in real time.
MTTR measures the average time taken to contain and remediate a security incident after detection. A lower MTTR indicates a more effective incident response process.
For example, an MTTR of 4 hours against a 5 or an 8-hour MTTR means the organization can resolve incidents quickly. Automation tools and well-defined incident response plans can significantly improve MTTR.
MTTR = Total Time Spent Resolving Incidents / Number of Incidents
🌟 How to track it effectively: Use historical data to set an acceptable MTTR threshold and configure real-time alerts for deviations.
This KPI tracks the average number of days taken to apply patches to known vulnerabilities. A shorter patching cycle reduces the window of opportunity for attackers.
For example, if an organization takes 10 days to patch critical vulnerabilities, it is at higher risk compared to one that patches within 48 hours.
VPR = Number of Patched Vulnerabilities/ Total Number of Identified Vulnerabilities
🌟 How to track it effectively: Define risk-based patching deadlines (e.g., critical vulnerabilities must be patched within 48 hours).
Access management KPI measures the effectiveness of user authentication and authorization processes. It tracks the percentage of successful logins versus failed attempts. Limiting users having administrative access and securing strong passwords and biometrics can increase user authentication success rate.
A high success rate with minimal failed attempts can indicate robust access controls. Multi-factor authentication (MFA) and role-based access controls (RBAC) are critical for improving this KPI.
🌟 How to track it effectively: Set up anomaly detection to flag repeated failed logins, unauthorized access attempts, or unusual geolocations.
NHT measures the percentage of traffic originating from bots, scripts, or automated systems rather than human users. High NHT can indicate malicious activities like scraping, DDoS attacks, or credential stuffing. Monitoring NHT regularly can help organizations identify and block suspicious traffic.
🌟 How to track it effectively: Use Web application firewalls (WAFs) and bot management solutions to effectively monitor and mitigate NHT.
Cost per incident measures the financial impact of a cybersecurity incident, including direct costs (e.g., remediation, fines) and indirect costs (e.g., reputational damage, downtime). Reducing this cost involves investing in proactive security measures and incident response planning.
Cost Per Incident = Total Cost of Incidents / Number of Incidents
🌟 How to track it effectively: Track costs separately for response, remediation, downtime, legal fees, reputational damage, and compliance fines. This helps identify which areas contribute most to financial impact.
📖 Read More: Key Performance Indicator (KPI) Examples & Templates
Supply chain businesses can enhance their performance, ensure business continuity, and maintain a competitive edge in the market by tracking common supply chain risk management KPIs.
On-time delivery measures the percentage of orders delivered to customers within the promised timeframe. This KPI reflects the efficiency of the supply chain in meeting customer expectations.
A high on-time delivery rate indicates effective coordination among procurement, production, and logistics. Consistently monitoring this KPI helps identify bottlenecks, reduce risk, and spot areas for improvement in the delivery process.
🌟 How to track it effectively: Track first-time-right (FTR) deliveries, which shows how often deliveries are completed without needing rework or corrections.
Days sales of inventory (DSI) indicates the average number of days a company takes to sell its entire inventory. It provides insights into inventory management efficiency and product demand.
A lower DSI suggests efficient inventory turnover, while a higher DSI may indicate overstocking or slow-moving products, increasing risk.
🌟 How to track it effectively: Compare DSI trends with sales forecasts to optimize reorder points and avoid overstocking. Plus, if you have multiple warehouses or stores, track DSI per location to identify slow-moving stock areas.
This risk KPI measures the average cost incurred to ship one unit of goods. It includes expenses related to transportation, fuel, handling, and other logistics costs. Monitoring freight cost per tonne shipped enables companies to assess the cost-effectiveness of their shipping methods and identify opportunities for cost reduction.
Shipping distance, mode of transportation, fuel prices, and shipment volume are key factors that affect freight costs. Optimizing routes, consolidating shipments, and negotiating favorable rates with carriers can help reduce these expenses and risks.
🌟 How to track it effectively: Use ERP or transportation management systems like SAP, Oracle, or FreightPOP to collect real-time shipping costs and categorize expenses (fuel, carrier fees, warehousing, etc.) to pinpoint cost drivers.
Inventory turnover indicates how many times a company’s inventory is sold and replaced over a specific period. It reflects the efficiency of inventory management and product demand.
A higher turnover rate signifies effective inventory management, while a lower rate may suggest overstocking or weak sales. High inventory turnover also reduces holding costs, minimizes the risk of obsolescence, and improves cash flow.
🌟 How to track it effectively: Track turnover separately for high-demand, seasonal, and slow-moving items to optimize stocking levels.
This KPI measures the frequency of stockouts resulting from inaccurate demand forecasting. Frequent stockouts can lead to lost sales and diminished customer trust.
You can improve forecast accuracy by using advanced analytics, incorporating real-time sales data, and collaborating closely with suppliers.
🌟 How to track it effectively: Categorize stockouts into forecasting errors, supply chain issues, and unexpected demand surges to pinpoint areas for improvement.
Inventory system downtime refers to periods when the inventory management system is non-operational, affecting the ability to track and manage stock levels. Downtime can disrupt operations, leading to delays and errors.
🌟 How to track it effectively: Maintain a downtime log to record the date, duration, cause, and resolution of each incident.
The damaged stock rate represents the percentage of inventory that becomes unsellable due to damage during handling, storage, or transportation. To calculate, divide the quantity of damaged stock by the total inventory and multiply by 100.
A high damaged stock rate can lead to increased costs and reduced profitability.
🌟 How to track it effectively: Track damaged stock in real time using barcode scanners or Radio Frequency Identification (RFID) tags to detect patterns, such as frequent damage in certain locations or damage spike during peak seasons.
Now, it’s time to look at how you can measure risk KPIs. Here are some guidelines to help you get started.
If you’re in fintech, your biggest risks might involve fraud detection, regulatory compliance, or data security breaches. But if you’re running a supply chain software business, your concerns could lean more toward vendor reliability, operational disruptions, or delivery delays.
In short, one-size-fits-all KPIs don’t work—they need to align with your industry’s unique risk landscape and your company’s broader goals.
First, think about what you’re trying to achieve. Do you want to reduce fraud losses by 20%? Ensure 99.9% system uptime? Cut vendor-related disruptions by half? Your risk management KPIs should directly support these objectives.
Next, you need to map KPIs to business goals. For example, if you are focusing on compliance, track regulatory audit pass rates or policy violation incidents.
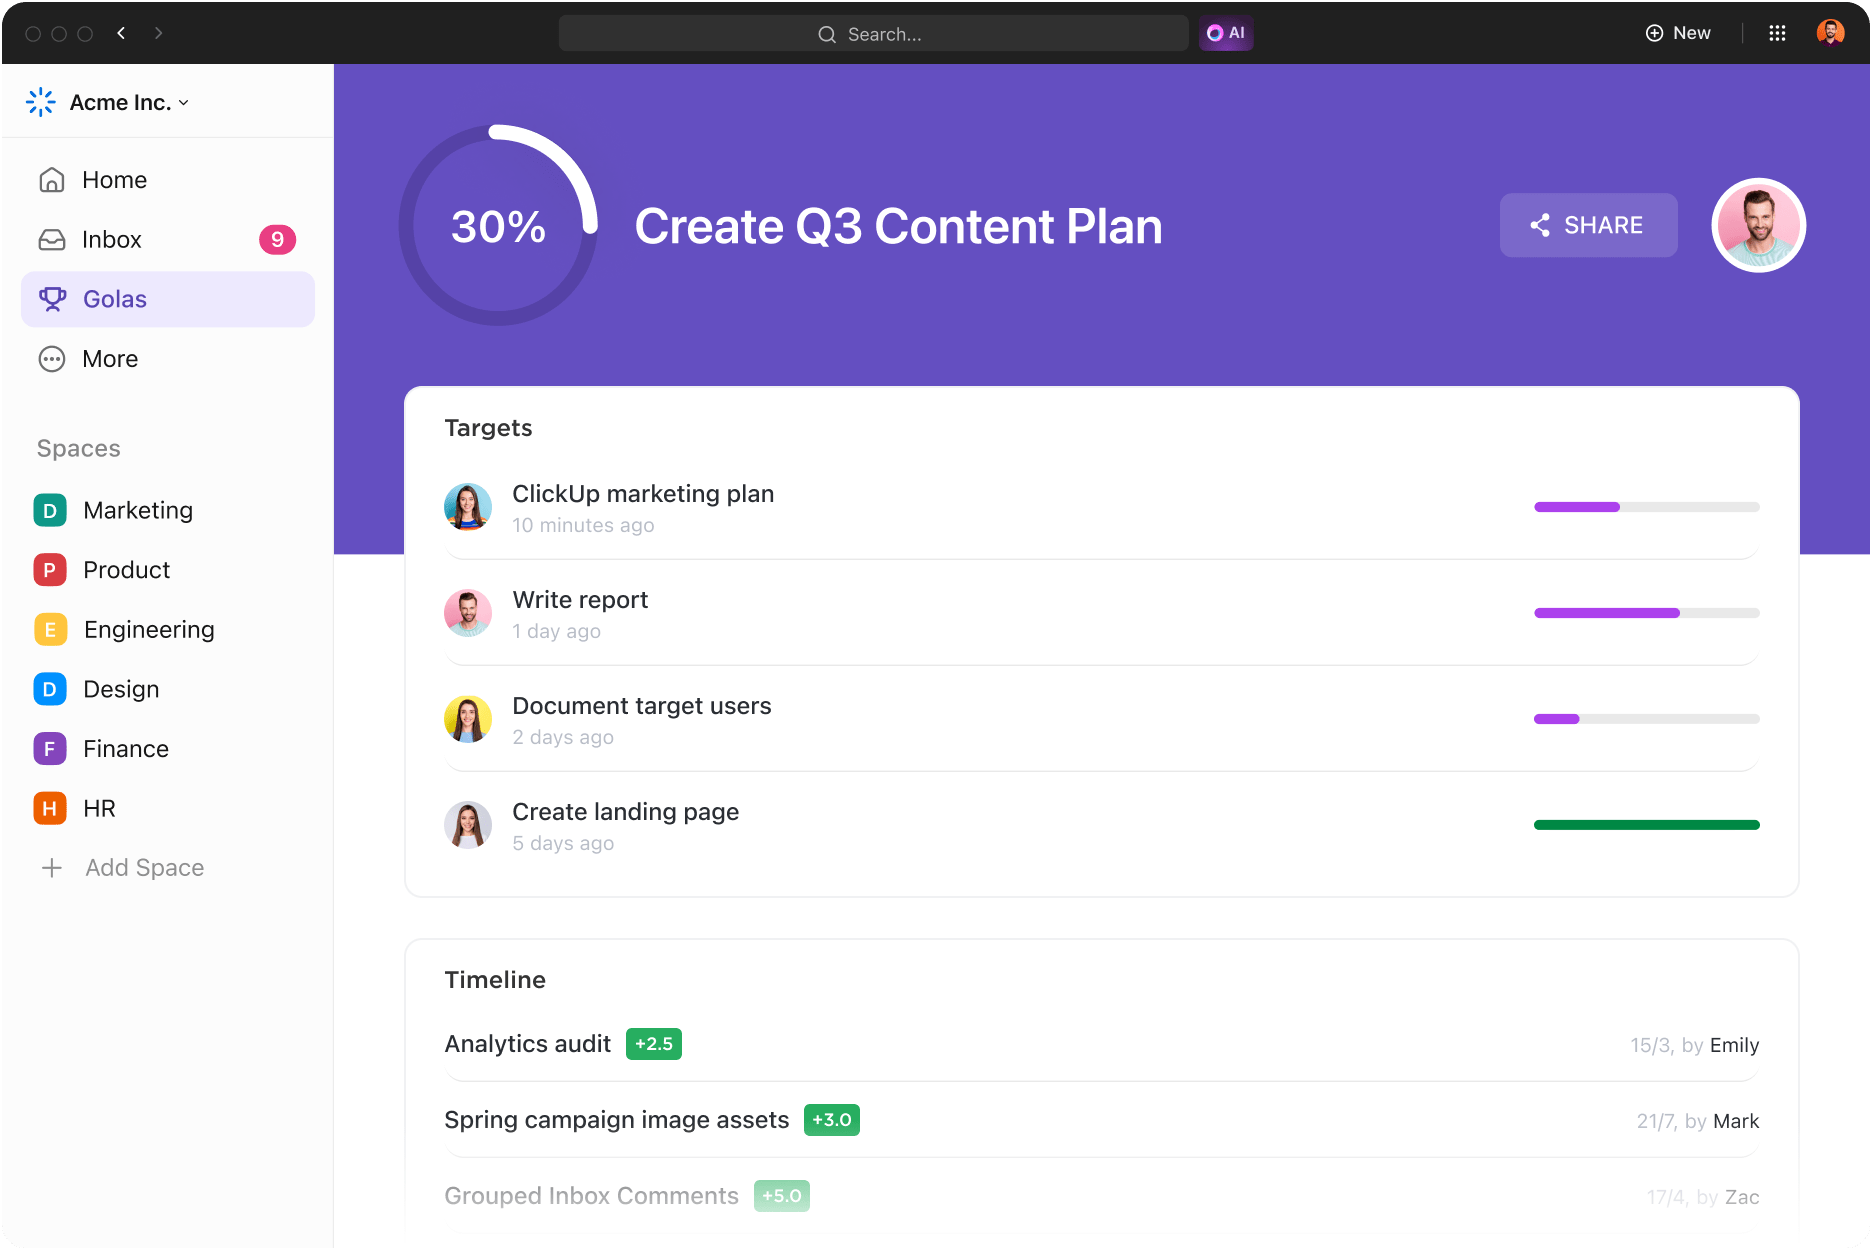
Want to map key business objectives, track progress, and achieve performance? Try ClickUp Goals! It helps you set business objectives and key results to achieve those objectives. For example, you can set the target to reduce Mean Time to Detect (MTTD) security incidents from 6 hours to 3 hours in the next quarter.
Once you’ve identified relevant KPIs, you need to set KPI benchmarks for effective performance tracking. Without benchmarks, you won’t know whether your KPIs indicate success, failure, or just average performance.
Here’s how you can set risk management KPI benchmarks:
Analyzing KPIs goes beyond tracking data. You need to identify risks early, monitor trends, and make informed decisions. This is why you need tools with automated tracking systems, visual dashboards, and early-warning mechanisms that flag potential threats.
A centralized dashboard that displays KPIs in real time can be invaluable here. ClickUp Dashboards can help you here. They visualize all KPIs so you get better insights and make more informed decisions.
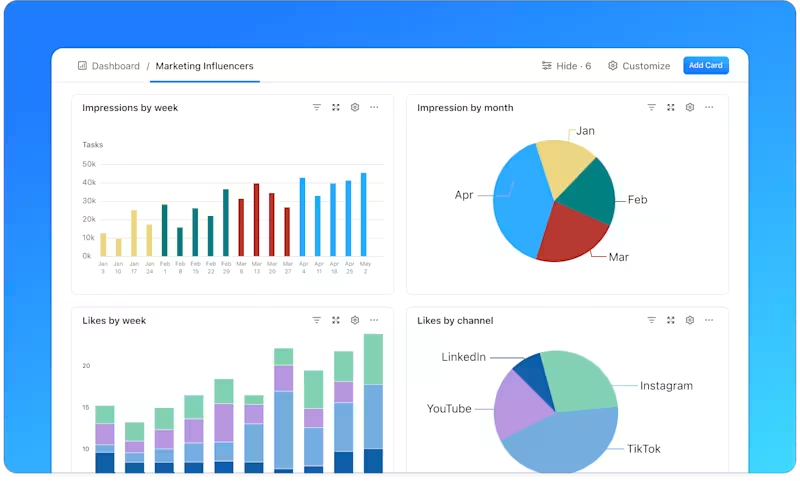
Plus, you can customize your dashboards with 50+ widgets for critical risk analysis and detecting risk patterns.
Learn how to set up a Dashboard in ClickUp!👇
If you need detailed insights on your KPIs, use ClickUp Brain, ClickUp’s powerful AI assistant. It analyzes data from the dashboards and gives you instant answers.

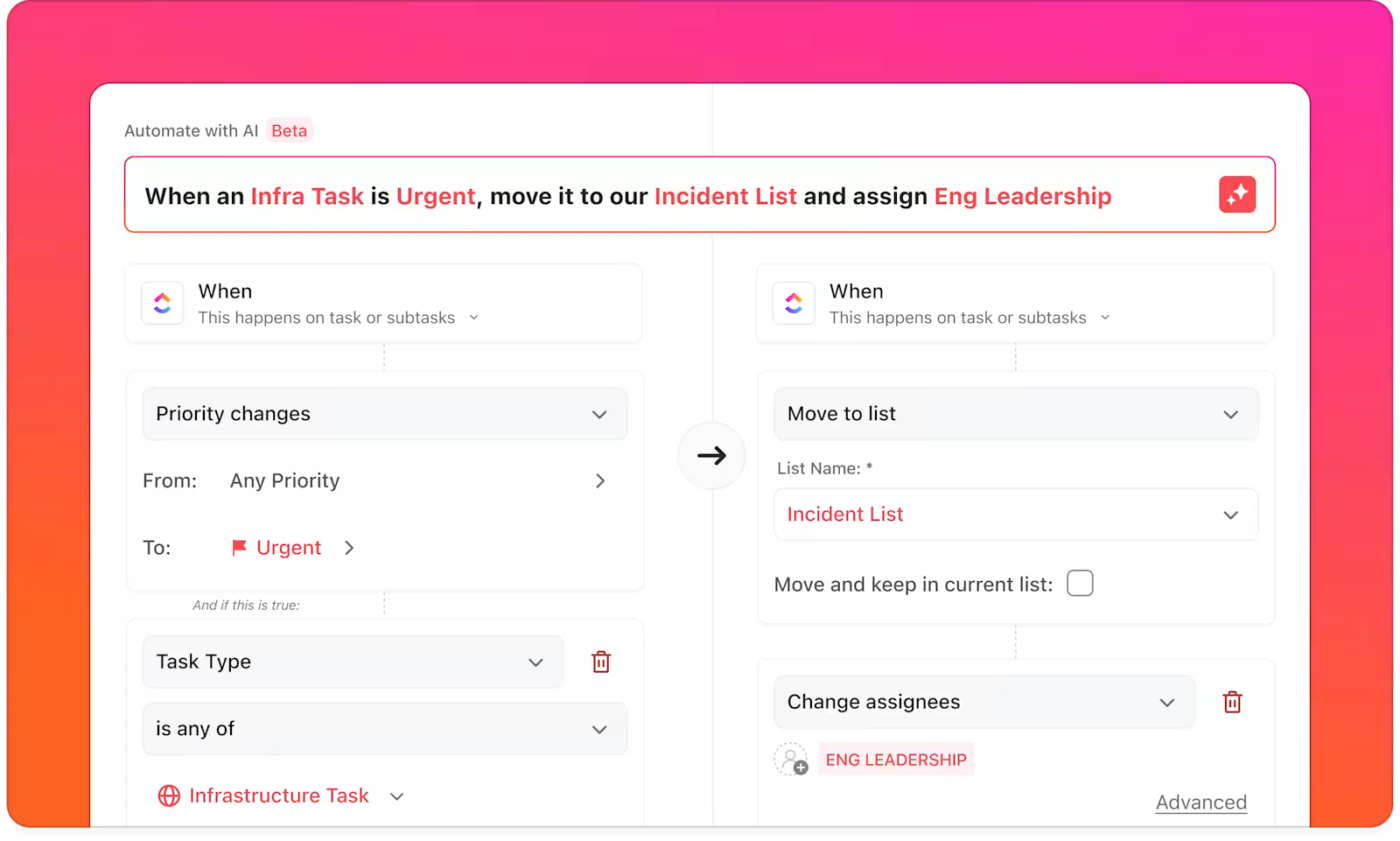
Automated workflows streamline risk management KPI analysis by collecting data in real time, triggering alerts, and generating reports without manual intervention. To set this up, start by mapping out your risk response process.
Define key triggers—specific thresholds that, when crossed, require immediate action. For example, if system downtime exceeds 15 minutes, an automated alert can notify the IT team, create a task in your project management tool, and escalate the issue if unresolved within a set timeframe.
ClickUp Automations can help you automate KPI tracking and analysis by setting triggers. For example, you can set up a trigger that if the incident response time KPI exceeds the target, the risk management team should get an automated alert. This reduces the need for manual KPI tracking, especially for critical risks.
When speaking about risks, you cannot miss out on internal audits that serve as the backbone of continuous improvement. They help you evaluate whether risk management efforts are working effectively and highlight areas for enhancement.
If you need a simple tool to review KPIs, use the ClickUp KPI Template. It helps visualize KPIs and offers better clarity into the company’s objectives and KPI performance. Its Timeline View helps set milestones and track progress. Plus, the Department View makes it easier to track KPIs across different departments.
The ClickUp Risk Assessment Whiteboard Template is also an excellent resource for managing risks. Its customizable color-coded map lets you identify potential risks at a glance and document their probability and magnitude in one place.
The ClickUp Risk Register Template ensures no risk goes unmanaged. With fields for ‘Description’, ‘Consequence’, ‘Mitigation Cost’, and ‘Probability’, it organizes risks by priority, offering clear visibility into risk mitigation strategies and associated costs.
💡Pro Tip: Integrate internal audits with ClickUp’s risk assessment templates, tools, and performance indicator analysis, which can help businesses build a tamper-proof risk management system.
Several challenges can hamper the successful deployment of risk management KPIs. Let’s see the common obstacles and strategies to overcome them.
❗Misalignment between chosen KPIs and the actual risks faced by the organization offers misleading insights and results in poor decision-making.
✅ Solution: Create comprehensive risk assessment checklists to identify critical areas and develop KPIs that provide meaningful insights into these specific risks.
🌻 Example: Nike faced backlash for unethical labor practices in the 1990s. To mitigate reputational and compliance risks, Nike implemented KPIs such as supplier audit scores, worker satisfaction surveys, and compliance violation rates. With stricter tracking and supplier training, Nike improved working conditions in some of its factories.
❗KPIs rely heavily on accurate and timely data. Poor data quality can lead to incorrect risk assessments and misguided decision-making. Challenges in this area include data inconsistencies, outdated information, and errors in data collection processes that can result in inaccurate KPI measurements.
✅ Solution: Implement data governance frameworks, conduct regular data audits, and invest in reliable data management systems to enhance data quality and ensure that KPIs are based on accurate information.
❗For KPIs to be effective, they must be smoothly integrated into the organization’s existing processes and decision-making frameworks. A lack of integration can result in KPIs being overlooked or undervalued.
✅ Solution: Embed KPIs into performance management systems, align them with strategic objectives, and review them regularly.
❗Implementing new KPIs can be met with resistance from employees. It can stem from a lack of understanding of the KPIs’ importance or fear of increased accountability.
✅ Solution: Invest in change management initiatives, provide training to employees, and communicate the benefits of KPIs in enhancing risk management and overall organizational performance.
🌻 Example: Infosys leveraged data-driven risk management to tackle water scarcity. Its ERM team tracked per-capita water consumption, rainfall patterns, tanker water costs, and external supply usage. By analyzing these metrics, Infosys optimized conservation strategies, reducing per-capita water consumption.
By proactively addressing these challenges, many organizations can enhance the effectiveness of their risk management KPIs, leading to better identification, assessment, and risk mitigation.
Businesses are vulnerable to risks 24/7, from operational hiccups to market uncertainties. While these risks can’t be entirely eradicated, they can be significantly mitigated with the right strategies. Monitoring risk management KPIs is key to identifying vulnerabilities and ensuring stability.
With a platform like ClickUp, you can easily track and manage risk-related metrics and KPIs in one centralized platform. Its customizable dashboards, task automation, and real-time reporting empower your team to stay ahead of challenges while maximizing efficiency.
Risk may be constant, but with ClickUp, you can track meaningful metrics. Sign up with ClickUp and mitigate risk in a new, modern way.

© 2026 ClickUp

There’s an easier way. Try a free AI Agent in ClickUp that actually does the work for you—set up in minutes, save hours every week.