Optimize Operational Efficiency: Reduce Waste, Improve Productivity, and Push Revenue Growth


Sorry, there were no results found for “”
Sorry, there were no results found for “”
Sorry, there were no results found for “”
An important part of business management is paying attention to operational efficiency. Many businesses, despite having skilled workers and ambitious plans, end up with wasted resources due to inefficient processes eating away at their profits.
Unfortunately, improving efficiency is a common struggle for many organizations. They put in effort toward increasing revenue but fail to see any significant jump in profits.
In most cases, the problem is not about poor strategic decisions or a weak leadership team but the extraneous costs that are left unchecked for a long time. Luckily, operational efficiency best practices can revolutionize your entire business.
In essence, operational efficiency is about maintaining an optimal balance between the revenue generated and invested resources—a concept that’s fundamental to maximizing return on investment. But how do we go from theory to practice?
In this guide, we’ll teach you:
Operational efficiency refers to the assessment of the relationship between an organization’s output (what it produces) and input (what it invests in terms of resources). It reflects the business’s ability to leverage its resources, such as employees, capital, and fixed assets, to derive income.
The universal operating efficiency goal for any business owner is to get more output with less input. The idea is to use a sustainable business model with an optimal output-input balance to boost the company’s bottom line.
Operational efficiency is usually expressed as a ratio called the operational efficiency ratio, calculated using a variety of income and expense components. But from a broader perspective, it’s about process and performance.
Business processes are the building blocks of your operations. Streamlining them is akin to cutting the flab, making your organization lean and agile. Performance, on the other hand, is the mirror that reflects your operational health. By consistently measuring and monitoring performance, you’re not only identifying bottlenecks but also opportunities for improving productivity.
Operational efficiency is not just for businesses producing something—most professional service firms also focus on end-to-end process optimization to maximize customer acquisition and satisfaction, which in turn adds to total revenue. 💸
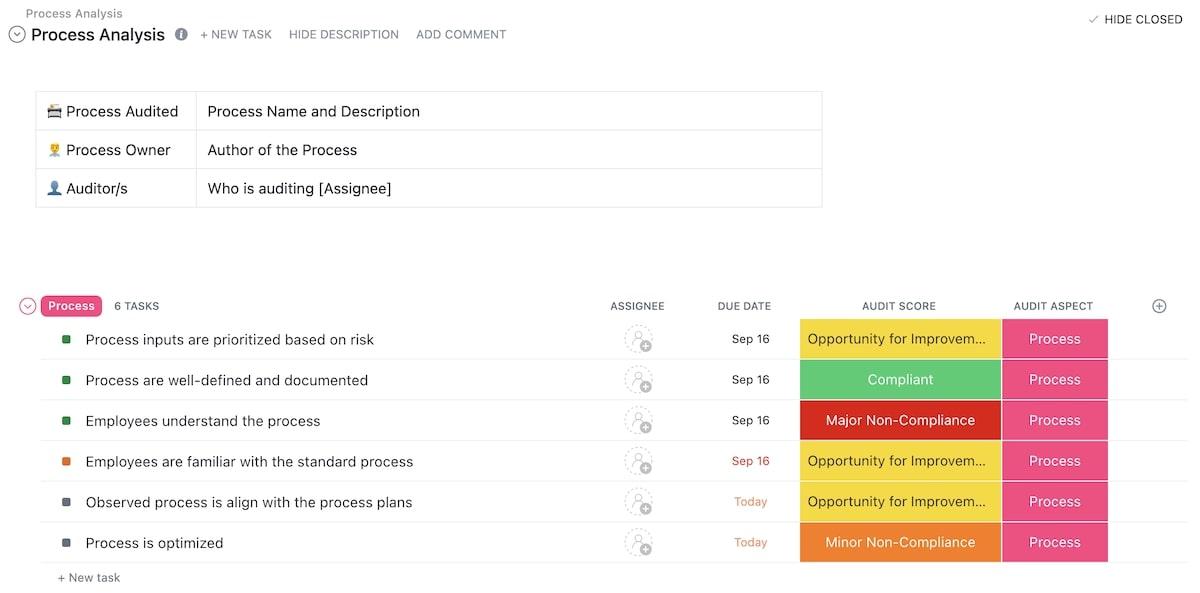
If you’re looking for a quick tool to improve operational efficiency for your team, jump on the ClickUp Process Audit and Improvement Template. Its built-in views help you micro-analyze processes within your whole business and pinpoint opportunities to boost efficiency and cash flow.
There are numerous factors that affect how well your operations run—here are five prominent ones:
This is about getting the most out of your workforce—you have to look at areas like labor productivity, employee training programs, and the integration of technological components (like a process automation tool to reduce administrative duties) to help your team work faster.
Operational efficiency can be closely related to market conditions in certain industries. For example, if the industry standards, demands, or consumer needs change too often, your business operations and processes have to be scaled up or down to remain efficient.
Performance indicators give you an idea of your operational efficiency rate across multiple metrics, such as:
For manufacturing companies, making more of something helps lower the per-item cost of production. So, determining the optimal production scale is a crucial part of efficient operations management.
A positive company culture around innovation and continuous improvement can lead to a more efficient production cycle. Organizations heavy on hierarchy tend to suffer from rigid structures and slow decision-making for process optimization.
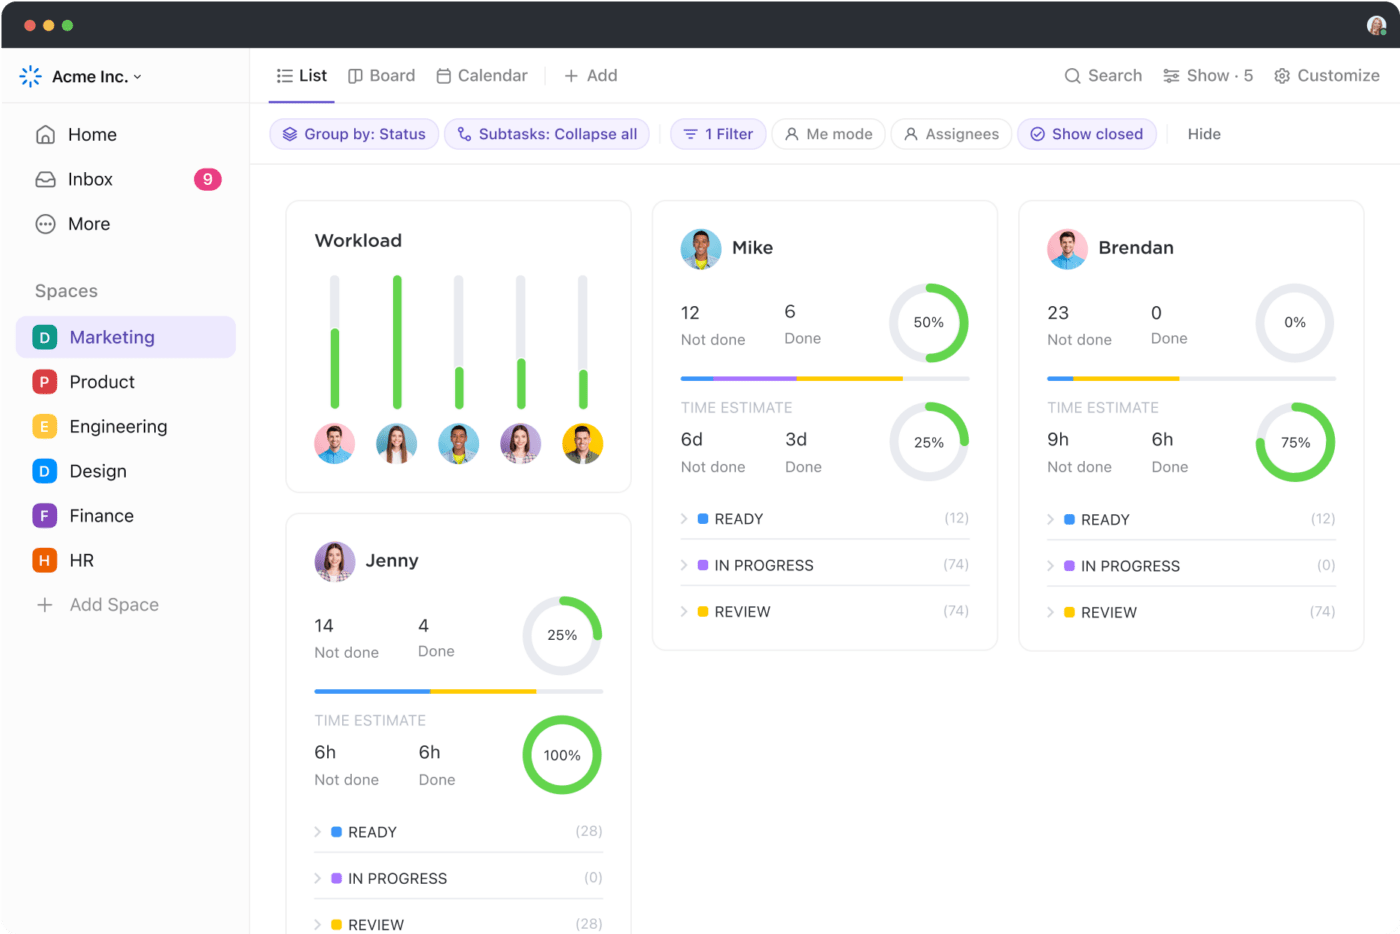
Tip: Want to keep your team agile and efficient at any production scale? Use the Team view in ClickUp to revisit your team’s workloads and future capacities and make quick, data-backed process decisions. 💡
While you’ve grasped the significance of productivity and its role in driving operational efficiency, it’s equally important to understand the distinction between these two concepts to manage your business operations effectively.
These two ideas may seem similar, but they hold unique implications for your operational strategy:
How much to focus on making your operations efficient versus productive depends a lot on the state of your business. For example, if you’re just starting out, you can push your business goals by being more productive—your financial strategy can be getting lots of work done quickly to grow fast within resource constraints.
But if you’re running a stable company that’s been around for a while, you may want to focus on making your operations more efficient to grow your bottom line. 🌱
Given the competitive nature of today’s business environment, achieving greater operational efficiency is no longer an option—it’s a necessity. You need to ensure that each function in your business is performing at its best and not hogging resources without much contribution.
But why should you prioritize operational efficiency? Here are some compelling reasons:
💰 Cost reduction: When you run operations efficiently, you use fewer resources to get the same work done. This saves you money
🔥 Boost in brand image: Operational efficiency brings stability to the workplace and helps build productive and motivated teams, leading to a positive company image. According to a 2024 report from Harvard Business Review, employees are more attracted to companies that offer stability and job security
🥰 Improved customer satisfaction: When you’re efficient, your clients get what they want faster and with fewer mistakes. This also attracts more potential customers for your business
🤼 Competitive advantage: Being efficient can make you better than your competitors. If you can deliver great products or services quickly, you’ll stand out in the market
💸 Enhanced profitability: All of the benefits above help you make more money. By saving on operational costs and getting more done, your business becomes more profitable
As we mentioned earlier, operational efficiency is mathematically expressed as an operational efficiency ratio—it’s a wide-spectrum metric, and accounting teams use a variety of techniques and formulas to calculate it.
In its most basic form, you can calculate your operational efficiency ratio using this formula:
(Operational expenses + Cost of goods sold/COGS*) ÷ Total Revenue or Net sales
This ratio or percentage tells you how much of your income is being used up by operational costs. To assess your position, compare this percentage to industry standards, your past efficiency rate, or any similar benchmark.
*COGS = (Beginning inventory + purchases) – Ending inventory
Let’s say you own a company that manufactures furniture. To measure operational efficiency, you would first gather data on all your operating expenses, including costs for materials, labor, utilities, inventory management, and overhead. Let’s say your total operating expenses and COGS for the month are $50,000.
Next, you would calculate the total revenue generated from selling your furniture products during the same month. Let’s say your total revenue for the month is $100,000.
To measure operational efficiency, you would use the formula above and get:
Operational efficiency ratio = $50,000 ÷ $100,000 ⇒ 0.5
So, your operational efficiency for the month is 0.5 or 50%. This means that for every dollar you earned in revenue, you spent $0.50 on operating expenses. You can then compare this percentage to industry benchmarks or your own targets to assess your business performance.
The goal is to keep this percentage as low as possible. If it’s too high, it might mean you’re spending too much on running the business compared to what you’re earning.
Operations managers use many other KPIs to measure efficiency, such as:
The benefits are manifold—higher production efficiency due to cutting costs, enhanced business performance, and increased operating profit margins. But how exactly can you achieve this balance?
We have the standard steps (in no particular order) to help you out! We will also show you some functionalities within ClickUp, a project and operations management solution that’s designed to keep teams efficient. 💗
Make it a habit to review your operations at regular intervals to spot redundant processes and scope for reducing costs.
To improve a process, start by understanding how it works. Analyze each step using visuals like activity flowcharts or swimlane diagrams to see how your teammates interact with the process. This exercise reveals where the process delays production or hogs unnecessary resources.
You can visualize team workflows on ClickUp Mind Maps. The feature allows you to design a network of interconnected tasks with drag-and-drop moves. Use the network to plan the most efficient operational paths, highlight inefficient areas, and keep track of tasks.

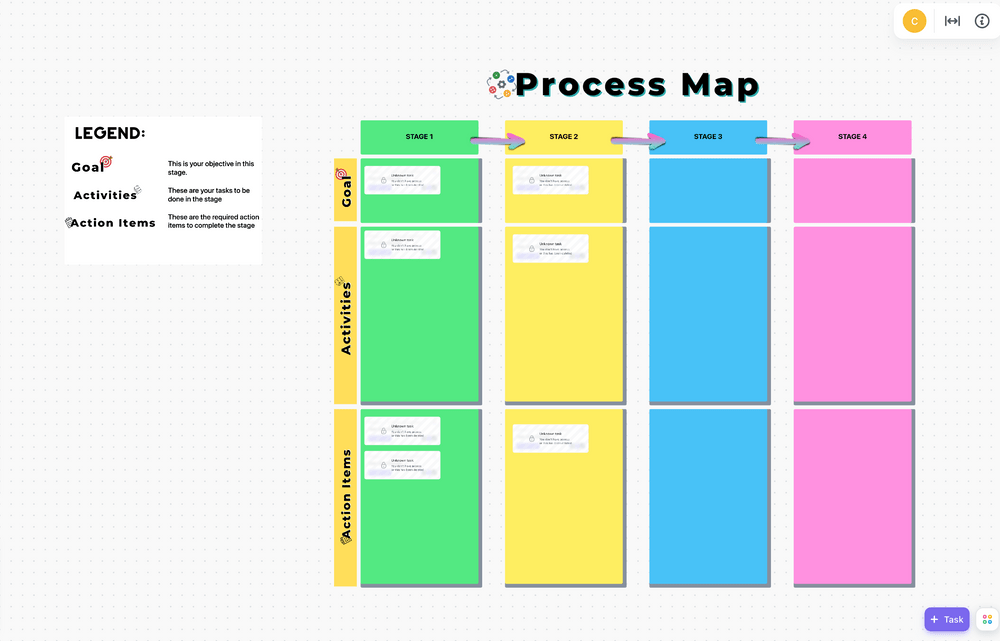
If you don’t want to start from scratch, ClickUp has templates for process mapping and making operational plans. They have pre-designed maps to help you break down your processes into steps and visualize adjustments.
For instance, you can use the ClickUp Process Map Whiteboard Template to outline a process across color-coded stages.
Now that you’ve mapped out your process, it’s time to see what’s working well and what needs improvement. Look closely at the parts where your team is doing a great job, hitting targets, and producing high-quality work. Think about how you can make these good areas even better for maximum efficiency. 💫
On the other hand, find the parts that aren’t working well to find focused solutions. Look out for these common issues:
One reason why operations get messy is because tasks aren’t managed well. When team members aren’t clear on what they’re supposed to do, they might just wing it. This might work okay for a while, but it can lead to problems later on. Some tasks might get forgotten, which could mess up the process, project, or even the entire business. 🫣

To keep your operational workflows efficient, use ClickUp’s task management tools, designed to keep all of your tasks organized in one place. You can easily create new tasks and include Custom Fields for granular details like assignees, due dates, and priority levels.
ClickUp lets you add comments and instructions to each task, ensuring the assignee enjoys smooth execution. You can also set up recurring tasks and see that there are no delays in your production process.
When team collaboration within cross-functional departments isn’t effective, it can slow down your processes and cause problems like misunderstandings, holdups, missed deadlines, and lower-quality work. To improve efficiency, it’s important to encourage clear communication and teamwork. 👫
With ClickUp’s Chat view, you can make separate chat rooms for departmental conversations, ensuring all operations stakeholders are exposed to relevant info. Team members can use it for quick questions, clarifications, and feedback instead of sending emails back and forth.
You can even tag team members to get their attention quickly on roadblocks and keep threads organized. Plus, you can add comments or react with emojis to make collaboration more fun. 🗣️
If your operations team is struggling with planning inter-departmental tasks, ClickUp Whiteboards can help. They allow you and your team to get together from any location and brainstorm ideas, make capacity plans, standardize departmental processes, and discuss potential bottlenecks on a visual canvas. You can even turn ideas into tasks in real time and link them to documents like SOPs for more context.

Scattered documentation is another reason why teams suffer from operational inefficiency. If your workforce spends a chunk of their time asking for information on how to do something or looking for supporting process documents—they’re wasting their skills, and you’re losing money.
That’s why successful managers emphasize using centralized document management software to keep data organized. If you’re using ClickUp, you can create, store, and edit your documents using ClickUp Docs. With features like Tags and Universal Search, your teammates will never waste time looking for work-related information! 🧐

You and your colleagues can also edit documents at the same time, even if you’re not in the same place. You can also connect your Docs to tasks to add more content to the latter.
In Docs, the Collaboration Detection feature lets you see who’s commenting, editing, or even just looking at the same task as you. This prevents redundant work, especially in remote teams.
Do you find your team spending too much time on tasks that are repetitive and don’t add much value? Automating these tasks can be really helpful for your organization. It saves time, keeps your team happier, reduces mistakes, and makes sure your operations stay efficient. ⚙️

With ClickUp Automations, you have over 100 ready-made automations to choose from. These can help you automate tasks like assigning work, sending customer emails, escalating a ticket, setting priorities, leaving comments, and updating statuses.
If you can’t find the right automation, make your own. You get to pick what triggers the automation, what conditions need to be met, and what action it takes. You can also use Integration Automations to connect ClickUp with other apps you use. This minimizes context switching and lets you control your work from one platform—that’s peak efficiency!
Dashboards in ClickUp make it easy to replace those weekly reports cluttering your operations manager’s inbox. With Dashboards, you can create, display, and interact with all your key performance indicators (KPIs) in one place.
And you don’t need any special skills to make them. Just drag and drop to organize your Dashboard cards however you like, so you can track your KPIs in real time. 🙌

Sometimes, just shifting your viewpoint a bit can help you spot problems in your operations. That’s why ClickUp offers over 15 different views to look at your work. They let you see everything from different angles, including both the overall picture and the little details. 👀
ClickUp’s Gantt chart view offers you a vantage point in terms of maintaining operational efficiency. It gives you a visual timeline of your workflow—you can see task dependencies, durations, and deadlines—all in one place. Besides showing you where everything fits, it helps you spot any issues and make schedule adjustments on a single page.

To use this view, just pick Gantt from the view options, give it a name, add tasks with start and end dates, and track progress with milestones and dependencies. You can even export your Gantt chart as a PDF to share it with external stakeholders.
When it comes to creating a Gantt view, you can do it for each of your projects at the Space or Folder level to track multiple projects at once.
Tip: If you want to give yourself a head-start, use the ClickUp Operational Efficiency Template. Monitor and analyze KPIs in real-time, identify bottlenecks, and collaborate with team members to implement targeted improvements and drive success.
Ignoring operational efficiency is like tossing money into a blazing fire. It’s the engine that fuels your business triumphs. With it, you can transform every dollar spent into a valuable asset and every employee into a productivity powerhouse.
Following the steps and strategies we discussed will give you a competitive edge, and you need tools like ClickUp to implement them. Sign up for ClickUp today, and start marching toward your business goals at full steam.💃

Manasi Nair
Max 28min read

Sudarshan Somanathan
Max 26min read
Manasi Nair
Max 24min read

© 2026 ClickUp


