


Still downloading templates?
There’s an easier way. Try a free AI Agent in ClickUp that actually does the work for you—set up in minutes, save hours every week.
Sorry, there were no results found for “”
Sorry, there were no results found for “”
Sorry, there were no results found for “”
We often spend so much time chasing down project details, only to realize we could’ve done better.
Instead of painstakingly reconciling billable hours manually, we could’ve automated it and avoided working over that new efficiency roadmap over the weekend, for example.
If you’re a project manager like me, you can probably share dozens of such instances.
This is why we need a project management dashboard that acts like a digital cockpit, giving us a crystal-clear view of every detail across projects.
In this blog, I’ll share how project management dashboards can transform workflows, from streamlining communication to identifying risks before they torpedo deadlines. I’ll also introduce you to some of my go-to dashboard tools and templates that help me access the data I need to make decisions—right when I need it.
A project management dashboard is a visual tool designed to help teams view project performance in one central location. It presents project-related information through charts and metrics, allowing the audience to quickly grasp the project’s status, progress, and potential risks.
Many successful projects in today’s modern market are often interdependent, meaning that their outcomes and success are closely linked to one another. This interconnection can occur within a single organization, where multiple projects rely on shared resources, deliverables, or timelines. 🌐
Coordinating tasks across various time zones sometimes leads to delays and slow down decision-making processes. These challenges result in misunderstandings, missed deadlines, and reduced productivity.
And with dashboard software like ClickUp, Google Sheets, or Excel, you’ll have a range of visualization options to cater to specific projects!
Here are the benefits of project dashboards to optimize project performance:
As a human first and project manager second, your uniqueness is an asset that can lead to innovative and successful project management. Feel empowered to explore different project management dashboard software to discover what works best for you, your team, and your projects! ⚡️
Perhaps the greatest advantage of project dashboards for me is the real-time visibility into project progress. This allows me to track key metrics, identify bottlenecks, and allocate resources optimally. But there are several more advantages that I’ve come to rely on:
Using a dashboard allows me to ditch the guesswork, boost my team’s efficiency, and ensure my projects consistently hit the bullseye. And that’s golden!
Build a great project management dashboard with me to keep your projects on track and take key decisions quickly.
Here’s a breakdown of the process I follow:
A clear vision of the target audience for your dashboard can help figure out the types of metrics to track.
For example, a project team dashboard focuses on task completion rates, resource allocation, and upcoming deadlines; an operations dashboard tracks operational processes and analyzes the performance of internal activities in the company; and an executive dashboard focuses on key project milestones and how they align with overall organizational goals.
Once I know my audience, I can start identifying specific areas for improvement within my projects. Am I consistently missing deadlines? Is my team struggling with resource constraints? Are project costs exceeding budget?
Once I find answers to these questions, I can choose relevant metrics to track progress.
We’re truly spoilt for choice in terms of dashboard tools. From simple spreadsheets to highly customizable progress charts, there are several options depending on what you need to track. Here’s a breakdown of some popular choices:

Keep the dashboard clean and uncluttered. I avoid cramming too much information onto the dashboard as it will overwhelm viewers and make it difficult for them to find the information they need.
Now that you’ve identified the key metrics, choose a tool to assemble the dashboard. Here are some common elements to incorporate:
The dashboard should be a living document that adapts to projects’ changing needs. I regularly update data and refresh visualizations to ensure they accurately depict current project progress.
How often I update my dashboard depends on the nature of the project and the rate at which data changes. For fast-paced projects with constantly shifting deadlines, as with new kinds of projects you haven’t tackled before, daily updates may become necessary. Weekly or bi-weekly updates may suffice for slower-moving and predictable or repetitive projects.
The key is to establish a regular update schedule and stick to it. This ensures my dashboard remains a reliable source of information for project stakeholders.
Do you feel project management often becomes more complex than it needs to be? I certainly do. Tasks and milestones sprawl across departments, there’s a constant need to monitor on multiple platforms, and juggling multiple strategic initiatives has become the norm.
Thank god for dashboards! Yes, they may be valuable for monitoring single projects, but they are absolutely indispensable for managing a portfolio of interconnected projects.
For me, the most challenging projects are huge, cross-functional projects like product launches. There are so many moving parts, and I’m glad to be using ClickUp to handle them.
Here are some of my favorite examples from ClickUp Dashboards and how my team and I use them. I hope they’ll give you some useful ideas for building your own.
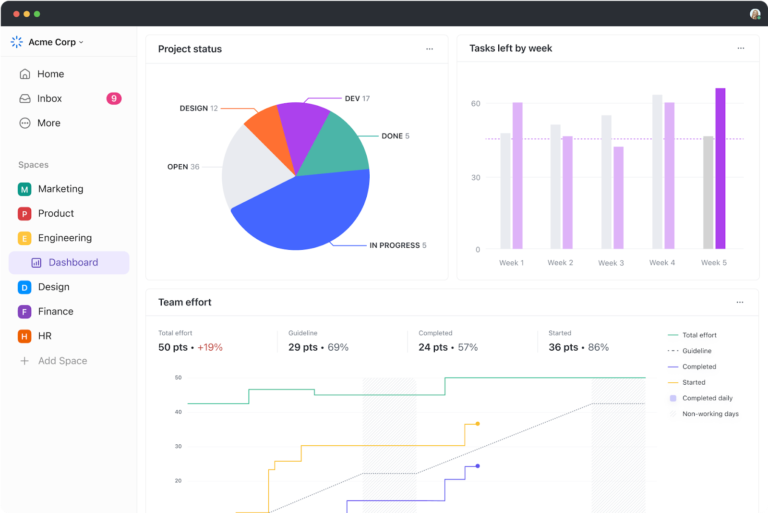
Like most project managers, I like to start my day by checking my project’s progress in the morning! And that was made possible with ClickUp’s Dashboard View.
With a few clicks, I could turn what I was already working on into clear charts and graphs.
To do this for yourself, sign up for ClickUp or log in to your account if you have already used it. Add a new ‘Dashboard view’ and choose a template. The view automatically pulls data from tasks and fields, creating a personalized dashboard visualizing your work.
Adding the Personal Productivity Dashboard as a view allows me to evaluate and optimize my productivity. It helps me prioritize tasks, track progress, and focus on what truly matters.
This is my command center for an efficient and organized workflow.
I use the Team Workload Dashboard in ClickUp to see what my team is working on throughout the week and track their progress for each task assigned.
I can set and track workload capacities for each member of my team. This helps me easily see who is under or over capacity. It’s great for them, too—they can use it to avoid overcommitting and burning out. Similarly, if they’ve extra time, they can take up additional work to meet deadlines faster or help another teammate out.
It helps improve transparency—I can add time estimates and priorities to my team tasks so everyone knows what to work on first. I also use it to determine what work might require additional team resources and easily add assignees.
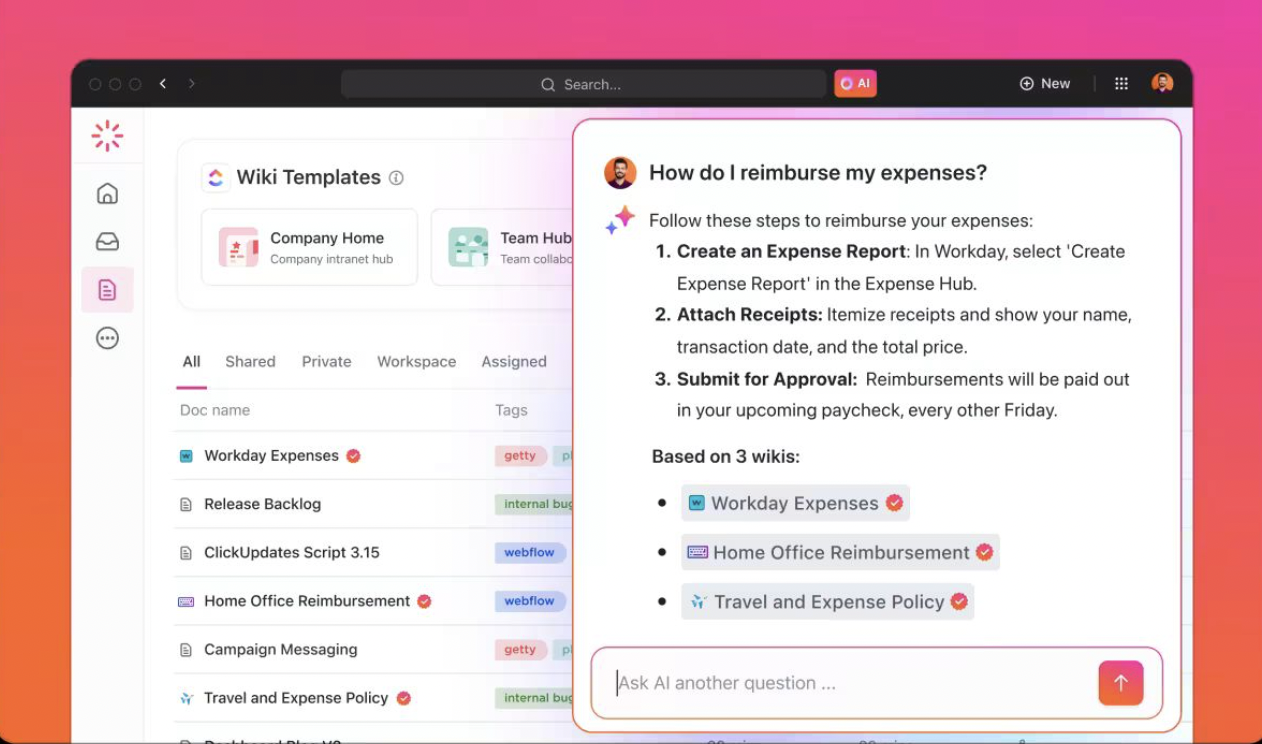
📮ClickUp Insight: 92% of workers use inconsistent methods to track action items, which results in missed decisions and delayed execution.
Whether you’re sending follow-up notes or using spreadsheets, the process is often scattered and inefficient. ClickUp’s Task Management Solution ensures seamless conversion of conversations into tasks—so your team can act fast and stay aligned.
The time-tracking dashboard helps me visualize and analyze the time spent on each of my many projects—for myself and my team. By observing the total time spent on a project, completion percentage, and progress toward milestones, I can monitor overall project health at a glance.
This dashboard has another useful application. It helps me track billable hours for part-time workers or freelancers. I can do so by marking specific time entries as billable and using the consolidated data to generate invoices accurately at the end of the month.
I also use historical time-tracking data to inform my decisions about future project planning, resource allocation, and budgeting.
You can’t manage software development projects without a comprehensive Sprint Dashboard. Trust me, I’ve tried it (and suffered unnecessarily!)
ClickUp lets you manage your team’s workload with a fully customizable point system. Roll up points from subtasks, break them out by assignee, and easily sort them to track your sprints at a glance.
Use the Agile dashboard in ClickUp to set sprint dates, assign points, and mark priorities so everyone knows what to do and when. Automate moving unfinished work into your next sprint and sync your team’s development progress with GitHub, GitLab, or Bitbucket.
This dashboard condenses all numbers that matter—sprint velocity, burn up, burn down, lead time, cycle time, and more—into expressive charts for better decision-making.
I’ve also loved using ClickUp Sprints to plan, track, and optimize our sprints for success, building an agile and results-oriented team in the process.
Marketing campaign dashboards help you track the progress and conversion of priority marketing initiatives in a single view. They allow you to measure the reach and engagement of the content you post online, the number of MQLs (Marketing Qualified Leads) you generate, and how well those convert into sales.
You can easily contextualize tasks connected to your roadmap and go-to-market plans.
If you’re looking for a way to visualize sales by product/service and customer categories, I can’t recommend anything better than the ClickUp Sales Overview Dashboard.
But this isn’t all it lets you track. Break down revenue into gross and net figures to accurately measure profitability and calculate your tax burden. Monitor revenue by period—monthly, quarterly, or annual, to anticipate slumps and peaks and optimize inventory accordingly. Compare targets with actual numbers and devise strategies for improvement.
You can also use the data as a basis for celebration, as we do, and reward high-performing reps across your salesforce.
The best part is you can pair the dashboard with ClickUp Brain’s AI prowess and glean insights to forecast trends and spot potential inhibitors early on.
Dashboards don’t just empower us; they empower our clients too. Invite any client into your ClickUp Workspace as a guest and share the client portal to provide real-time project updates and collaborate with them in one place. Track projects and tasks, see workloads across project teams, and chat with them in real time.
See how invoices are tracked over time, who is closing deals, and assess your team’s overall performance. You can also identify hold-ups with Cumulative Flow, Burnup, Burndown, and Velocity charts.
Want to monitor how well you’re responding to customer incidents and risks? We did.
So, we used the CRM Dashboard in ClickUp. It helped us surface our riskiest customer segments, summarize potential reasons for churn, and forecast revenue across regions and teams.
Consider religiously tracking metrics that indicate customer health and potential churn risk. Examples include customer satisfaction scores, support ticket resolution times, and engagement levels.
Use these dashboard examples from ClickUp to create a custom visualization system for your workflow. You can also take inspiration from the ClickUp team and improve your existing dashboard!
Now, let’s look at some pre-made templates to help set up your dashboard without having to start from scratch.
Dashboard templates are a valuable tool for creating informative and visually appealing dashboards quickly and efficiently. They provide a solid foundation for data analysis, allowing you to focus on the content and extract actionable insights from your data.
Here are some dashboard templates that I’ve tried and tested for you:
Tired of juggling project details?
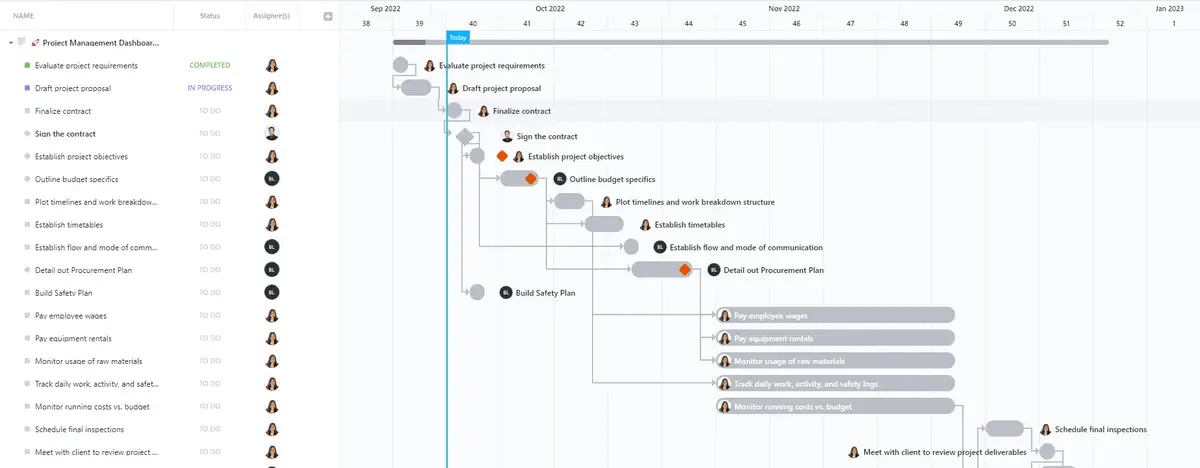
ClickUp’s Project Management Dashboard Template puts everything you need at your fingertips. See it all, instantly!
This pre-built project dashboard template provides a clear, at-a-glance view of your projects, including deadlines, tasks, and real-time progress.
Stay organized, stay efficient. The template offers some powerful features:
Stop micromanaging; start streamlining. This template empowers you to keep your projects on track with effortless organization and crystal-clear insights.
This business dashboard template can track a wide range of metrics depending on your business’s specific goals and departments.
Track and analyze:

This project management dashboard template is a one-stop shop for project tracking and overall project health data analysis.
This template eliminates the need for project managers to dig through scattered data points. It presents essential project information in a visually compelling format, allowing project managers and stakeholders to check project status at a glance.
Some common metrics you can track with this template:
This template allows you to monitor several important metrics, especially for small- and medium-sized businesses that handle multiple projects simultaneously.

This free Excel expense tracker makes managing your money a breeze. No more scrambling for receipts or wondering where your project budgets are being spent. When you need a dedicated tool for managing those small but significant office expenses, this is the template to go after:
Tip: Ready-to-use templates come in handy when you’re scaling your business and don’t have the time to craft individual dashboards. However, you must incorporate relevant data points to track progress and make the best use of dashboards.
Let’s explore some key elements that will elevate your dashboards from simple data dumps to powerful information hubs:
That’s it! You’re all set to create your own dashboard with templates or within a dedicated dashboard software.
For me, the beauty of dashboards lies in their versatility. From tracking sales performance and customer satisfaction in marketing to monitoring project milestones and resource allocation in project management, you can tailor dashboards to meet the specific needs of any team.
As someone who lives in their dashboards, I can vouch for ClickUp’s strengths in doing them right with its expansive library of pre-built and customizable dashboards. Whether you’re a freelancer managing personal tasks or an enterprise project manager overseeing multiple complex projects, ClickUp has a dashboard for every purpose.
Sign up on ClickUp today and make dashboards your ally!

© 2026 ClickUp

There’s an easier way. Try a free AI Agent in ClickUp that actually does the work for you—set up in minutes, save hours every week.