Project management tips & trends, delivered.
Join productivity hackers from around the world that receive WriteClick—the ClickUp Blog Newsletter.
Follow us on:
Announcements
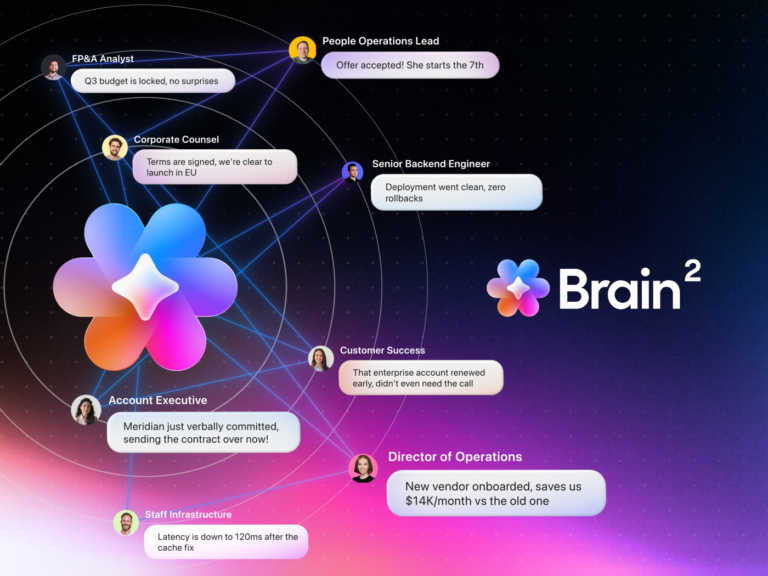
Brain²: The Coming Wave

Articles
Recent Posts
Using ClickUp
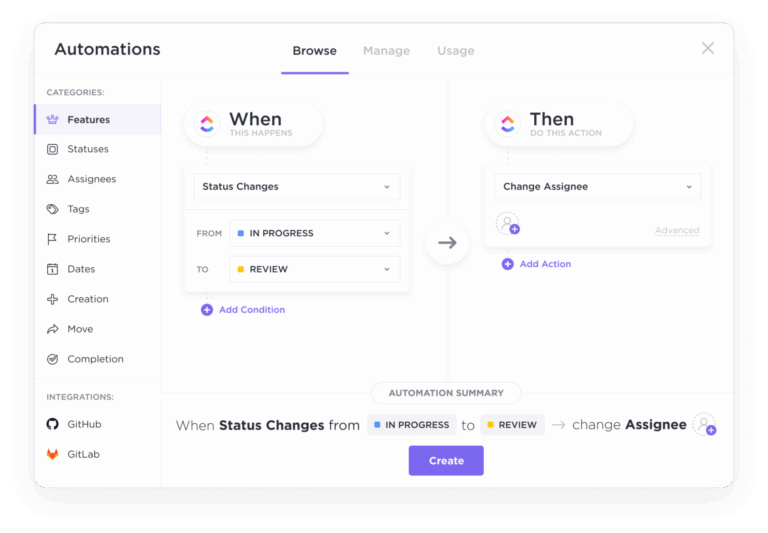
20 Automation Examples in ClickUp Worth Stealing

Using ClickUp
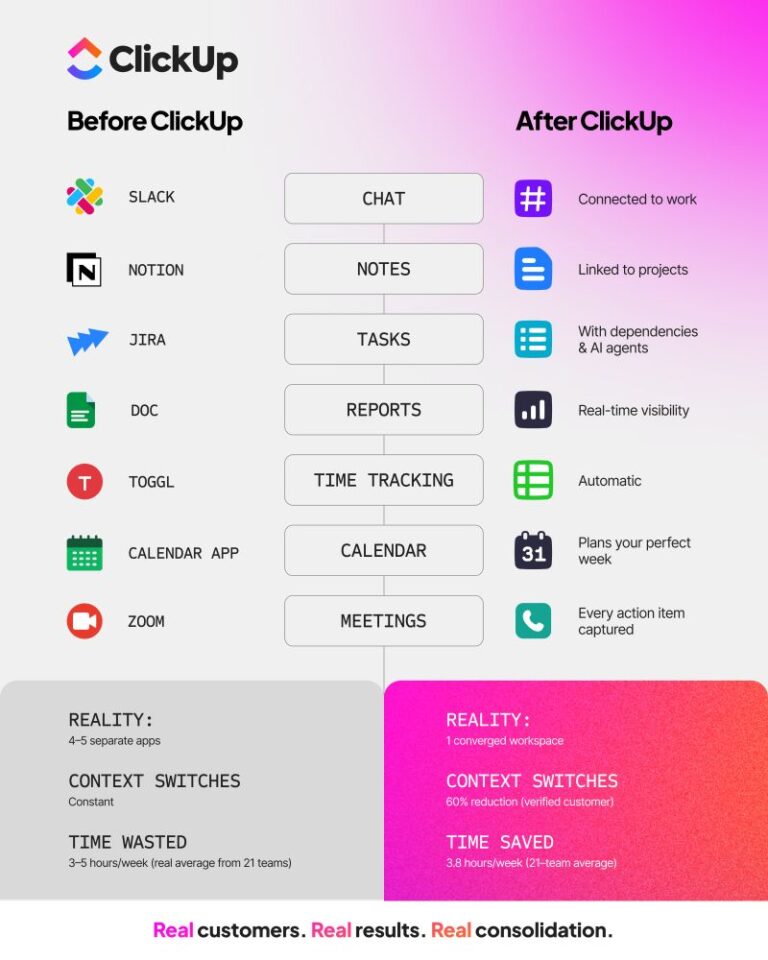
The ROI of Consolidating 20+ Apps into One Platform

People Management
AI Team Morale Monitoring: A Guide for Leaders

Using ClickUp
How ClickUp’s Marketing Team Uses ClickUp
AI & Automation
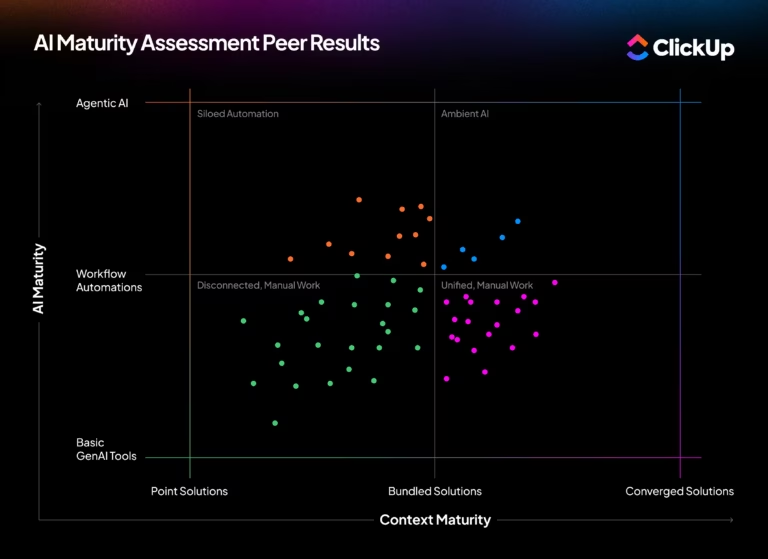
Why Most Companies Get AI Maturity Wrong

AI & Automation
Why Smart Teams Make Worse decisions As They Scale

News
ClickUp’s G2 Winter 2026 Performance Signals The Rise of a Converged, AI-Native System of Work

Project Management
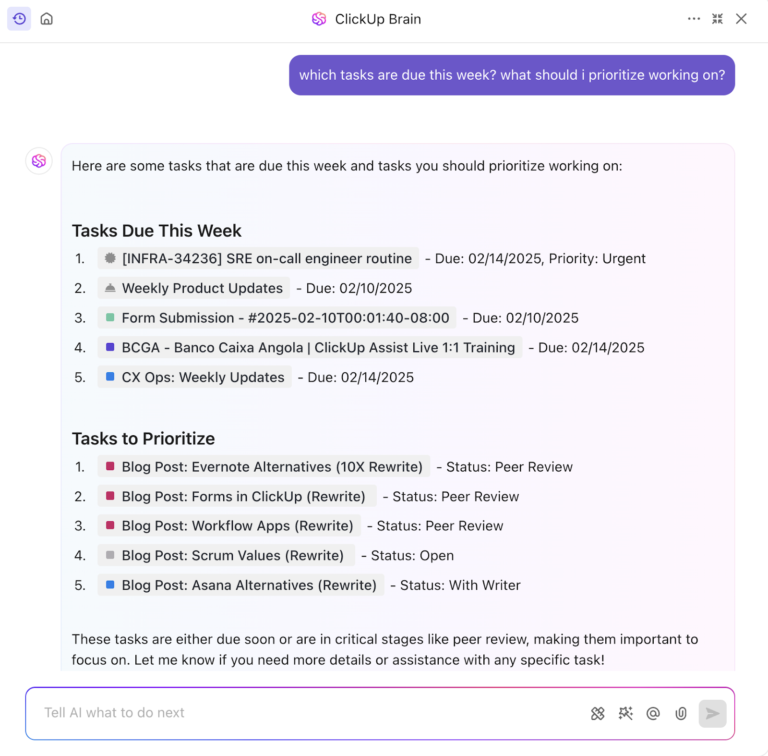
From Chaos to Clarity: A Project Manager’s Guide to AI-Powered Execution

Marketing
Claude Code for Marketers: A No-Code Guide to Building Your Own Marketing Tools

Planning
Agency Capacity Planning: How to Find the Hours You Already Pay For
Agencies
Marketing Agency Leadership in 2026: The New Operating Model for Profit
Popular Posts
Marketing
The Art of High-Velocity Campaign Execution: Orchestrating GTM Success
AI & Automation
Agentic Reasoning: Role in Decision-Making and Problem-Solving


Productivity
How Context Switching Kills Productivity
Project Management
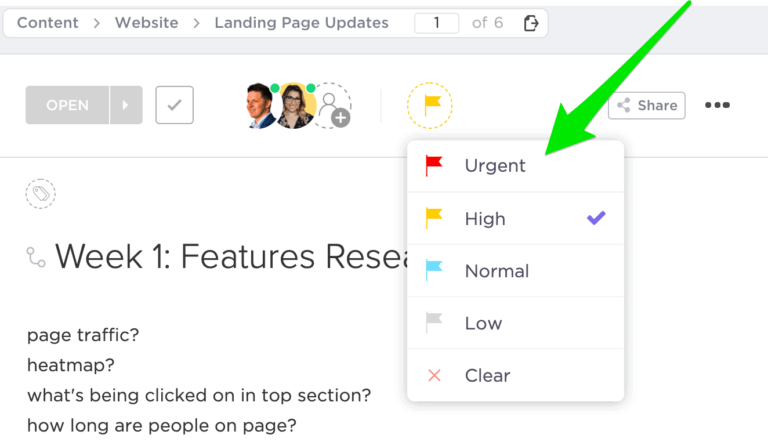
How to Set Priority Levels for Tasks
ClickUp Insights
Manic Mondays: Why the First Day of the Workweek Takes the Heaviest Toll
AI & Automation
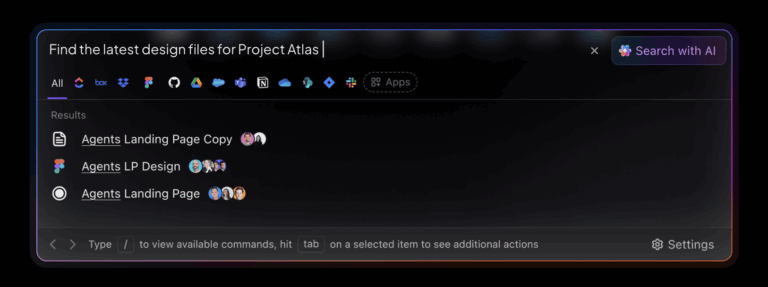
10 AI Enterprise Search Use Cases
![20+ Best Task Management Software for 2026 [Ranked & Reviewed]](https://clickup.com/blog/wp-content/uploads/2026/04/my-tasks-clickup-4.0-768x485.png)
Software
20+ Best Task Management Software for 2026 [Ranked & Reviewed]
Project Management
How to Prioritize Tasks at Work
Top Videos


Other Videos
