


Still downloading templates?
There’s an easier way. Try a free AI Agent in ClickUp that actually does the work for you—set up in minutes, save hours every week.
Sorry, there were no results found for “”
Sorry, there were no results found for “”
Sorry, there were no results found for “”
Product management today is not just about launching and updating products. A product manager must ensure their product remains focused on user needs, and is differentiated from others in the same space. This requires a lot of data and insights; while there is no shortfall of data for a PM today, the challenge is in sifting through multiple data points to pull the most relevant insights to improve the product or service.
A product management dashboard is a vital tool that fuels business continuity and product effectiveness with data-driven business intelligence. An effective dashboard transforms complex data sets into usable insights, facilitating customer-centric product development and experience.
To maximize your ability for effective decision-making and improve your performance metrics, this article explains all you need to know about product management dashboards and how to use them.
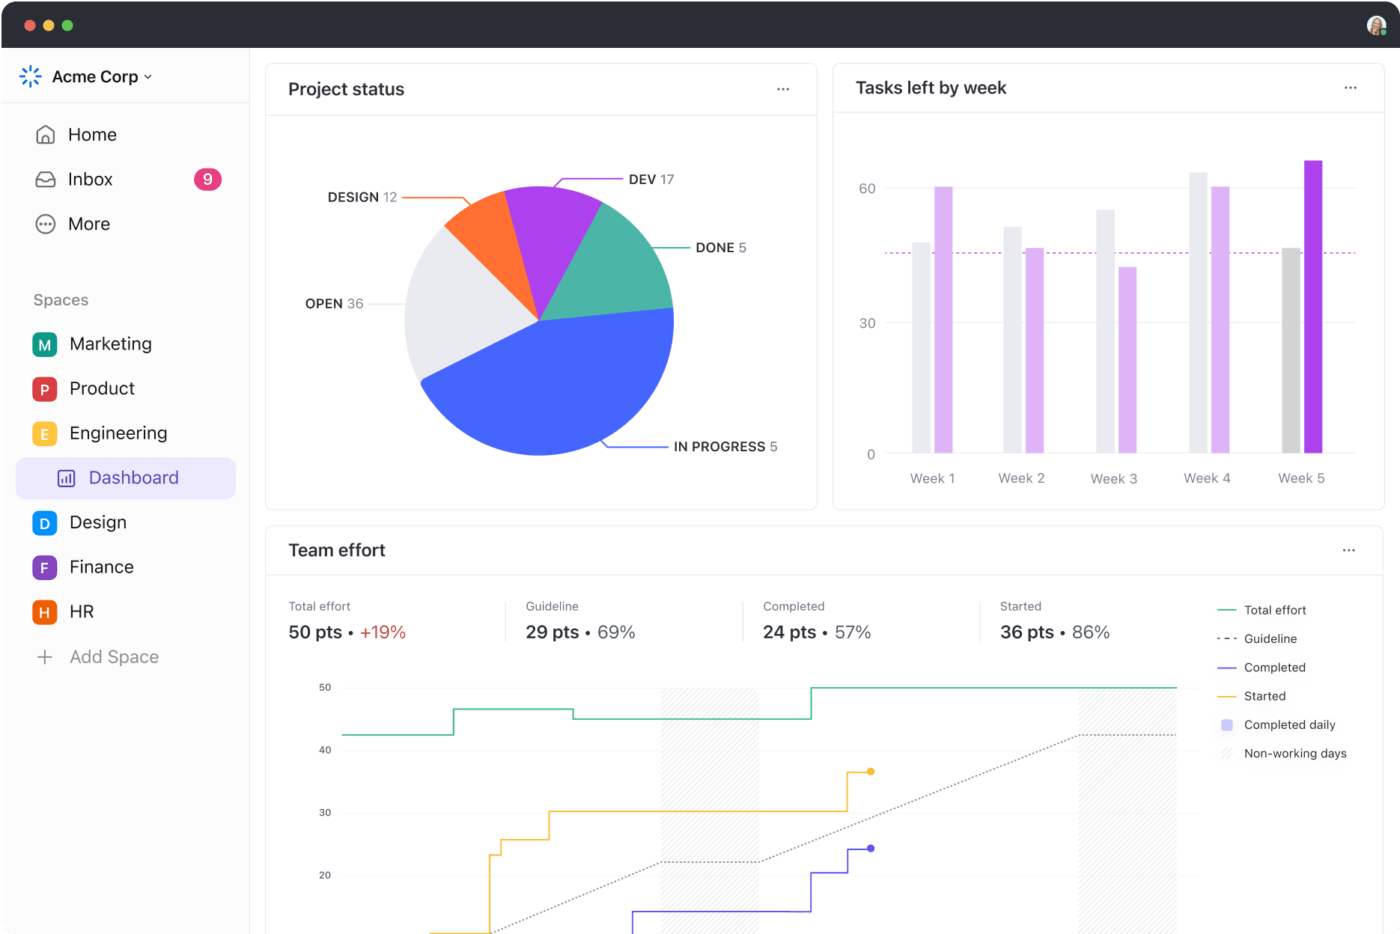
Product management dashboards are visual tools used to track the performance of product metrics like user engagement and acquisition, retention, etc. Their insights are powered through a constant inflow of real-time data sets, processed by several machine-learning algorithms, and delivered to product managers and business analysts through visual dashboards for easy comprehension.
To create and use this tool effectively, we must understand its role in business intelligence and customer satisfaction.
Product dashboards help generate business intelligence faster. By revealing trends in key metrics, business analysts can draw quick, data-driven strategic insights.
Product management depends on visualizing growth and activity. Metrics like conversion rate, user engagement rate, customer acquisition cost (CAC), monthly recurring revenue (MRR), and daily/monthly active users (DAU/MAU) play a vital role in more sophisticated strategies and accurate predictions.
Dashboards that track these elements help product managers have a deeper understanding of what drives adoption and how to create a sticky product that resonates well with the audience.
Product dashboards facilitate satisfaction by providing insight into customer behavior. As these tools reveal usage patterns and pain points, product teams are able to address customer needs better and iterate on solutions that customers want and expect.
An effective product management dashboard also visualizes metrics like Net Promoter Score (NPS) and customer support performance. When integrated into internal data management systems, such as CRMs, the dashboard helps companies adapt their customer satisfaction strategies in real time.
With the help of product management dashboards, product managers take proactive measures to address frustrations and cultivate long-term customer loyalty.
Dashboards transform overall efficiency and productivity, regardless of the nature of the business or product. Their insights can help improve brand and product strategy, provided you understand when to put the dashboard into action. Here are four situations in which a product management dashboard is helpful and an indicator of when to use it:
If a business has access to an enormous amount of product data and often struggles to sift through it, you may be losing out on some key insights every day. A product analytics dashboard is the ideal one-page visual insight tool for these situations.
For instance, for an e-commerce store, a product analytics dashboard will reveal the top sellers, user trends, sales volume, and areas for improvement—all at a glance.
In an environment lacking in data, every decision often takes longer. This is often because the risk of making the wrong decision is higher when there is no insight or clear understanding. A product management dashboard is vital if your business seeks to reduce time spent on decision-making and increase accuracy.
Say you’re launching a new marketing campaign without data on past performance. In such a case, you will be working with many assumptions and untested hypotheses. A product management dashboard can guide you in such cases, giving you clear insights about performance so you can make quick and confident decisions. This also eliminates any guesswork, increasing the chances of success.
Many businesses have multiple offices and teams spread out across various locations, creating silos of communication. While cloud-shared files may be one way to keep everyone updated, it does not guarantee that each team’s goals are aligned. Such teams desperately need a product management dashboard as a central hub of shared information. It helps foster collaboration, keep the team aligned, and mitigate clashes in decisions.
If you are in a business where the industry is evolving rapidly (today, this is the case with many industries), you can expect a high degree of flux in market trends and preferences.
This is also often an environment where trends and innovations are driven by and drive customer behavior. A product management dashboard is instrumental in keeping a finger on the market pulse and even forecasting changes to allow you to adapt and even set a trend of your own.
While investing in a product management dashboard, the primary business expectations are to build total revenue, track and improve relevant metrics, and elevate customer satisfaction.
With that in mind, an effective product management dashboard must have these four key features to facilitate these goals:
Active user data counts the number of unique users that interact with your product and is one of the most powerful metrics to study growth and product stickiness. It helps identify core user behavior and prioritize features in real time. Insights from such data points influence strategy and key decisions on both operational and executive levels.
This data, in the form of Daily Active Users (DAU), Weekly Active Users (WAU), and Monthly Active Users (MAU), showcases growth trends influencing decisions like market expansion or new product launches.
It can also help your customer success team predict churn.
Active user data is usually depicted in the dashboard as simple number charts or line charts, or as a share of total users.
Comprehending customer revenue is essential for almost every business function. Going beyond revenue per user is the Customer Lifetime Value or CLTV, which indicates the revenue customers generate over their entire relationship with your product.
A product management dashboard must be able to represent an accurate depiction of CLTV. Effective forms of representation on a dashboard are:
This revenue aspect often links to customer retention and is a monetary reflection of how engaging your products are and how market dynamics affect them. This feature allows product managers and business intelligence professionals to review and adapt strategies for better targeting and impact.
While acquiring new customers is an inherent part of business continuity, businesses must be conscious of their Customer Acquisition Cost (CAC). The cost of acquiring new customers reflects the sustainability of your current marketing strategies and onboarding processes.
Visualising CAC is a must for every dashboard as it is a key metric that offers exponential insights when blended in with other visualizations like CLTV and subscription rates.
The current rise in subscription-based products and businesses has led to an increased focus on metrics unique to the business model. This has undoubtedly transformed how a product management dashboard is designed. The ideal product management dashboard should be customizable so that it can be adapted to any kind of business model.
Some metrics for subscription business include monthly recurring revenue, churn rate, subscriber growth, and retention rate, all of which portray the business’s health. An effective dashboard integrates subscription-based features to allow the product manager to expand the focus and even target audience.
Another must-have feature for your dashboard is data integration. Dashboards that are compatible with multiple sources, both internal and verified external ones, are vital for incorporating live primary and raw data.
Cross-functional systems, such as customer relationship management, internal marketing software, and financial records, deliver more authentic product performance visualizations.
A centralized dashboard fosters stakeholder alignment on strategic objectives and expands the scope of business intelligence algorithms, resulting in better insights.
Effective dashboards also must incorporate data visualization metrics, predictive analytics, and forecasting methods to extend their horizon.
With the key features in place, let’s dive a little deeper into how to benchmark your product management metrics, what KPIs must be kept in mind, and what sources impact the KPI selection process,
Your benchmark is your product performance against industry standards or competitors. For a product management dashboard to deliver the most value, the benchmarks must go deeper than industry averages. Here are three practices for more nuanced and relevant benchmarks for your KPIs.
By incorporating these key practices, you gain perspective on the right strategies for competitive positioning and areas for improvement.
The specific KPIs and metrics you choose for your product management dashboard depend on your product, business model, and overall goals. Based on this, here are the main categories of KPIs to streamline the selection process.
While business goals drive all KPIs, the ARPU, or Average Revenue Per User, is a vital constant for every business and must be interpreted correctly. ARPU is an indication of the average revenue every user brings in. The impact of this KPI is that it is a direct indicator of your business’ marketing ROI.
Product dashboards that effectively visualize ARPU give you insights on re-strategising current marketing channels. Strategic decisions based on ARPU also extend to your current pricing plans.
Thoroughly vet that your choice of product management metrics and KPIs are agile and relevant for your product dashboard to deliver impact without clutter. Let’s understand a bit about a crucial data source that facilitates and streamlines the KPI selection process.

Customer Relationship Management (CRM) is crucial in shaping KPIs for your product dashboard. Here are some ways CRM data influence KPI selection:
Effective customer management systems, like ClickUp CRM, house invaluable customer data, including support tickets, purchase history, and customer interactions. This data allows you to identify areas where KPIs are most impactful.
ClickUp’s CRM platform strengthens your hold over live data and selecting relevant product KPIs.
The dashboard for your business must be customized to fit your demographic and the nature of your product. The design of a product management dashboard usually evolves according to your business goals. Here’s how to create your product management dashboard in six simple steps:
The first step to creating a product management dashboard is to list your goals and stakeholders. ClickUp Goals allows you to easily track and define what you wish to derive from the visualizations, and ClickUp Whiteboards give you a visual forum to take stakeholder opinions on their expectations.
Here are some questions to review while arriving at your goals:

Alongside dashboard goals, here are questions that will assist target audience identification:

Once you have a good understanding of your target audience and dashboard goals, visually connect them on the ClickUp Whiteboards. This helps ensure your goals directly address the needs and interests of your target market.
Ideating with your team and with all concerned stakeholders will help you arrive at the most relevant goals to be tracked, and also ensure team alignment on the same.

Data sources are vital integrations for your product management dashboard, conveying relevant data into your dashboard visualizations. The second step in creating an effective dashboard is to select the right sources. ClickUp is compatible with numerous reliable data sources to streamline this. Here are a few to select from:
Internal data sources are preferred because they are much easier to integrate and have guaranteed authenticity. Here are some internal sources and tools:
Apart from internal sources, you should also add data from external data sources, especially for products that are constantly influenced by market analytics. ClickUp’s product dashboards come ready to integrate with over 1000+ external data sources. A few examples of effective data sources you should use are:
Once you’ve selected your data sources, list a core set of product management metrics that are most important for measuring the current goals and target audience you created.
Your dashboard software should be able to offer a structured presentation of your goals. With ClickUp Views, you get over 15 ways to visualize your work, including Lists, Workload, and more.

Another great way to spot the most suitable metrics is to map your goals and ideas in a diagram for a bird’s-eye view. ClickUp Mind Map is an excellent tool for this, as it allows you to visualize projects, ideas, or existing tasks. The feature also enables you to create connections between them.
Above all, during KPI selection, ensure that you focus on what’s essential to avoid cluttering your dashboard. ClickUp features the Project Management Office KPI Tracking Template to help you assimilate your essential KPIs.
It is ideal for setting and tracking KPIs that help you measure the progress of your product development and project management initiatives. The dashboard also makes identifying areas for improvement effortless and helps you generate insightful reports
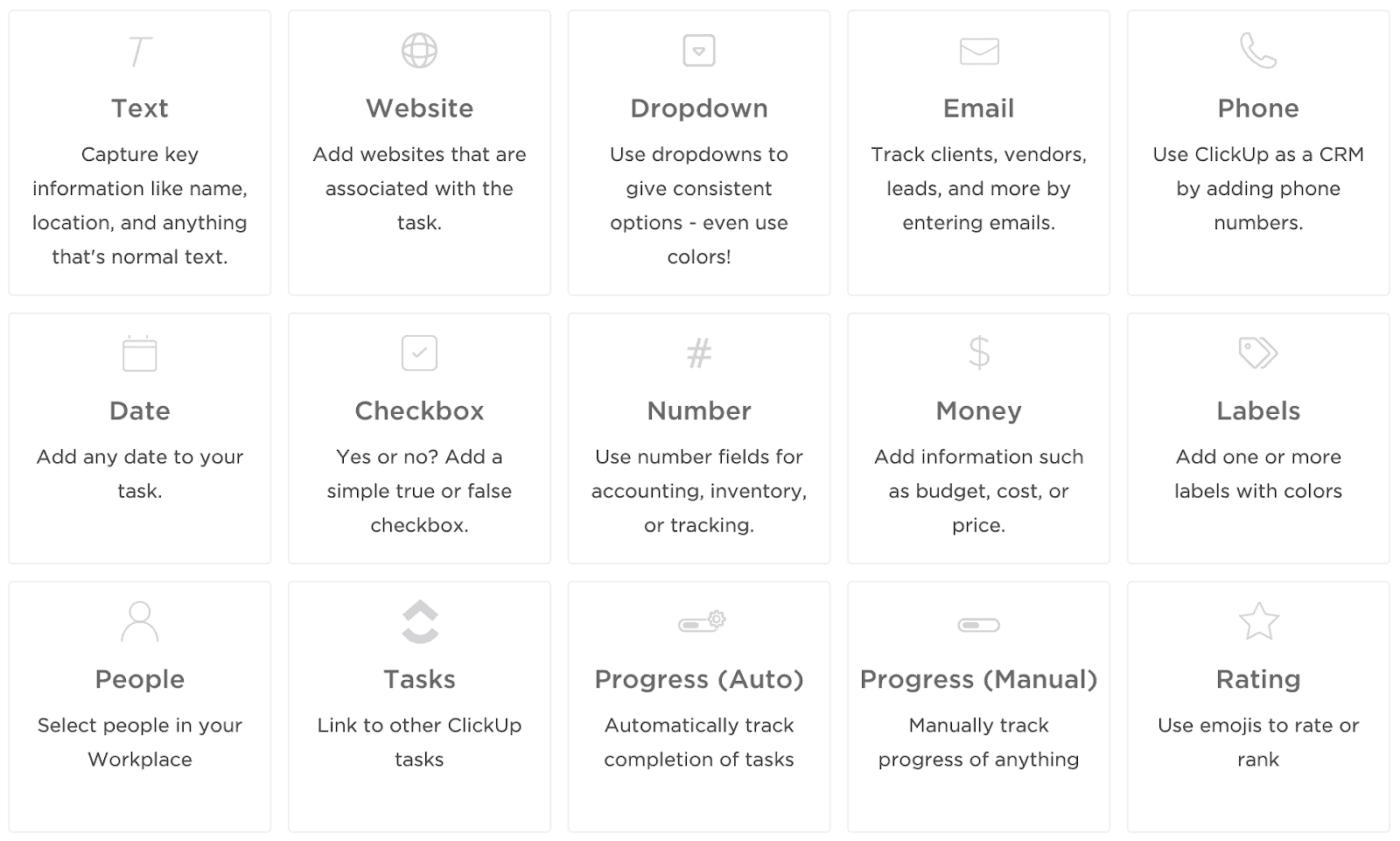
You can customize the template according to your processes, add Custom Statuses such as ‘Completed,’ ‘At Risk,’ etc., for each KPI, and include Custom Fields such as ‘Department,’ ‘Variance,’ etc. It offers a large variety of views, such as a Summary View for an overview of KPI status, a Timeline View to visualize timelines and deadlines, and so on.
Select the right tools for your dashboard for the perfect visualizations and data distribution. Tools that ClickUp offers in every product management dashboard facilitate faster insights and better team coordination. A key advantage to the platform’s tools is that, when customized with the appropriate integrations, it seamlessly relays live data directly from your vast and evolving databases.
ClickUp has powerful features like ClickUp Whiteboards for brainstorming ideas and turning them into coordinated actions, ClickUp Chat View for quick and constant communication among teammates, and the ClickUp API that allows you to customize and create your own widgets and apps to integrate into your dashboard.
We’ve already mentioned the various external solutions that can integrate with ClickUp to help create a robust data source for your dashboard.

Once your data sources are selected, it’s time to design your dashboard layout. Designing a product management dashboard from scratch is a project that requires focus. With ClickUp’s product management software, designing your layout is simplified to easy drag-and-drop features and quick alignments on the layout dialog box itself. To smoothen the process further, product management templates provide you with ready-to-use dashboards that are effortless to design at significantly less cost. Here are some of the most appealing templates:
ClickUp Product Strategy Template is ideal for developing and implementing a product plan and marketing strategy among numerous stakeholders. This dashboard focuses on establishing clear objectives and organizing all product data into a single space to deliver quicker insights and actions. This template also ensures easy customizations with custom fields and KPIs. Product managers can use this to quickly start developing product strategy.
ClickUp Product Requirements Template is perfect for outlining the who, what, why, when, and how of developing product and feature-specific metrics. This template is crafted to support long-term collaboration and communicate priorities to individuals completing the work. These features help keep your product, design, and engineering teams in sync.
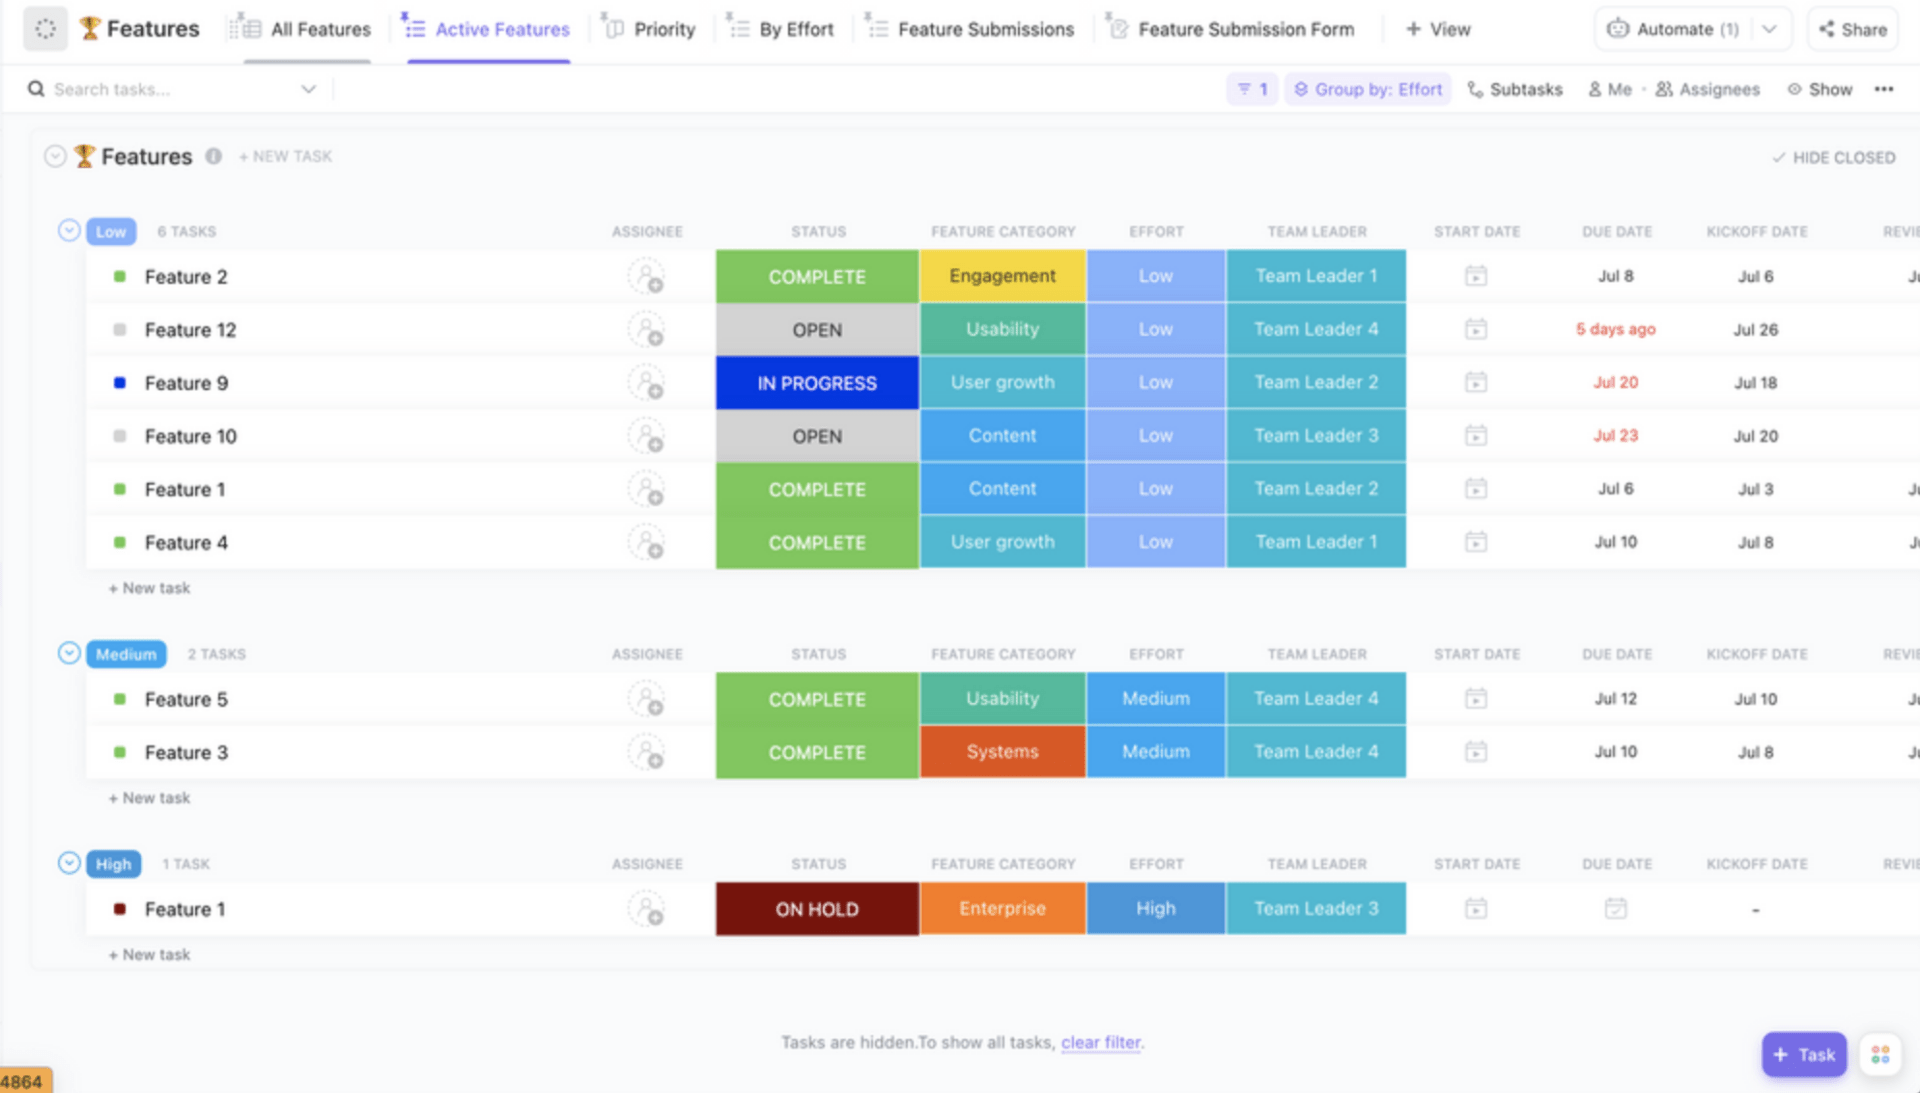
ClickUp Product Features Matrix Template is great for product comparisons. It allows tracking important data points such as feature type, customer, value, impact, and more. The dashboard helps to identify features that provide the most value and align them amongst the team quickly and impactfully. The tool enables product managers to prioritize resources and budget for higher-impact projects.
ClickUp offers numerous product management dashboard examples. The ClickUp Product Management Software is also perfect for customizing your unique needs as it integrates all of ClickUp’s built-in features and views into delivering coordinated and efficient projects. Remember to start off simple and uncluttered, and focus on using visuals that are easy to understand.
Ensure that you share your dashboard with all relevant stakeholders. Allow them to review and add inputs that may have been missed in previous discussions.
Along with these key steps, here are a few tips to help breathe life into your dashboards,

The best product management software streamlines the entire product lifecycle, ensuring efficiency and collaboration. Here are the most effective ways to use it,
Product management software, integrated with the right platforms, should let you brainstorm and gather suggestions from your product team. Many product management tools let you vote on ideas and prioritize tasks. ClickUp’s Notepad is perfect to quickly jot down notes and transform your entries into trackable tasks. It updates in real time and is easily shared with your teammates, making it ideal for brainstorming sessions on the go.
The ClickUp Brainstorming Template is perfect for gathering your team and stakeholders to spur new ideas. The dashboard visualizes these ideas and helps reveal patterns easily. Decision-making becomes much smoother through an organized approach and logical insights.
One key function of product management software is planning your product roadmap. The tool allows you to input key features, timelines, and dependencies clearly outlined. ClickUp simplifies this with roadmap-specific templates. Two effective ClickUp templates are the Product Roadmap and Action Plan Template.
ClickUp’s Action Plan Template drives management through goal prioritization. The dashboard eases the progress monitoring and insights through its built-in analytics and visualizations. This template also helps you assign tasks easily and facilitates project planning and execution with its customizable yet clear structure.
The ClickUp Product Roadmap Template focuses on visualizing the product development lifecycle by breaking down tasks and assigning resources to each stage. This customizable template is ideal for capturing a clear picture of the product’s development timeline and identifying potential risks and opportunities. Its collaborative design also ensures all your team members are on the same page with respect to the project’s progress.
Product management software centralizes user feedback from surveys, interviews, and support tickets. ClickUp offers easy-to-integrate CRM software and several effective designs like the ClickUp Product Feedback Survey Template. This response-centric template has a user-friendly design that allows you to collect meaningful data accurately and deepens the understanding of customer needs and areas of improvement.
Our feedback dashboard integrates data seamlessly with feedback tools. Additionally, ClickUp’s platform features an AI assistant called ClickUp Brain.
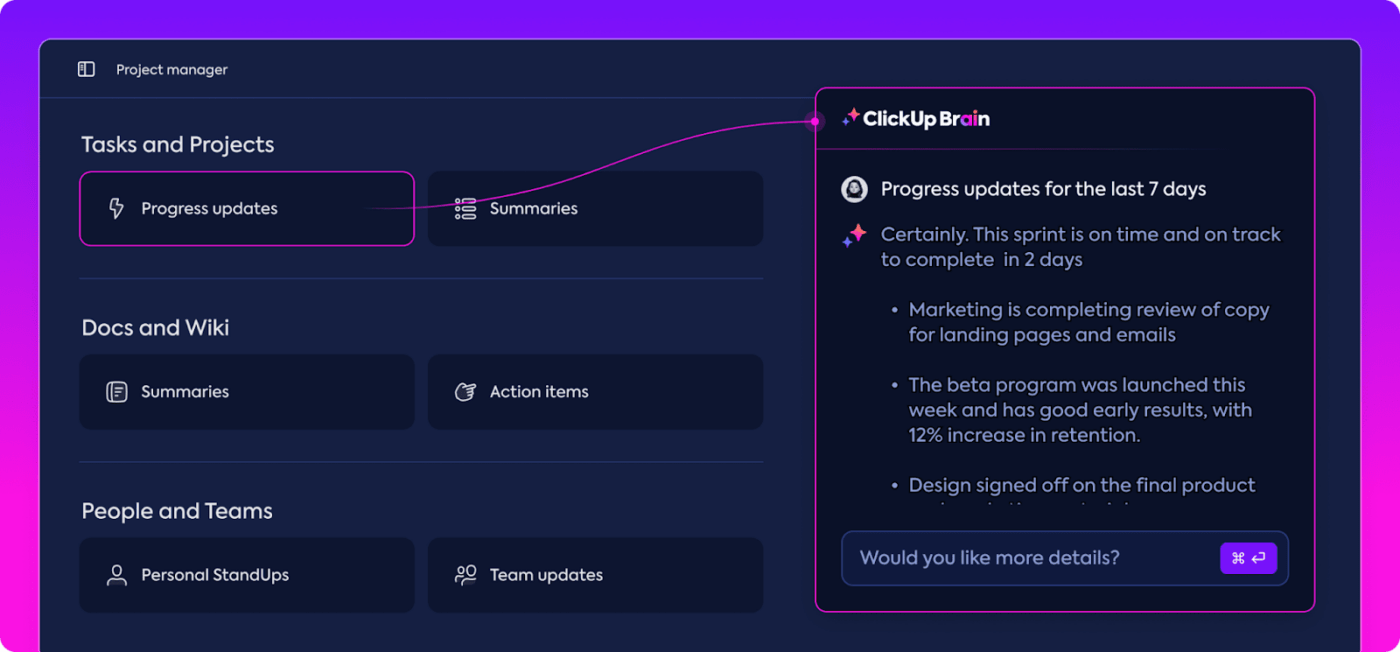
ClickUp Brain’s AI Project Manager can automate data analysis and even share project summaries and updates. One of its most prominent advantages is that it can be integrated into every document and task on ClickUp, making conception, ideation, and execution seamless.

Product management software also includes a shareability feature. This facilitates communication by creating shared documents, wikis, and sprint reports. In-built collaboration tools like ClickUp Docs provide real-time collaboration features—write and edit with your team and be on the same page.
Teams make use of features like comments, mentions, and collaborative editing to plan and manage projects with clarity. In addition to these features, Docs also comes with a built-in AI Writer for Work by ClickUp Brain. This helps you generate responses with a writing assistant, perform spellchecks, create tables, and generate summaries for your project document.
Also read: The best dashboard software you can use today
A product management dashboard is a crucial tool that empowers you with critical business insights. It has the potential to forecast trends, assess product health, and provide market insights about your product, so you must take advantage of it. ClickUp’s numerous templates let you create powerful product dashboards and striking visualizations with customized product management metrics.
Use ClickUp to enhance your market strategies, develop product roadmaps, and even collaborate on improving product performance. Plus, with the right integration of relevant data sources, you will have a centralized space for your stakeholders to get real-time updates and execute aligned strategic decisions.
Customized product management software from ClickUp is all you need to get ahead of the competition with the power of data! Sign up to give it a try!

© 2026 ClickUp

There’s an easier way. Try a free AI Agent in ClickUp that actually does the work for you—set up in minutes, save hours every week.