


Still downloading templates?
There’s an easier way. Try a free AI Agent in ClickUp that actually does the work for you—set up in minutes, save hours every week.
Sorry, there were no results found for “”
Sorry, there were no results found for “”
Sorry, there were no results found for “”
Ever feel like your project management responsibilities are getting a little out of hand?
Juggling deadlines, tracking progress, and keeping everything (and everyone) aligned make managing projects a tricky balancing act.
Gantt chart templates in Google Sheets might be just what you need to bring some order to the chaos—without the complexity of expensive software.
These templates go beyond basic timelines. In addition to helping you create Gantt charts, they allow you to customize your project planning. With some effort, you can adjust task dependencies, track milestones, and integrate real-time updates—all within a tool you already use.
Curious to see how these templates can simplify your planning process?
Let’s explore the top Gantt chart template Google Sheets offers for project and task planning.
A Google Sheets Gantt Chart Template is a pre-made spreadsheet for planning and tracking project timelines.
It’s ideal for project managers who need a straightforward way to streamline complex projects, keep the team synchronized, and ensure on-time completion.
Here’s what distinguishes the best templates:
Here are the top six Google Sheets Gantt chart templates for efficient project tracking and deadline management.
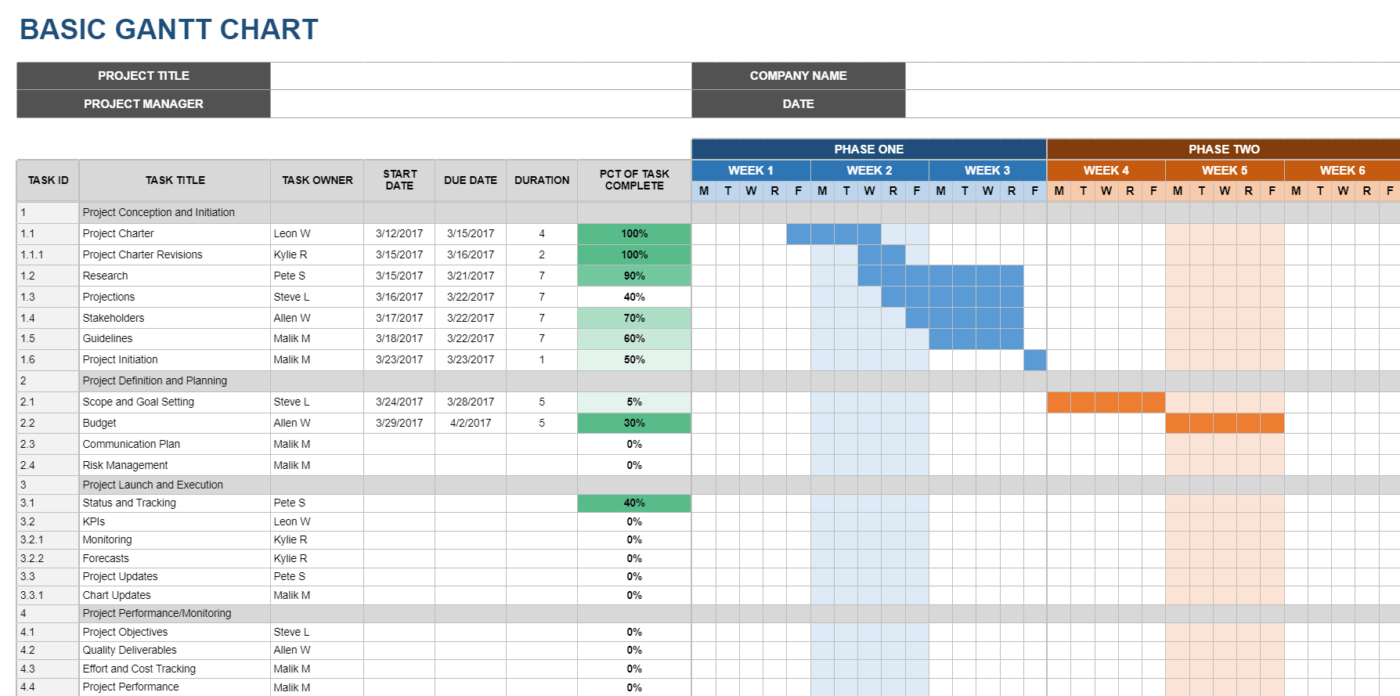
The Google Sheets Basic Gantt Chart Template is a straightforward project management tool in a simple spreadsheet.
This simple Gantt chart template has everything you need: Task ID, Title, Owner, Start Date, Due Date, and Task Duration. It also displays the percentage completion of each project’s task and segments the timelines into weeks, giving a clear overview of project progress.
You can also:
This free template is perfect for small to medium projects that require straightforward tracking without added complexity.
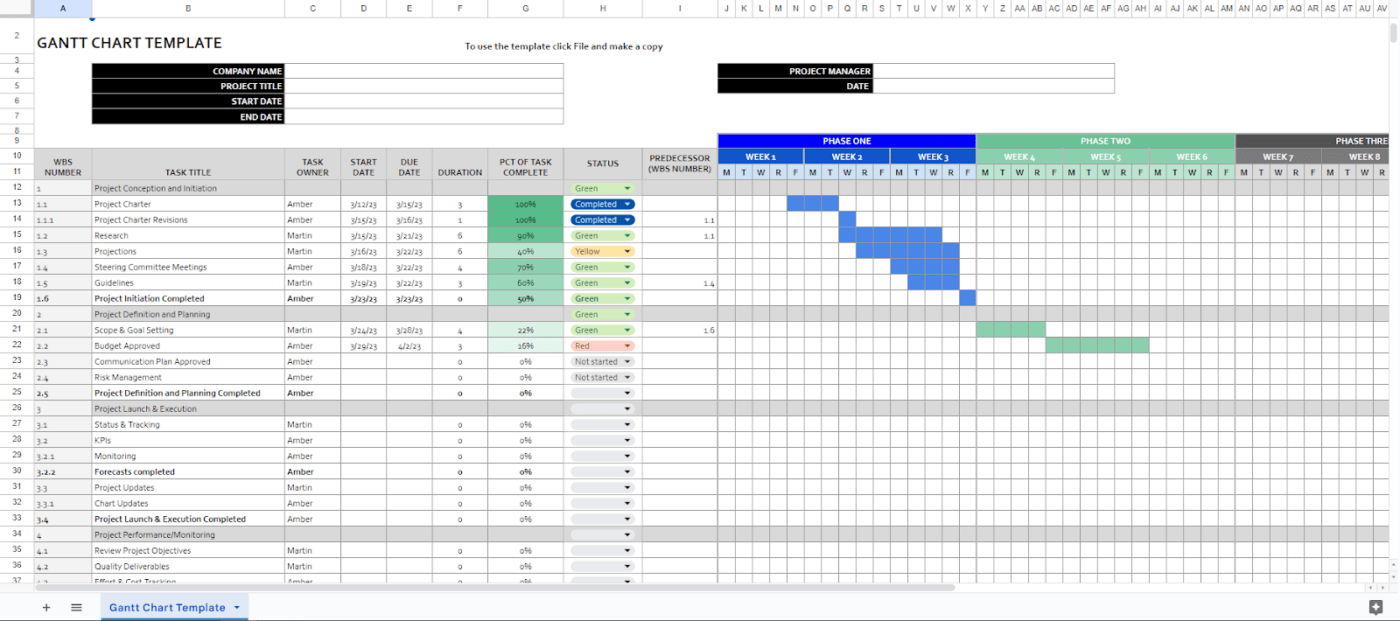
The Gantt Chart Template by The Digital Project Manager (DPM) is a smart way to map project timelines and ensure everything’s on track. It includes multiple must-have elements to break down a project into manageable pieces, including:
The phases and weeks are structured to provide a visual breakdown of project progress over time, with each phase representing a key project section.
For example, ‘Phase One’ spans weeks 1 to 3 for planning and initiation. ‘Phase Two’ covers weeks 4 to 6 for execution, and ‘Phase Three’ happens in weeks 7 to 9 for project wrap-up and review.
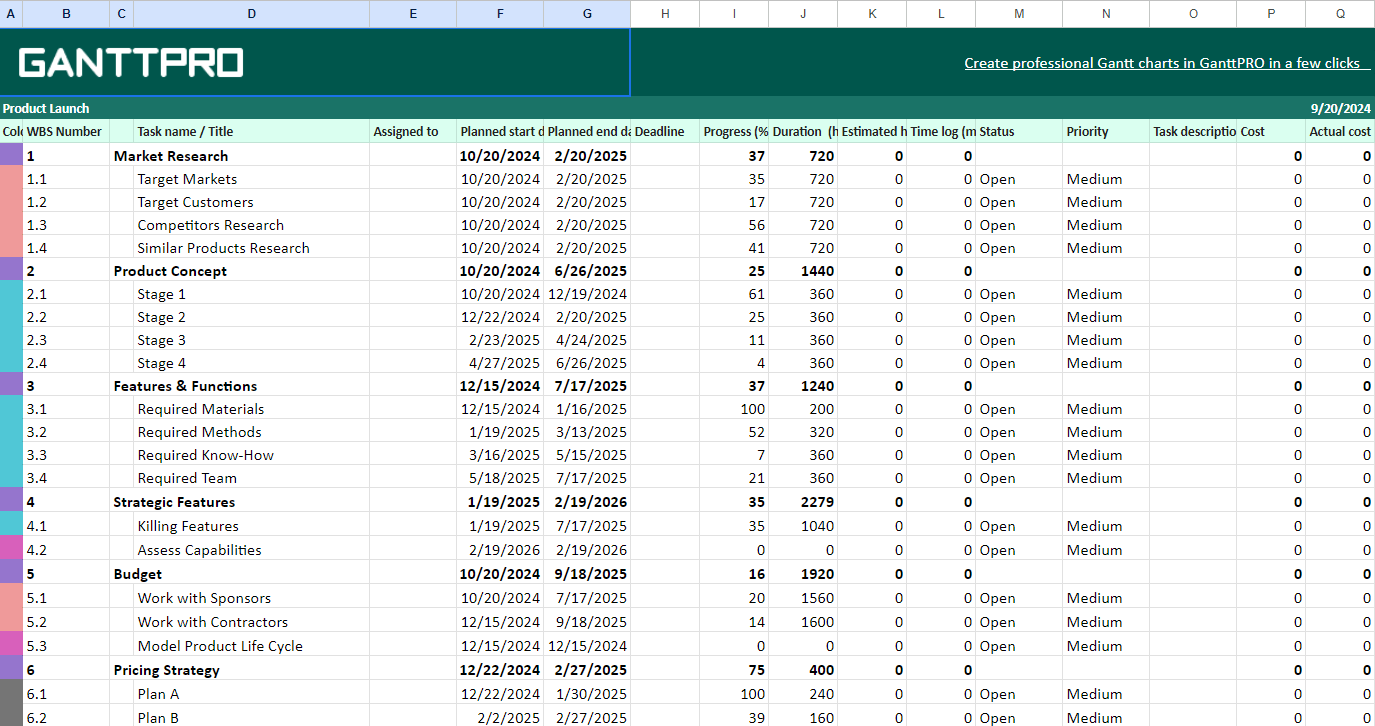
The GanttPRO’s Gantt Chart Product Launch Plan Template is designed to provide a clear, structured roadmap for managing all aspects of a product launch.
It breaks the project into phases for easier task management and includes real-time progress tracking to prevent delays and guarantee accountability. Plus, estimated hours and actual time logs allow you to manage time and resources efficiently.
For example, if ‘Competitor Research’ exceeds the planned two weeks, you can re-adjust the rest of your schedule to keep the launch on track.
Further, the ‘Priority’ column lets you focus on critical tasks, ensuring you address urgent items first. The ‘Cost’ column monitors your budget, while ‘Task Description’ lets you add more detailed instructions.
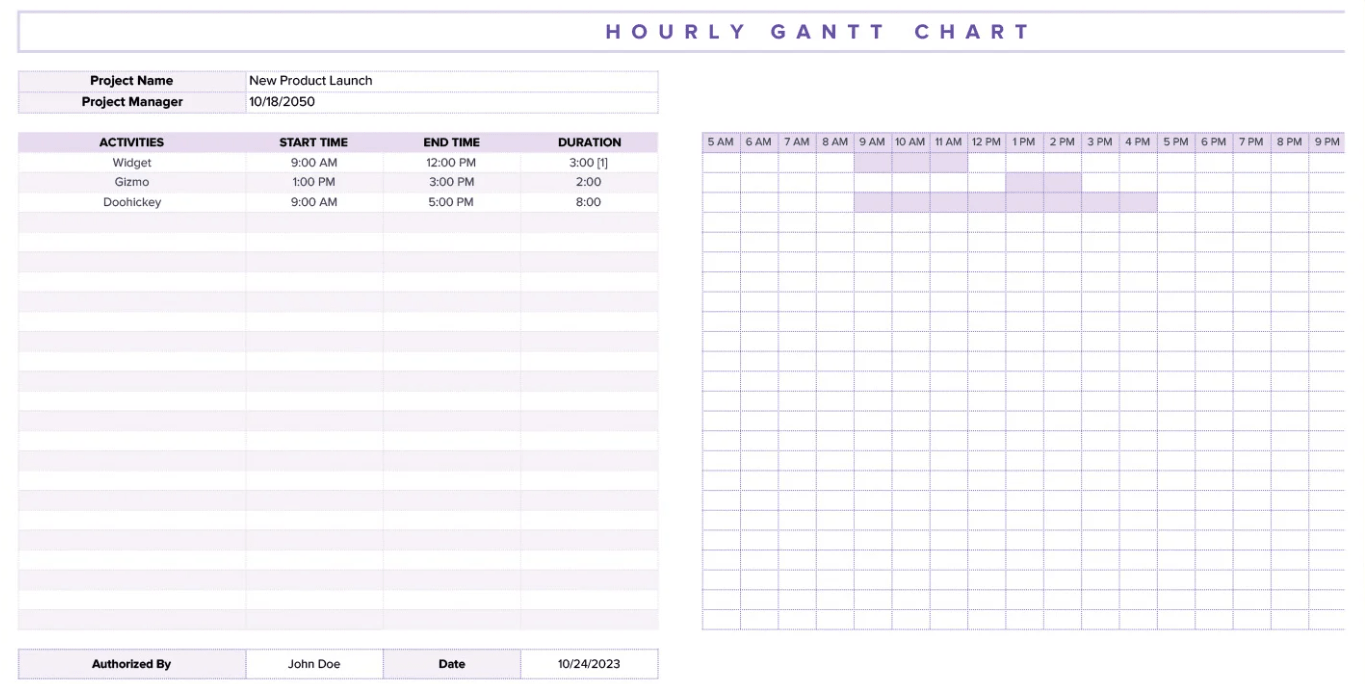
The Hourly Gantt Chart Template by Template.net keeps everything organized—from meetings to task execution—plotted on an easy-to-read hourly grid format.
With this chart, you can easily monitor multiple tasks—each with its start and end times.
For example, ‘Design Review’ wraps up by 12 PM, followed by ‘Quality Inspection’ at 3 PM, while ‘Campaign Setup’ progresses throughout the day.
The benefits are clear: it simplifies hourly planning for project managers, event planners, or anyone handling multiple short-term projects. It also guarantees tasks don’t overlap and enables teams to stay accountable for hitting milestones.
Further, you can spot potential downtime or inefficiencies, ensuring every hour is used efficiently to keep the project moving forward.
If there’s a two-hour gap between ‘Design Review’ ending at 12 PM and ‘Quality Inspection’ starting at 3 PM, you can reassign team members to smaller tasks like finalizing presentation materials or prepping for the next meeting.
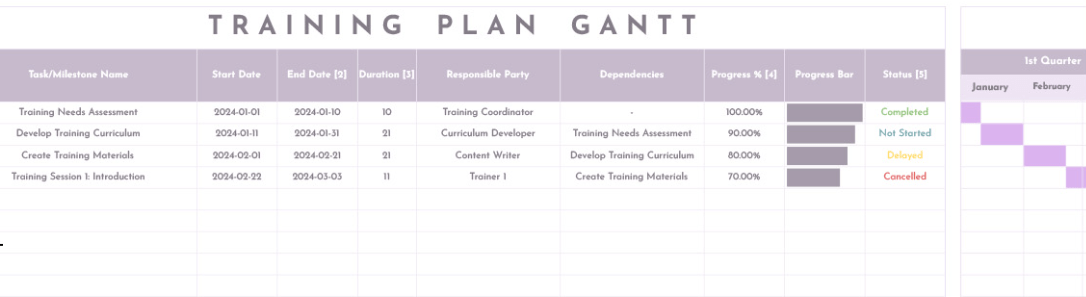
When you’re handling multiple training tasks, each with its deadlines and dependencies, the Training Plan Gantt Template by Template.net can give you a quick overview of who’s handling each task, what’s completed, and what’s coming up next.
One major benefit is spotting delays early. If creating training materials falls behind, you can see immediately how it impacts other tasks, like training sessions. This proactive approach saves time and guarantees nothing gets derailed.
The ‘Progress %’ column helps prioritize tasks based on criticality and approaching deadlines.
For example, if ‘Develop Training Curriculum’ is at 80%, you know it’s close to completion but needs a push. So, follow up with the content writer to finish it off. Meanwhile, with ‘Prepare Training Slides’ at 60%, focus on completing the content and design for the upcoming presentation.
📮ClickUp Insight: 92% of workers use inconsistent methods to track action items, which results in missed decisions and delayed execution.
Whether you’re sending follow-up notes or using spreadsheets, the process is often scattered and inefficient. ClickUp’s Task Management Solution ensures seamless conversion of conversations into tasks—so your team can act fast and stay aligned.
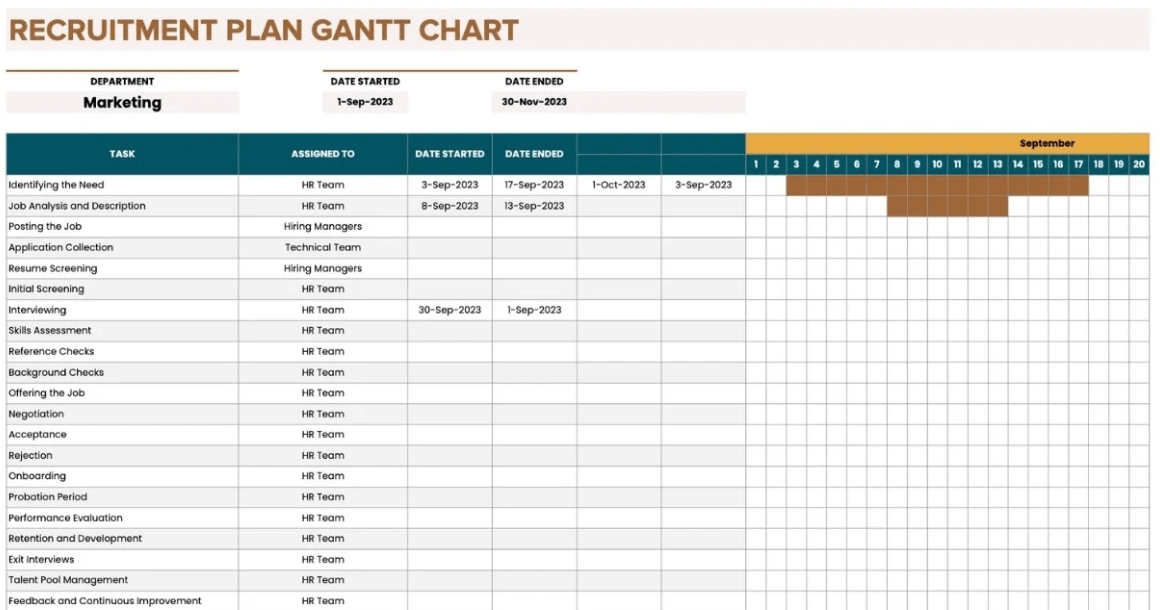
Feeling overwhelmed with your recruitment process? The Recruitment Plan Gantt Chart Template by Template.net can help identify requirements across various departments and help the HR department plan and monitor recruitment tasks.
Key benefits include:
This free Gantt chart template is perfect for HR departments looking to stay organized, hiring managers who want a clear view of recruitment progress, and teams that need a collaborative way to manage the hiring process without confusion.
Using Google Sheets for Gantt charts is a convenient and accessible option, but it comes with several limitations:
💡Pro Tip: Virtual whiteboards and mind maps function as excellent Gantt chart alternatives for real-time collaboration and giving complex ideas a logical structure.
Looking for a step up from Google Sheets to a feature-rich Gantt chart software?
ClickUp offers a more efficient and user-friendly solution with comprehensive Gantt chart features and project management capabilities like task dependencies, critical path analysis, and dynamic visual elements. Its intuitive interface and extensive customization options make managing and tracking projects easier.
ClickUp also has a vast library of free and ready-to-use Gantt chart templates. These templates let you quickly apply and customize complex project schedules with pre-built structures and workflows.
The ClickUp Gantt Timeline Template is your go-to tool for keeping projects on track. Whether managing daily operations or long-term goals, you can visualize project timelines, track dependencies, and monitor progress in real time.
It’s packed with features like:
Ideal for: Project managers and team leads handling multiple projects, especially those with complex timelines where task overlap is frequent.
Building a new website? With design reviews, content creation, and deadlines piling up, you need an efficient way to manage the tasks on your website launch checklist.
ClickUp Building Web Pages Gantt Chart Template is customizable to fit your project needs, whether creating the homepage or product pages. Plus, it’s quick to set up—you can start planning and optimizing your workflow in seconds.
With four views—Gantt, List, Board, and Embed—you can zoom in on the tasks that matter most. For example:
The template also includes Custom Fields like ‘Figma,’ ‘Permalink,’ and ‘Stage.’
Say you’re creating a landing page for a seasonal sale. Attach the Figma link directly to the task for quick access during design reviews. The ‘Permalink’ field tracks the exact URL so your team knows where the page will live on the site. And the ‘Stage’ field lets you tag whether the page is in ‘Wireframe,’ ‘Design,’ or ‘Final Review.’
Ideal for: Web designers fine-tuning webpage layouts, project managers overseeing timelines and tasks, and development teams tracking progress and details.
💡Pro Tip: If you need quick insights about your web design project, simply ask ClickUp Brain—ClickUp’s AI assistant. For example, it can instantly provide the deadline for the seasonal sale landing page and generate summaries of project progress, upcoming deadlines, and any issues flagged in the Gantt Chart.
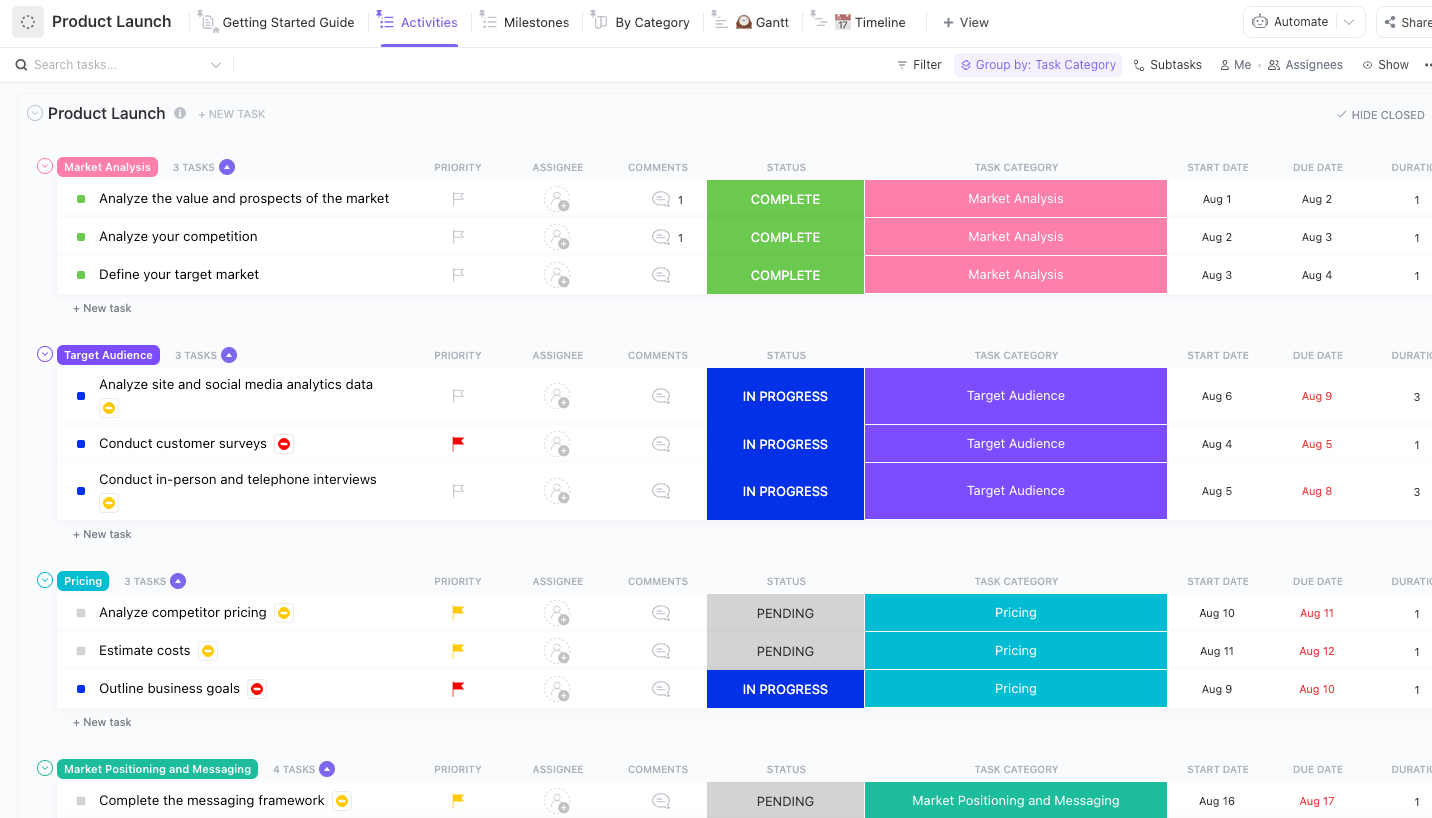
When your team is knee-deep in developing a new app, creating marketing materials, and planning the launch event, you can count on the ClickUp Product Launch Checklist Gantt Chart Template to transform this chaos into a streamlined, structured plan.
This template provides a visual timeline showing task start and end dates, helping teams track deadlines. With clearly defined tasks and responsibilities visible to everyone, it also reduces miscommunication and delays.
With this template, you can:
Ideal for: Product teams, including UX designers working on prototypes, developers managing product builds and releases, and strategists focusing on market positioning and launch objectives.
The ClickUp Waterfall Management Gantt Chart Template is a structured, easy-to-use tool for helping teams track, manage, and execute complex projects. It allows users to break down tasks, assign responsibilities, track dependencies, and monitor progress visually.
Its key benefits are:
You can also visualize dependencies between tasks using the Gantt View. For example, venue booking depends on securing a permit in an event planning project. If the permit process is delayed, you can see how that impacts other tasks like catering and invites, giving you time to adjust.
Ideal for: Project managers overseeing large-scale IT overhauls, software development, product launches, or infrastructure projects—where task dependencies, timelines, and collaborative tracking are crucial.
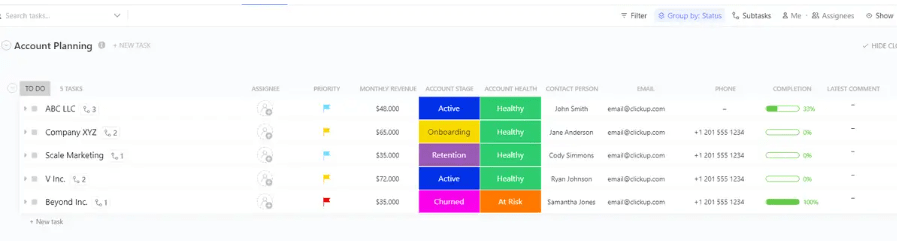
The account management team often struggles to track client renewals, product rollouts, and follow-ups across multiple accounts in a timely manner. The ClickUp Account Planning Gantt Chart Template simplifies account management by breaking it down into simple, actionable steps that are easy to track and monitor.
It allows you to:
Further, the Timeline View lets you schedule tasks and deadlines, like client renewals, directly into your calendar. The Gantt View provides a detailed breakdown of how those Tasks progress over time. Finally, the Accounts per Stage View offers a high-level snapshot of each account’s progress—like which ones are onboarding, up for renewal, or in follow-up.
You can also leverage ClickUp Milestones to identify your project’s critical parts.
For instance, set milestones for key events like sending the renewal proposal, securing contract approval, and scheduling the review meeting. Each Milestone marks an essential checkpoint, helping you focus on these crucial tasks.
Ideal for: Sales and account managers who oversee multiple clients and focus on customer retention and success.
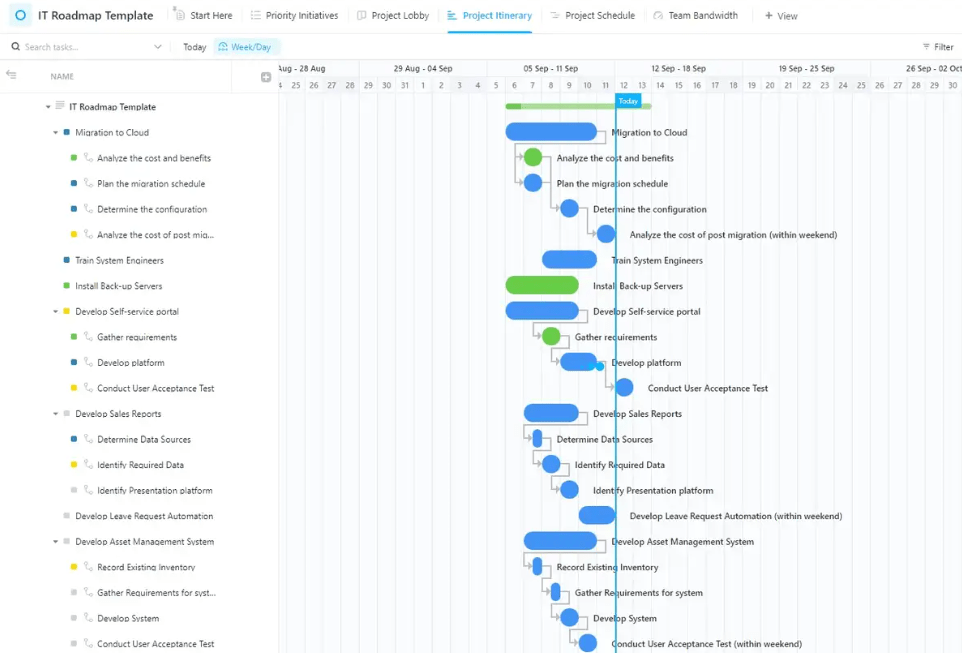
The ClickUp IT Roadmap Gantt Chart Template visualizes your entire IT project to ensure the smooth execution of every critical task, from setup to deployment.
Some of its key features are:
Ideal for: IT managers and project leads handling complex, multi-stage IT projects— rolling out new systems, migrating data, or upgrading infrastructure.
Gantt charts provide a clear view of your project timeline, task dependencies, and progress—keeping deadlines, resources, and schedules on track.
While Google Sheets does offer a solid starting point with its Gantt chart templates, it has its limitations.
That’s where ClickUp steps in as a powerful project management software. Its Gantt chart templates go beyond the basics, offering advanced visual elements, real-time progress tracking, and automated updates. Plus, you can tailor these templates to fit different workflows.
This level of customization and functionality keeps you on top of details, streamlines processes, and ensures smooth project management.
Sign up for free and switch to ClickUp’s Gantt chart templates today for seamless project tracking.

© 2026 ClickUp

There’s an easier way. Try a free AI Agent in ClickUp that actually does the work for you—set up in minutes, save hours every week.