Sorry, there were no results found for “”
Sorry, there were no results found for “”
Sorry, there were no results found for “”
Ever stared at a long list of numbers in an Excel spreadsheet and wished for a little visual magic? You’re not alone—Excel has 1.1 billion users worldwide, and many rely on progress bars to make data more digestible.
These nifty bars transform boring numerical values into easy-to-read data visualization, making it a breeze to track progress, task completion, or anything that moves from 0% to 100%. Whether crunching numbers, managing Excel projects, or creating to-do lists, adding a visual bar can show you just how far you’ve come.
And the best part? You don’t need to be an Excel wizard to create one. With a few clicks and some conditional formatting rules, you’ll have a sleek, color-filled Excel progress bar that automatically adjusts as your data updates. Let’s show you how to get these interactive progress bars going in this blog post.
🧠Fun Fact: In the ’90s, Microsoft Excel was packed with hidden Easter eggs, including a flight simulator in Excel 97 that let users navigate a 3D landscape—all within a spreadsheet!
Tracking project progress is much easier when you can see updates at a glance. A visual indicator keeps things clear—especially when juggling multiple tasks.
While milestone charts are excellent for in-depth tracking, progress bars offer a quick, eye-catching way to monitor updates. They also add a bit of flair to project management.
Ready to bring your Excel spreadsheet to life? Here’s a simple step-by-step guide to adding a progress bar in Excel.
Start by entering your data into an Excel spreadsheet. For instance, input the percentages representing task completion. Each percentage will reflect the progress of different milestones in your project.
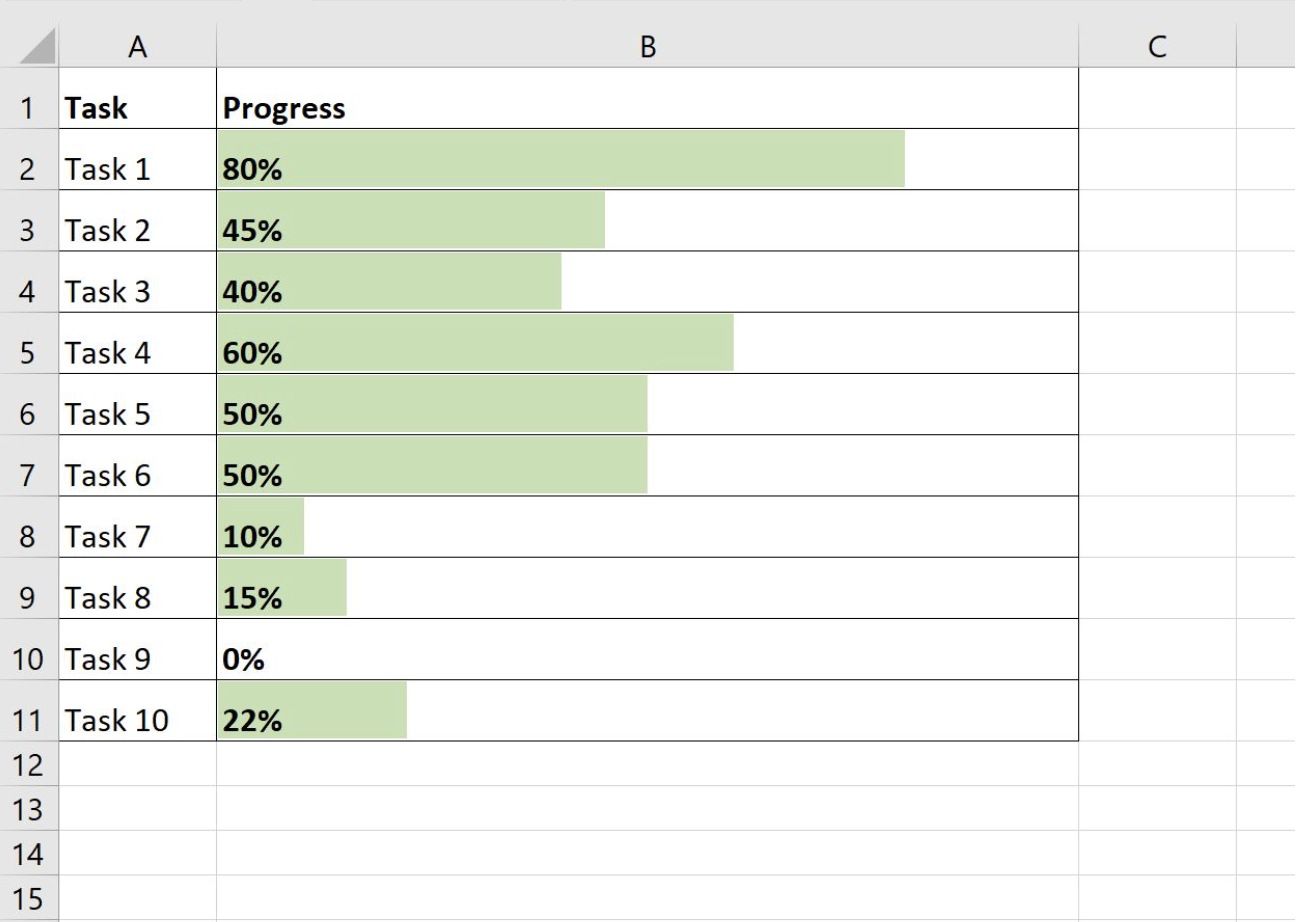
Let’s say you have 10 tasks, and their completion percentages are in cells B2 to B11. Your data might look something like this:
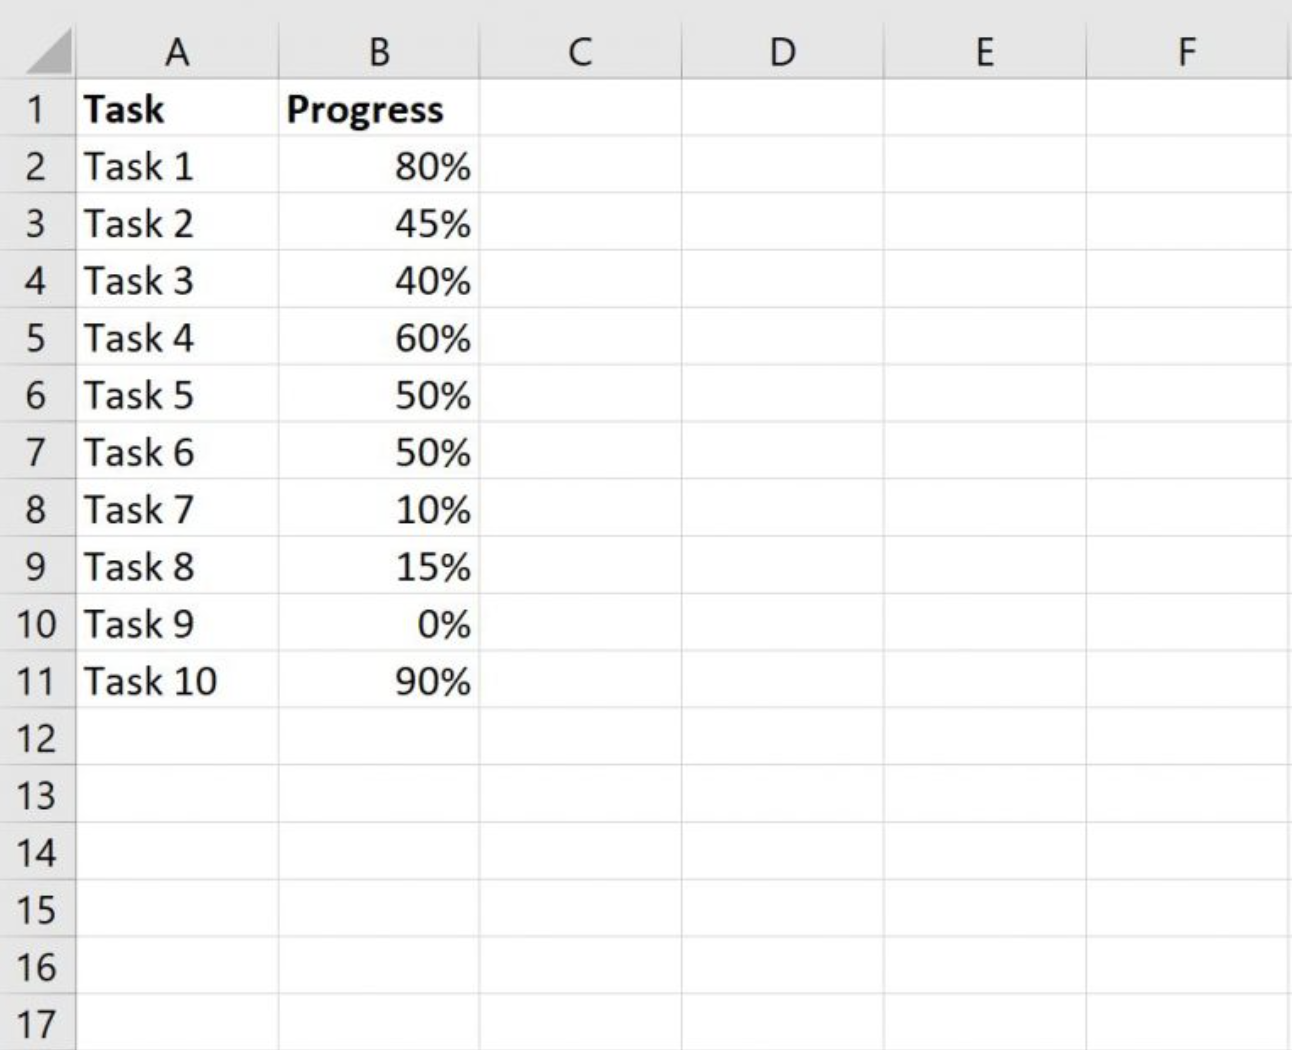
Highlight the range where your percentages are stored (B2:B11).
Next, head to the Home tab on the Excel ribbon. Click on Conditional Formatting, and a dropdown menu will appear. From here, select Data Bars to see different styles, then click More Rules to customize your progress bars.
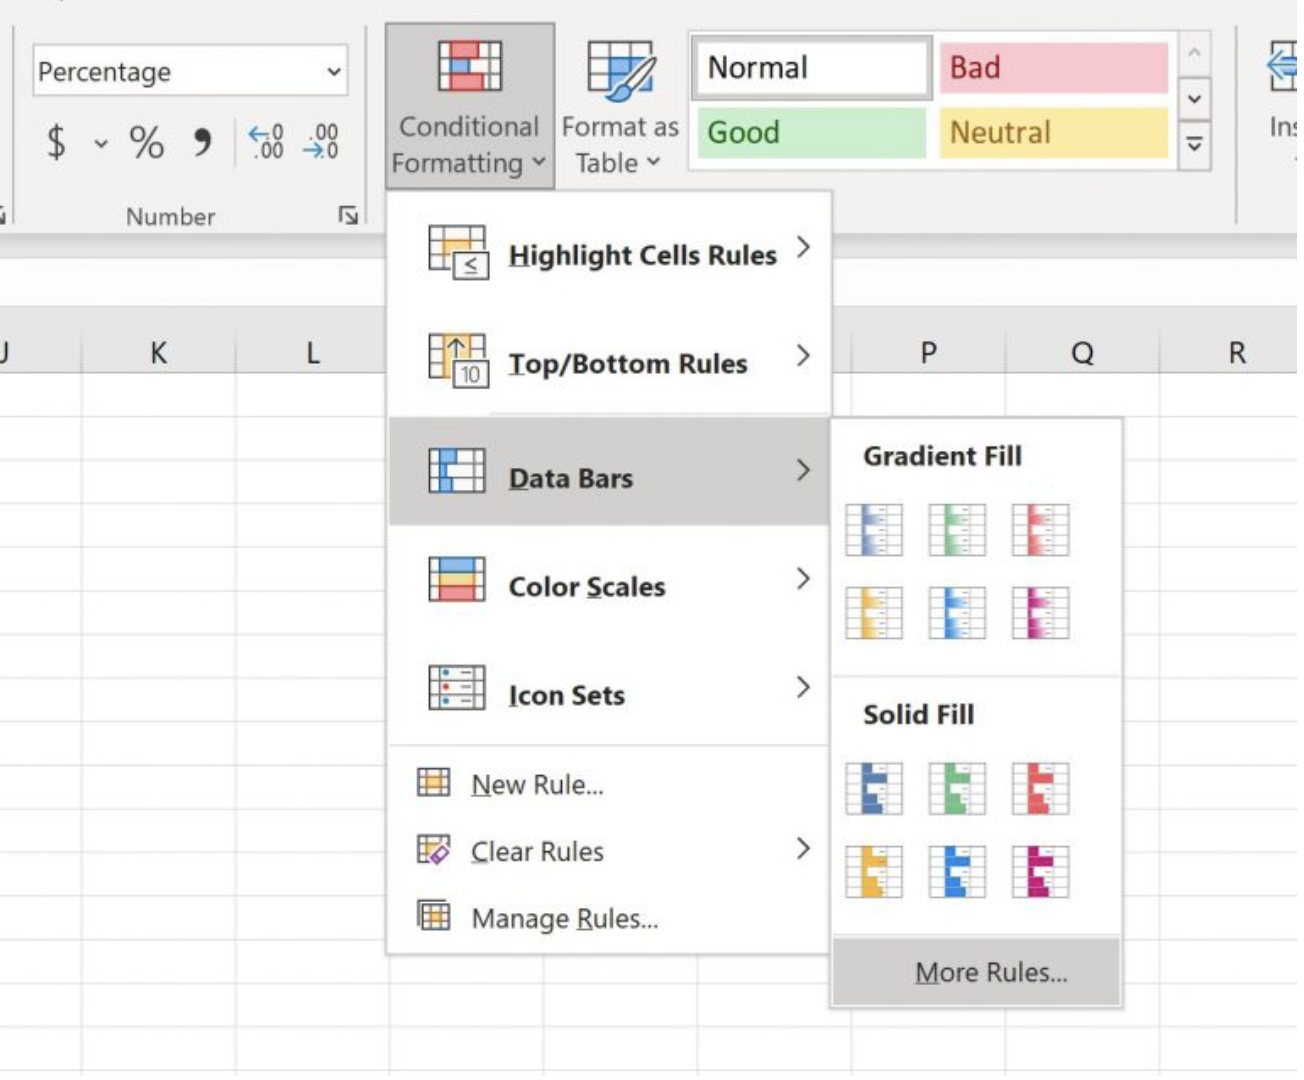
In the New Formatting Rule window, customize the settings to ensure your progress bars display correctly:

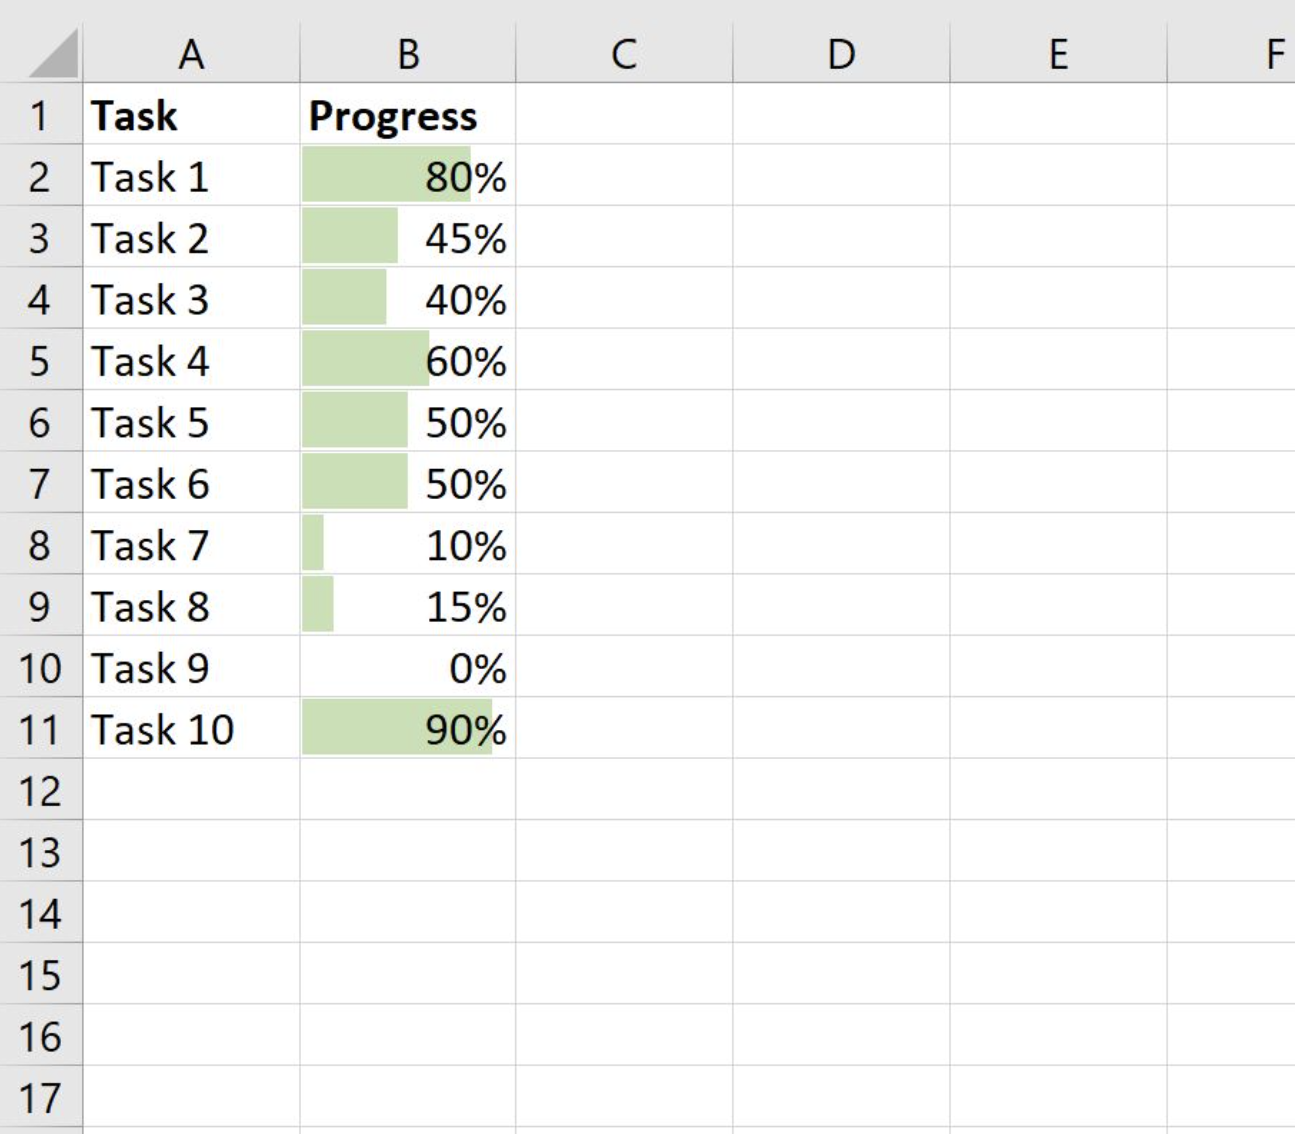
Now, each cell in column B will display a progress bar that adjusts automatically based on the progress percentages.
👀Did You Know? There’s an annual world championship in Excel called the Microsoft Office Specialist World Online Championship, where students aged 13 to 22 from around the globe compete. In 2021, Ami Nakazono from Japan (Microsoft 365 Apps and Office 2019) and Songyao Luo from China (Office 2016) took home the top prizes, earning US$7,000 each!
Finally, tweak the column width and row height to make your progress bars stand out. Adding borders around the cells helps keep things neat.
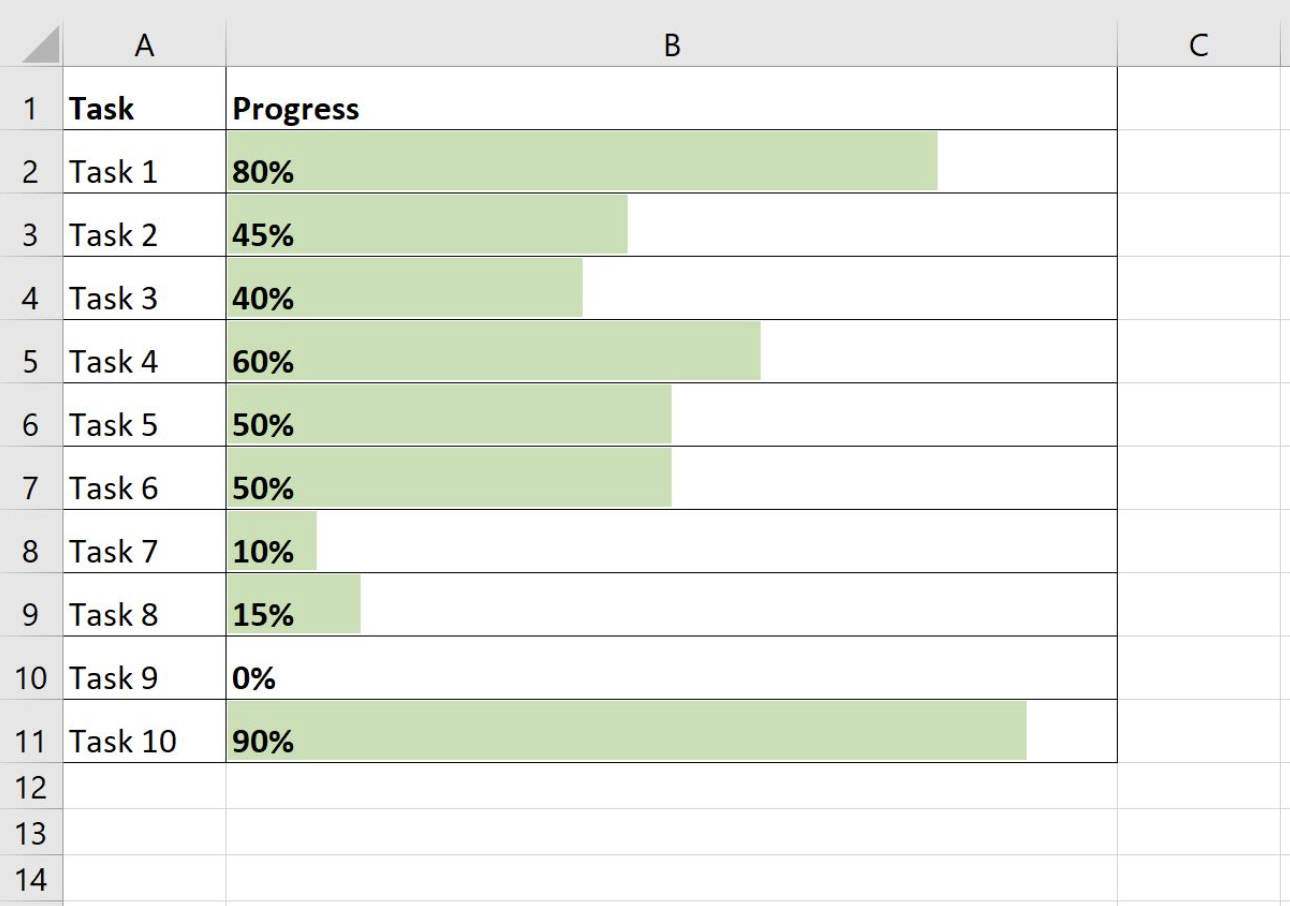
For better readability, align the text to the left side so the percentage minimum and maximum values appear next to the progress bars. This way, you get both a numerical and a visual update at a glance.
💡 Pro Tip: Want to make Excel reporting less of a hassle? Link your progress bars to formulas, so they update automatically—no more manual tweaks every time your data changes!
Now, whenever you update a task’s percentage, the Excel progress bar will automatically adjust to reflect the new value. Whether tracking individual tasks or an entire project, this method gives you a clear, visual snapshot of progress.
With your Milestone chart or task dashboard, you’ll always know what’s done, what’s in progress, and what still needs attention!
🧠Fun Fact: Tatsuo Horiuchi creates stunning digital paintings using Excel! He uses the “Insert Shapes” option on the Home ribbon to craft colorful artwork, putting them for sale as Excel spreadsheets.
While creating an Excel progress bar to track progress, there are some limitations to consider:
📮ClickUp Insight: Low-performing teams are 4 times more likely to juggle 15+ tools, while high-performing teams maintain efficiency by limiting their toolkit to 9 or fewer platforms. But how about using one platform? As the everything app for work, ClickUp brings your tasks, projects, docs, wikis, chat, and calls under a single platform, complete with AI-powered workflows. Ready to work smarter? ClickUp works for every team, makes work visible, and allows you to focus on what matters while AI handles the rest.
If Excel’s limitations hinder your project progress tracking, ClickUp is here to help.
As the everything app for work, ClickUp offers a more dynamic and interactive data visualization alternative to Excel. It’s packed with tools that can keep your team in sync with real-time updates.
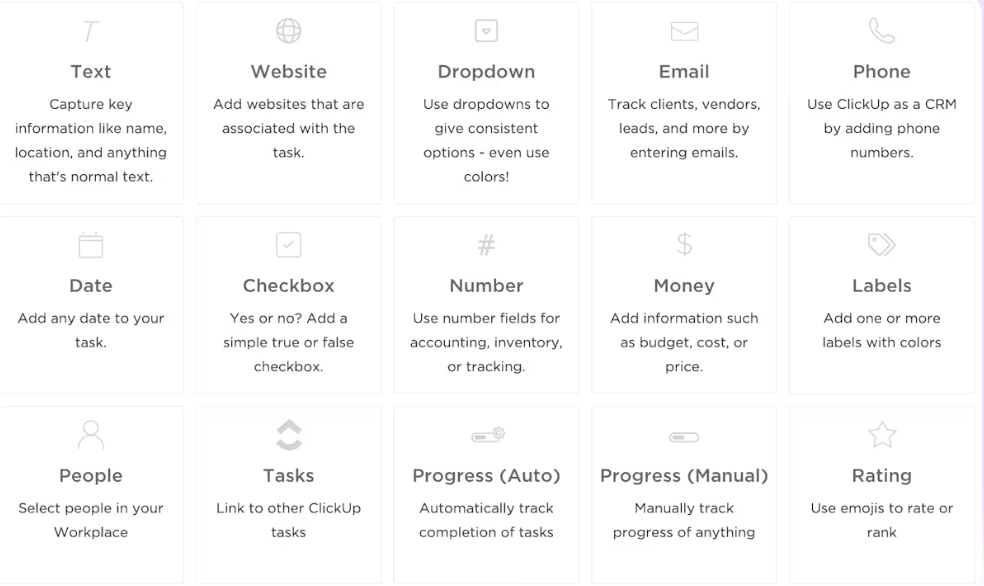
ClickUp makes it simple to track progress manually with ClickUp Custom Fields. Add a new field to your task view to use a percentage field. Then, select “Progress Bar” as your custom field type. Give your custom field a descriptive name (e.g., “Project Progress”).
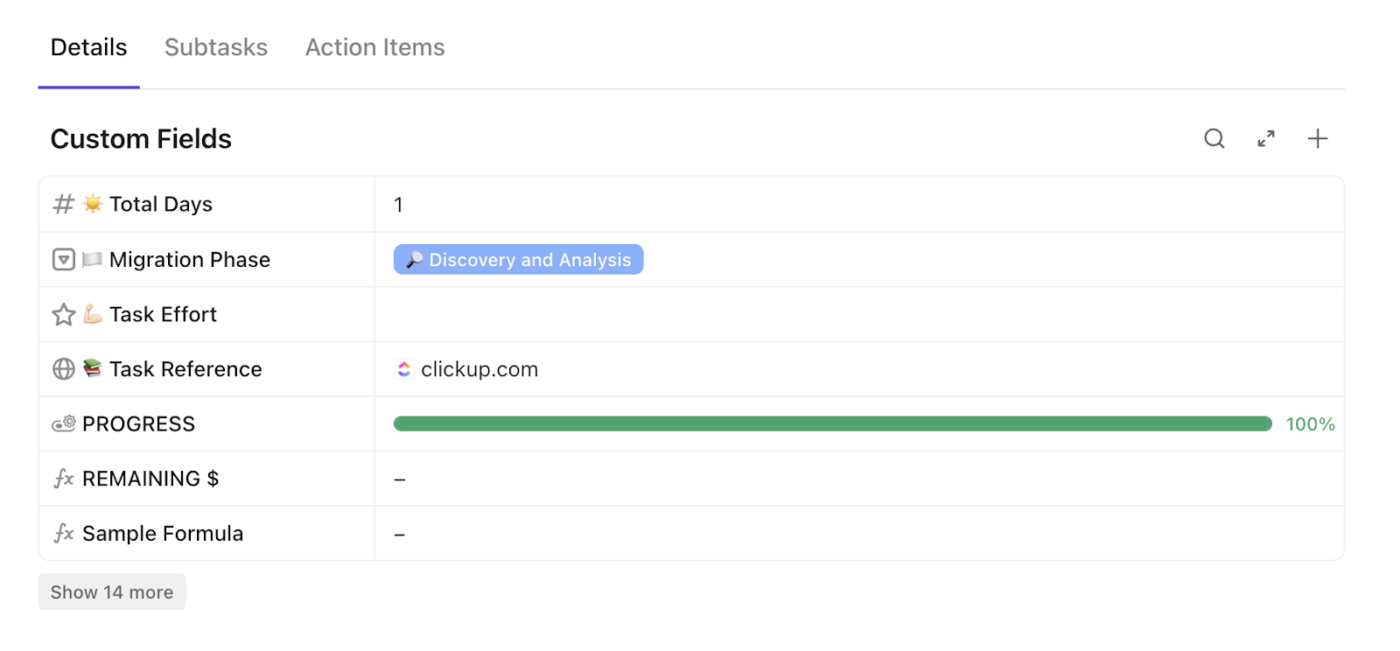
This allows you to manually input a percentage to track the task’s progress. A visual progress bar will appear within your task that updates according to the percentage you enter. This feature is excellent for tasks without a defined status path or for manually tracking milestones.
Additionally, if you’re an admin or owner, you can enable the Show status progress ClickApp to enhance task progress tracking.
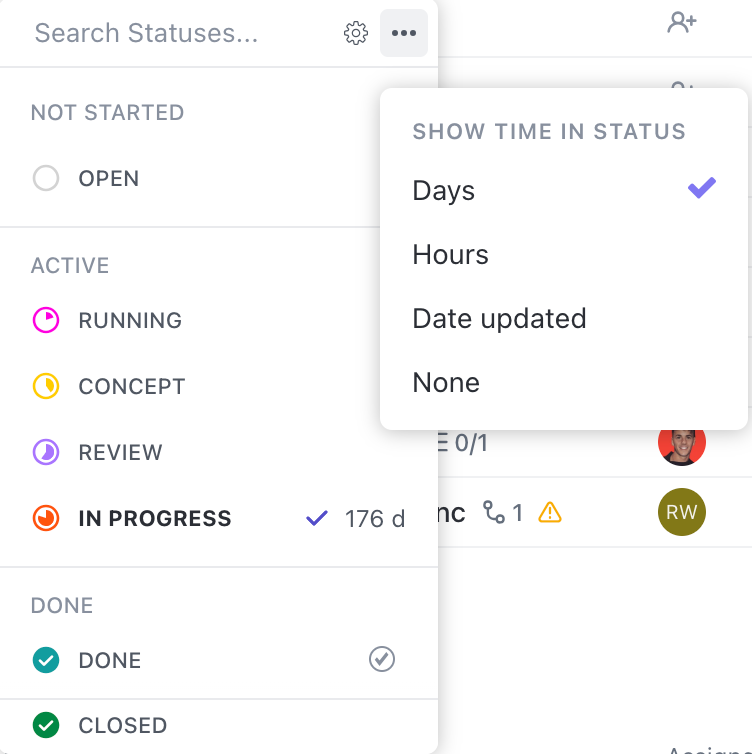
When enabled, ClickUp displays a progress pie chart that fills as a task moves toward completion, offering a clear visual of progress.
For a manual progress bar, input start, end, and current values. For example, if the range is 10 to 30 and the current value is 20, ClickUp sets progress at 50%, letting you keep track of project tracking with precise percentages.
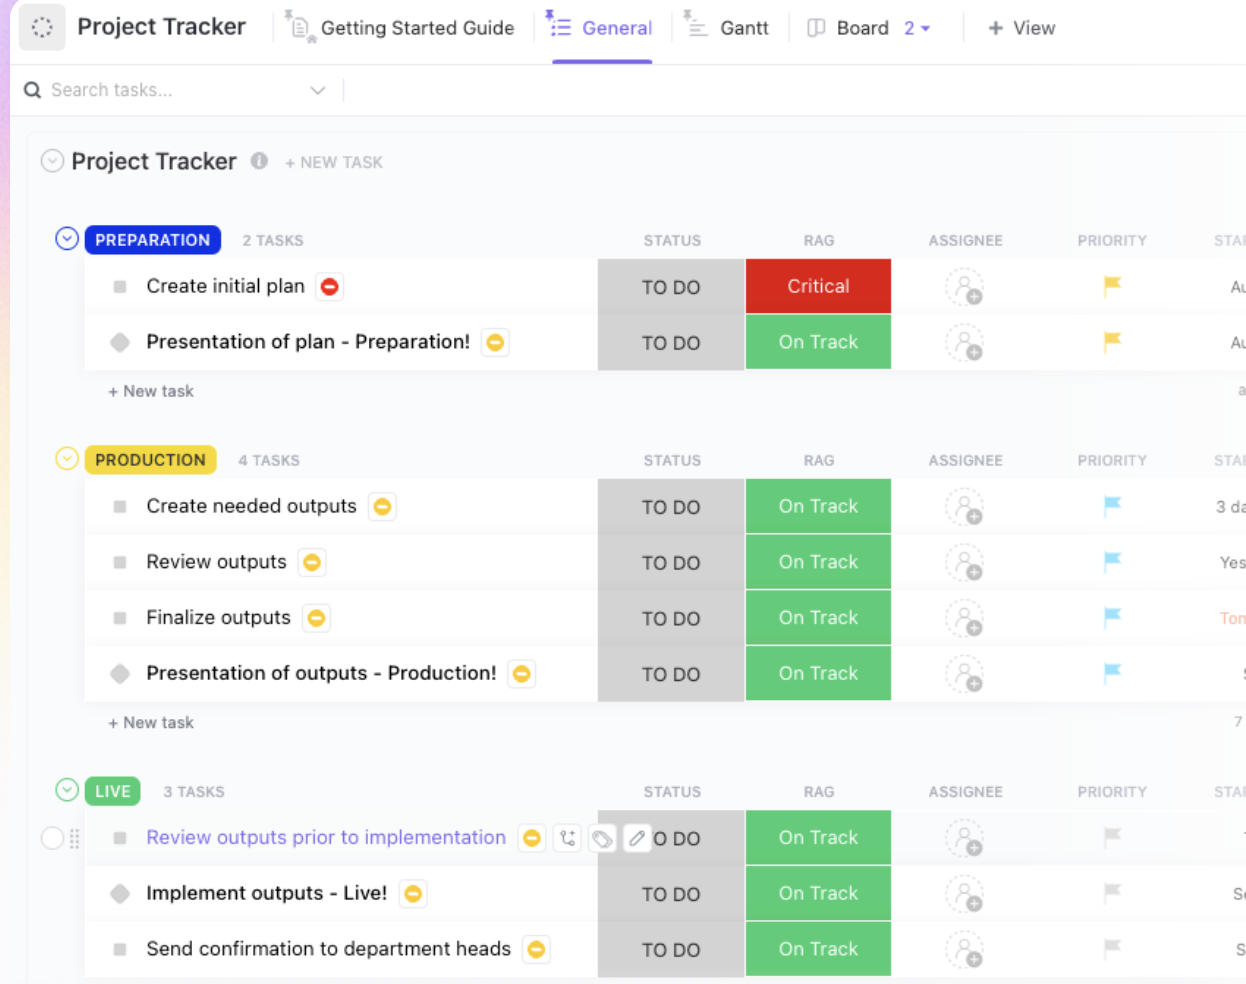
To start quickly, try using the ClickUp Project Tracker Template to keep your projects organized and on track.
This template streamlines everything from budgeting to meeting deadlines by giving you a clear, visual way to manage tasks. With it, you can:
It also helps you spot potential issues early and tackle them before they become bigger challenges!
One of ClickUp’s standout features is its ability to automatically update progress as tasks move through various stages of their lifecycle. With ClickUp Tasks, you don’t need to track every little change manually.
When tasks move through statuses like “To Do,” “In Progress,” or “Completed,” ClickUp automatically updates the progress bar. A completed task shows 100% progress, while unfinished tasks reflect their current stage.
You can assign custom percentage values to each status for precise tracking.
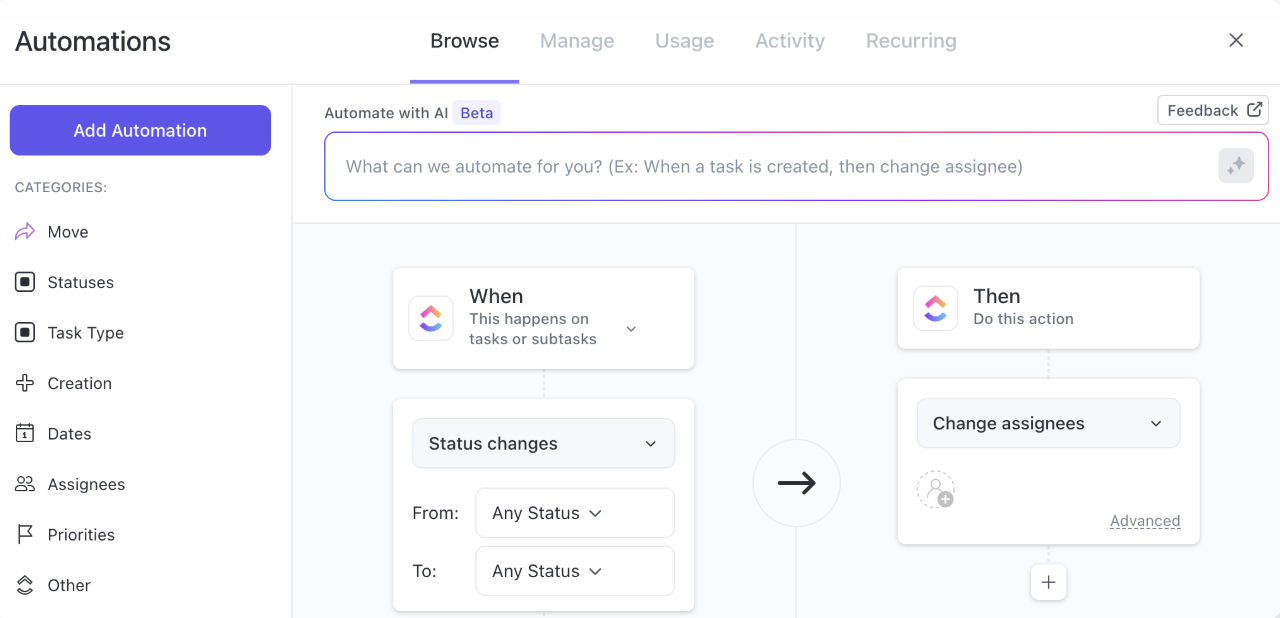
ClickUp also offers task automation, triggering actions like reassigning tasks, sending emails, or adding comments when statuses change. This keeps workflows efficient, ensuring important updates happen automatically as tasks progress.
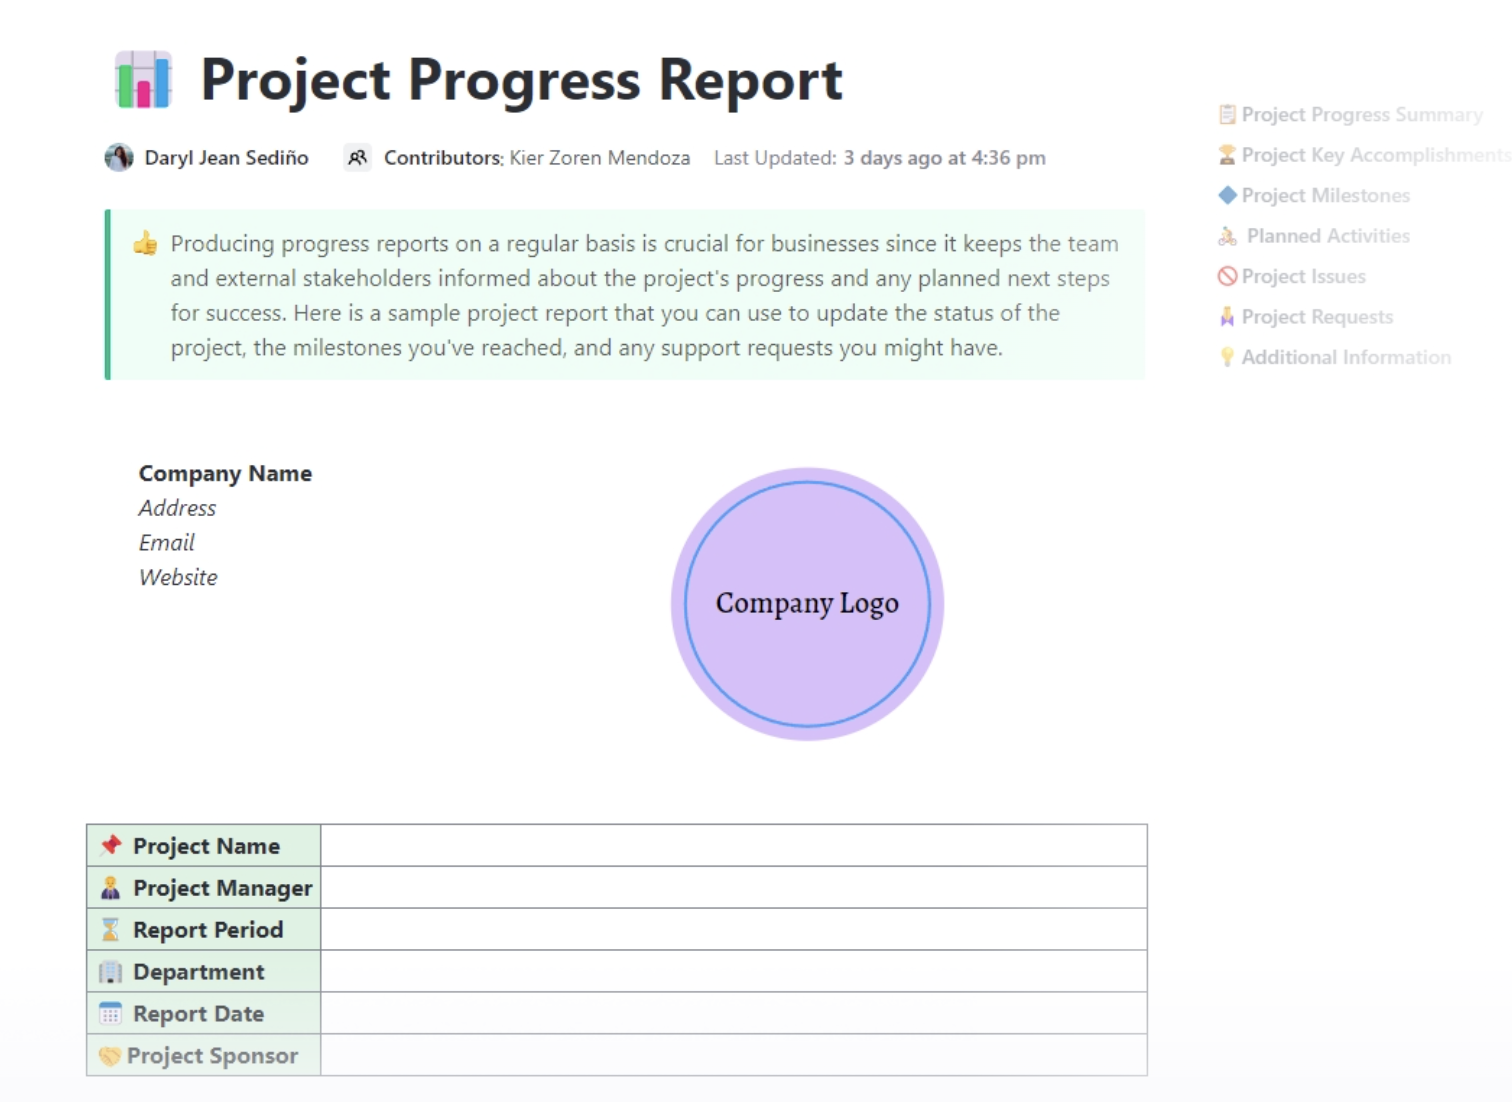
To see this feature in action, use the Project Progress Report Template. This template makes tracking and reporting progress throughout a project’s lifecycle easier.
Plus, with ClickUp Table View, you can easily organize all project tasks in a single, intuitive interface.
You can also access a range of task tracker and Excel timeline templates to further enhance your project tracking and efficiently manage milestones.
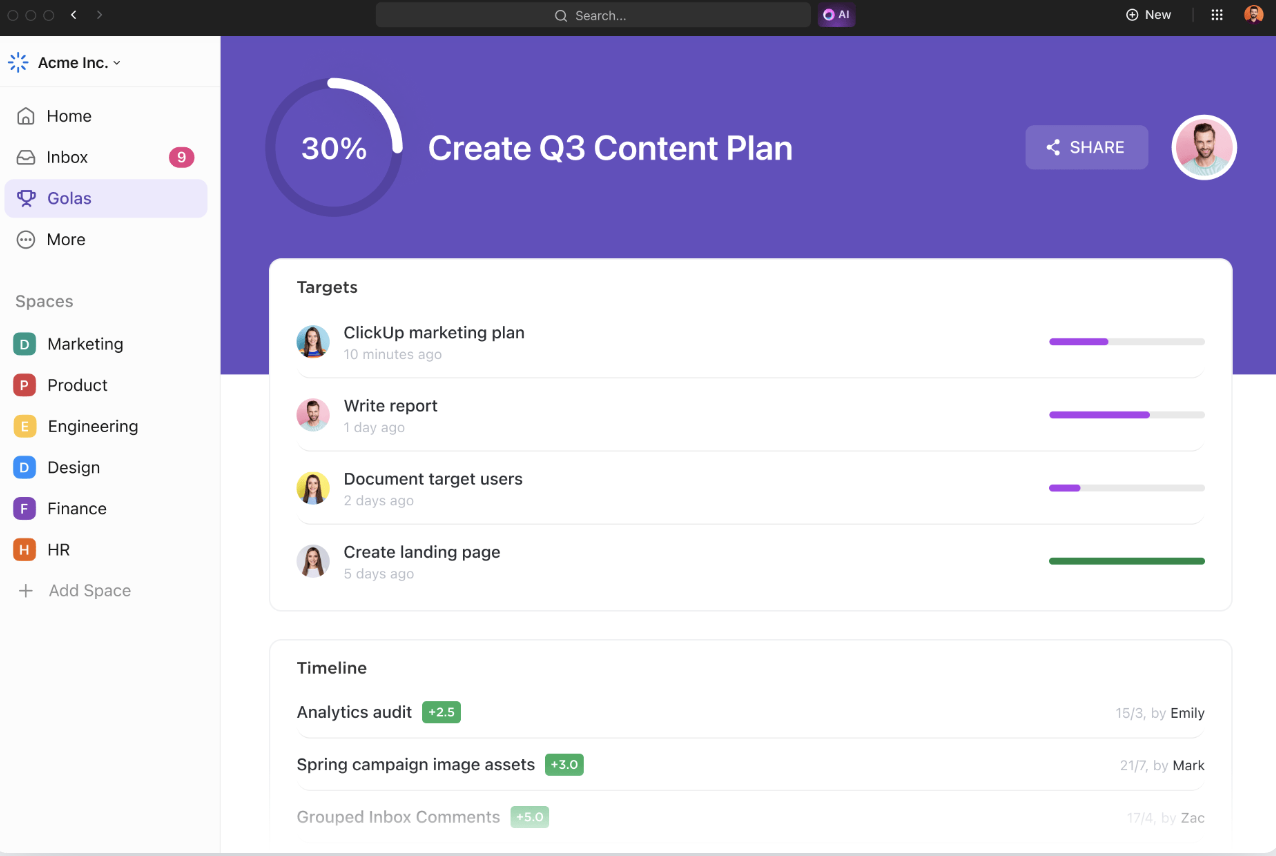
With ClickUp Goals, tracking progress is effortless. Set specific, measurable goals linked to tasks, and the progress bar updates automatically as tasks are completed.
Simply create a goal, define a metric (tasks, revenue, etc.), and link tasks. Your goal’s progress updates instantly as work gets done, keeping everything clear and measurable.
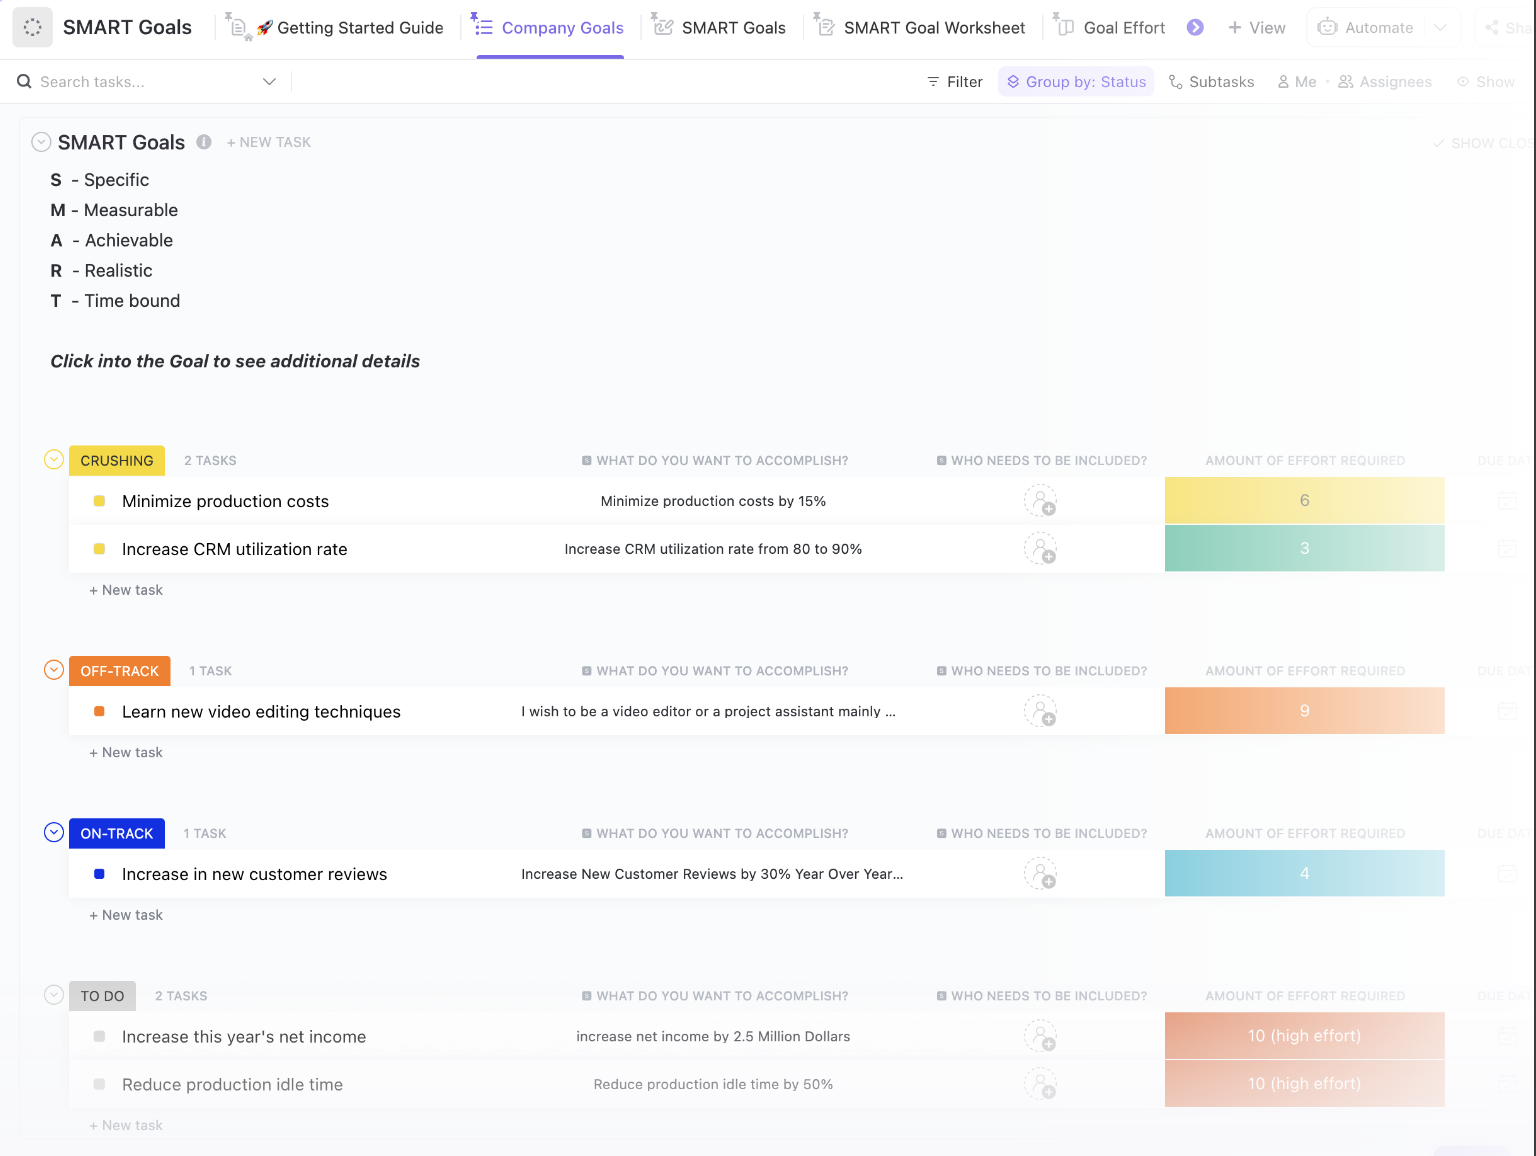
The ClickUp SMART Goals Template can help you set and track project goals efficiently.
Whether launching a project or rolling out a new product line, this template helps your team stay focused and on track!
A comprehensive progress report provides a clear view of the project’s status and deliverables. It highlights resource utilization and offers data on critical project KPIs to track the project’s performance and each team member’s responsibilities.

ClickUp Dashboards give you a visual snapshot of your project’s progress with custom charts, graphs, and widgets. Add Progress Bars or Task Completion Widgets to see task status, project milestones, and areas needing attention at a glance.
Customize widgets to track completion rates or specific goals, keeping stakeholders informed with real-time updates. With a dynamic, data-driven view, you can make quick, informed decisions to keep projects on track.
ClickUp Gantt Charts are great for visualizing project timelines and dependencies, giving you a better overview of your entire project. They also allow you to track task progress, milestones, and deadlines.
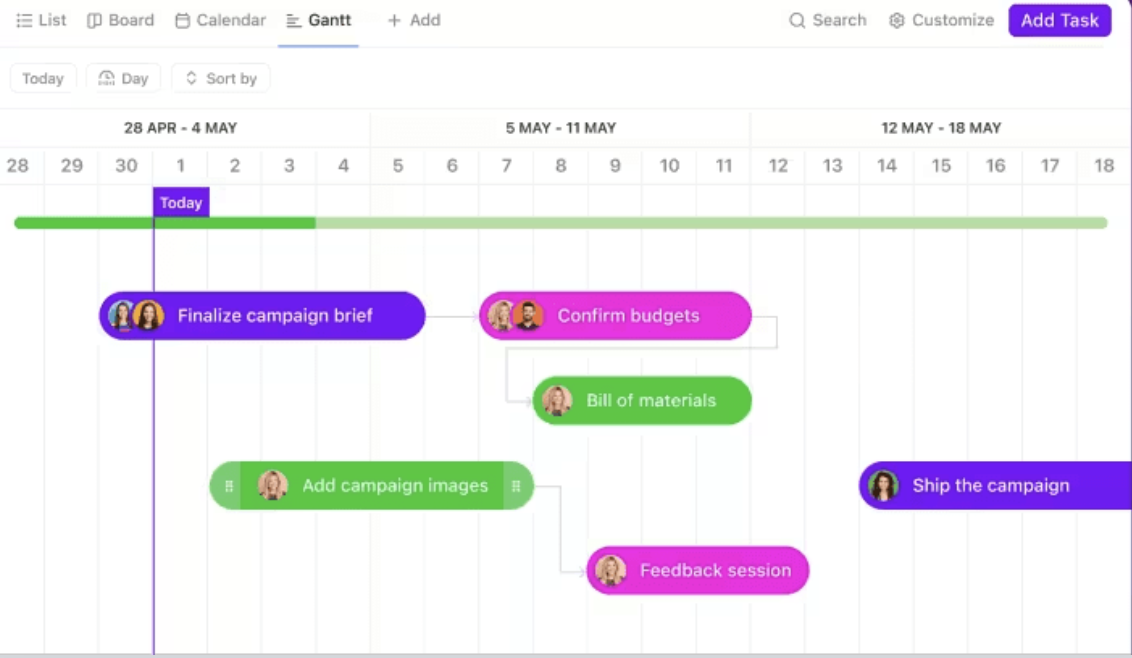
You can see how tasks interrelate over time, making Gantt charts ideal for managing complex projects, from planning marketing campaigns to coordinating product launches.
If you want to start with a pre-built dashboard for tracking progress, you can also use Gantt Chart Excel templates.
For example, the ClickUp Simple Gantt Template offers a comprehensive overview of your project, allowing you to visualize task dependencies and anticipate potential blockers before they arise.
Microsoft Excel excels in many areas, from data analysis to project management, but it falls short when visually tracking progress in real time. Its built-in tools for progress indicators lack dynamic updates and automation, making it harder to get instant, clear insights.
With ClickUp, progress tracking becomes seamless. Automatically updating progress bars give you a real-time view of task completion, so you’re always up to date without manual input.
Moreover, with task management, documentation, and real-time collaboration integrated into one powerful AI-fueled platform, ClickUp is the everything app for work that makes Excel sheets redundant.
Stay ahead of your projects—sign up for ClickUp today!

Arya Dinesh
Max 11min read

Praburam Srinivasan
Max 44min read
Arya Dinesh
Max 16min read

© 2026 ClickUp