Sorry, there were no results found for “”
Sorry, there were no results found for “”
Sorry, there were no results found for “”
Whether you’re launching a product or managing an event, a clear project timeline keeps everyone aligned and accountable.
For many of us, Excel is the go-to for managing project data. With a few tweaks, you can transform it into a fully functional project timeline that tracks every detail—from milestones and dependencies to team responsibilities.
Before you start creating your timeline, remember to avoid these common mistakes most people make with project calendars!
This blog post provides a detailed guide on how to create a timeline in Excel, highlighting different approaches with varying complexity. We then look at some of its inherent challenges and alternative tool options (like ClickUp) to mitigate them.
Here’s a 60-second summary of the blog post “How to Create a Project Timeline in Microsoft Excel”:
Want a timeline that’s easier to manage than a spreadsheet? ClickUp’s Fillable Timeline Template has you covered.
You can use various tools and methods to create a project timeline that defines the project scope, milestones, deliverables, dependencies, etc.
Here are three effective ways to create one in Microsoft Excel:
A Gantt chart illustrates a project schedule, displaying the tasks’ start dates, end dates, and durations.
Here are step-by-step instructions for building a Gantt chart in an Excel file:


The Gantt chart should look like this:


Your Gantt chart should look similar to this:


Your Gantt chart should look like this:

Read More: How to Create a Gantt Chart
Microsoft Excel’s SmartArt tool quickly creates attractive project timelines for tracking basic milestones. Fair warning: it isn’t suitable for editing subtasks or detailed project views.
Here’s how to build a SmartArt project timeline:


You can also add a basic scatter chart or graph in Excel for a visual representation of variation in data over a given period of time.
For those without advanced Excel skills, building project timelines using Gantt charts or SmartArt can be complicated and time-consuming.
That’s where project timeline templates help.
Excel’s in-built project timeline templates provide a pre-formatted structure, allowing you to input data without worrying about design or layout. They give a clear visual representation of milestone data and deadlines with minimal effort and can be easily customized to suit your project needs.
To get started:


Choosing the right Excel timeline template can save you time, but it may limit customization, fail to address unique project needs, and lack specific features required for your industry.
Read More: 5 Steps to Efficient Project Time Management
While Microsoft Excel is an effective project management tool for creating a timeline chart, it comes with some limitations:
These drawbacks can lead to miscommunications, inefficiencies, and duplication of efforts.
Let’s look at one of the top Excel alternatives that helps enhance end-to-end project management workflows.
When it comes to creating project timelines with real-time collaboration and automatic updates, keeping your team aligned and projects on track, ClickUp can be your answer.
ClickUp is a project management platform with multiple tools and features to help your team visualize, manage, and execute project plans efficiently.
It adjusts schedules automatically when deadlines shift or tasks are delayed, keeping the timeline updated in real time. Plus, ClickUp’s progress tracking capabilities help teams identify potential timeline issues early.
Here’s how ClickUp helps you project timelines effortlessly:
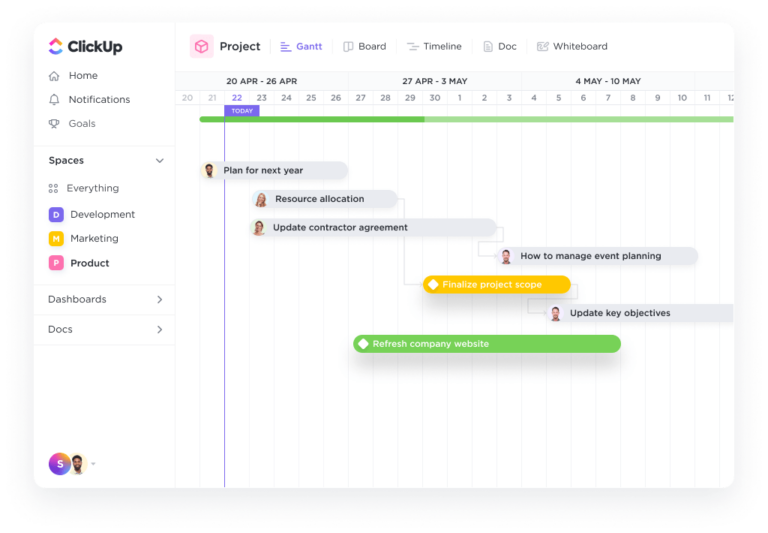
The ClickUp Gantt Chart View visualizes all project elements—including tasks and subtasks—in one place. Its real-time progress tracking feature lets you monitor tasks, celebrate milestones, and meet deadlines.
While the Critical Path feature highlights essential tasks that impact your project deadline, Slack Time shows how much flexibility exists for tasks without affecting the overall timeline. This enables effective prioritization and focused resource allocation to avoid setbacks.
The ClickUp Gantt Timeline Template further enhances project management by providing a structured framework for visualizing timelines. It displays task progress clearly, helping teams understand workflows at a glance and identify potential bottlenecks.
It comes with the following Views:
The template also supports collaboration, allowing team members to add comments, update statuses, and share feedback within the timeline.
💡Pro Tip: Explore these 20 Gantt Chart Examples for Project Management that provide the right insights for your project timeline framework.
The ClickUp Timeline View is part of ClickUp’s broader project management capabilities. It allows you to zoom in to see individual days or zoom out for a broader view of weeks and months. This flexibility helps you track tasks and historical events from start to finish.

One of the standout features is the ability to group tasks by the assignee. This allows you to see how many tasks each team member has at a glance, helping identify workload distribution and overlapping responsibilities.
You can also group by priority, tags, or custom fields for a tailored view of your project’s demands. Plus, change task background colors, adjust notifications, and choose what details to display on your timeline.
Check out our video tutorial to learn more about ClickUp’s Timeline View.
ClickUp offers a huge gallery of project timeline templates that let you jumpstart planning, reducing the time spent on setup. You can tailor them to fit your specific project requirements, adding or modifying tasks, milestones, and deadlines as needed.
Plus, share templates with your team for real-time updates, comments, and feedback, keeping everyone aligned and informed.
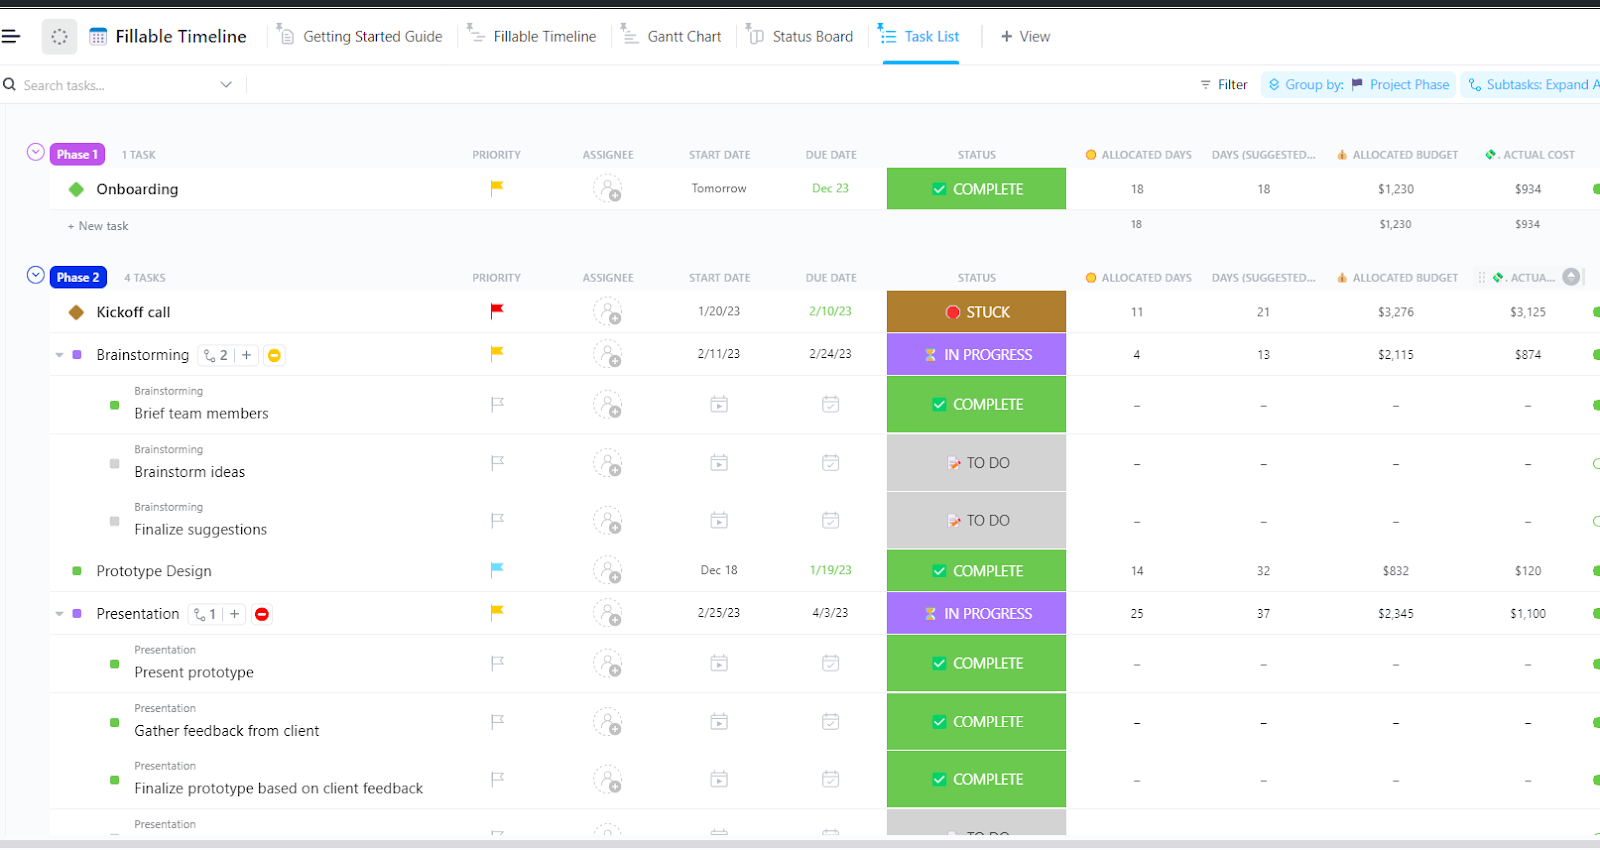
For example, the ClickUp Fillable Timeline Template provides a blank yet structured timeline canvas perfect for planning projects, events, lessons, and more. It lets you track project progress at a glance and share the timeline with teammates, ensuring everyone is on the same page.
💡Pro Tip: You can utilize the ClickUp Project Timeline Whiteboard Template to visualize the entire project timeline in a convenient whiteboard, with easily customized details, such as tasks, durations, dependencies, and more.
ClickUp Whiteboards lets you map out project phases, milestones, and deadlines using visual elements like shapes, lines, and text. This gives a clear, big-picture view of your project’s timeline.
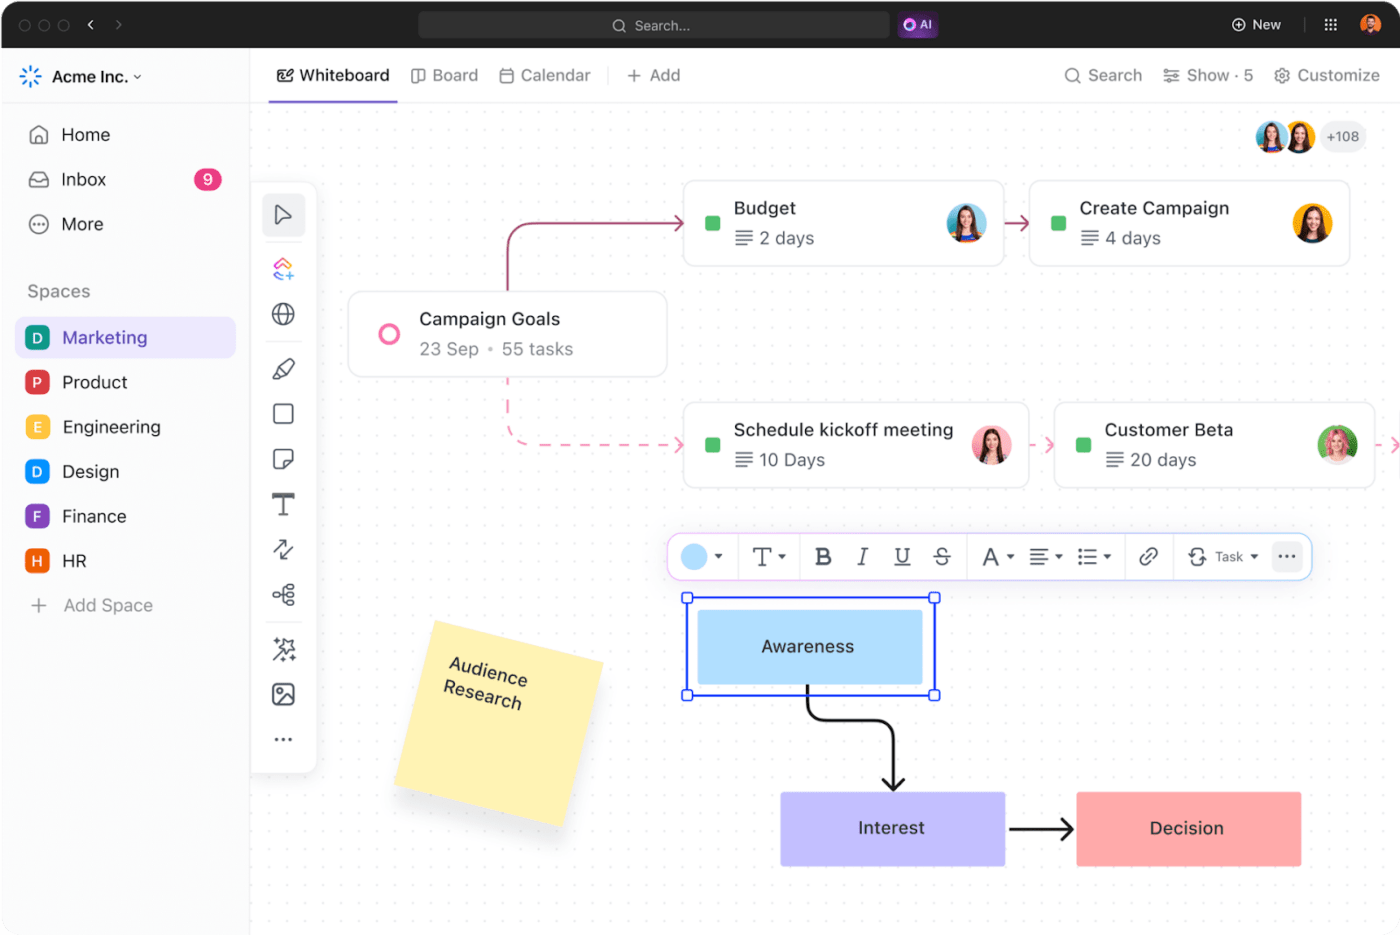
Further, it’s collaborative, allowing multiple team members to contribute, add notes, or make changes to the timeline in real time.
You can also add images, web links, and even trackable tasks directly on the whiteboard. For instance, you can insert a product roadmap image, link to a project brief, or attach a task for tracking a milestone’s progress.
This helps create a more context-rich timeline, giving teams everything they need in one view without switching between tools.
ClickUp’s Kanban Board simplifies project timelines with features like customizable columns, allowing you to break down project stages such as Scoping, In Progress, or Pending Review.
You can also set WIP limits to control task loads. Subgroups (or swimlanes) categorize tasks by teams or priorities, helping to visualize workflows better.

Additionally, assign tasks, comment, and attach files on the Kanban board for real-time collaboration. This keeps team members informed on project progress.
The best part? ClickUp’s Kanban Board adapts to changing project needs, letting you quickly adjust or rearrange tasks to meet new challenges and priorities.
With ClickUp Table View, you can easily organize all project tasks in a single, intuitive interface. Create Custom Fields to track key dates and task progress, ensuring your timeline is clear and easy to manage.
It also clearly shows task dependencies, like needing ‘Complete Research’ before ‘Write Content.’ Editing tasks in bulk is a breeze with ClickUp’s Table View—if your timeline changes, adjust them all at once to stay on track.
ClickUp has helped me to stay on the ball as a Project Manager, allowing me to accurately track and flip back and forth between projects, and various tasks and accurately keep a record of things like decisions, risks, and timelines all in one place.
Leverage the multiple benefits of ClickUp Brain, ClickUp’s built-in AI assistant, to take your project timeline to the next level.

Whether you want to learn how to use the above templates and features or know the best way to communicate your project timeline to your stakeholders, just add the prompt and let ClickUp Brain take the load off your brain.

While Microsoft Excel offers versatility for creating timelines, it has significant limitations—manual updates can be labor-intensive, collaboration is often cumbersome, and managing task dependencies requires constant oversight.
ClickUp addresses these challenges by providing intuitive features that streamline project timeline management.
Use features like The Gantt Chart and Timeline View to automatically adjust tasks, providing instant visibility of critical paths and deadlines, and zoom in on individual days or zoom out for a broader perspective. 🔍
Ready to simplify project timelines? Sign up for ClickUp today.

Praburam Srinivasan
Max 21min read
Praburam Srinivasan
Max 11min read

Arya Dinesh
Max 11min read

© 2026 ClickUp