


Still downloading templates?
There’s an easier way. Try a free AI Agent in ClickUp that actually does the work for you—set up in minutes, save hours every week.
Sorry, there were no results found for “”
Sorry, there were no results found for “”
Sorry, there were no results found for “”
In today’s fast-paced world, delivering real-time visibility to clients isn’t just a nice-to-have — it’s a necessity.
For agencies, freelancers, and client-facing teams, this creates both a challenge and an opportunity. You need to surface the full picture—from sales metrics and project progress to campaign performance— without overwhelming your clients.
That’s where purpose-built client reporting dashboards and dashboard templates come in. By aggregating multiple data sources into a single unified view, client dashboard templates provide a centralized location to track key metrics, streamline communication, and foster trust.
Let’s explore some free and customizable ClickUp templates for client reporting.
Here’s a quick look at the best free client dashboard and reporting templates:
| Template Name | Download Template | Ideal For | Best Features | Visual Format |
| ClickUp Project Management Dashboard Template | Get free template | Project managers, team leads | Gantt view, progress bars, capacity planning, real-time risk tracking | ClickUp Dashboard/Gantt/Widgets |
| ClickUp Analytics Report Template | Get free template | Agencies, freelancers, analysts | Monthly narrative, ready-made sections, visual summaries | ClickUp Doc/Dashboard |
| ClickUp Digital Marketing Report Template | Get free template | Marketing teams, agencies | Editable blocks, campaign KPIs, visual placeholders, branding | ClickUp Doc/Dashboard |
| ClickUp Marketing Report Template | Get free template | Marketing managers, analysts | Campaign analytics, web/social metrics, lead tracking | ClickUp Doc/Dashboard |
| ClickUp Project Report Template | Get free template | Project managers, team leads | Status markers, highlights, risk logging, upcoming work | ClickUp Doc/Dashboard |
| ClickUp Sales Report Template | Get free template | Sales managers, revenue ops | Cross-channel KPIs, Custom Fields, and real-time dashboards | ClickUp Board/Dashboard |
| ClickUp Weekly Status Report Template | Get free template | Project managers, client teams | Weekly breakdown, accomplishments, task links | ClickUp Doc/List |
| ClickUp Multiple Projects Status Report Template | Get free template | PMOs, portfolio managers | Portfolio health, dependencies, cost/budget tracking | ClickUp Dashboard/Table |
| ClickUp Monthly Business Status Report Template | Get free template | Ops leaders, department heads | Assigned actions, highlights, scope checks, and accountability | ClickUp Doc/Dashboard |
| ClickUp Social Media Analytics Template | Get free template | Social media managers, agencies | Cross-channel KPIs, custom fields, and real-time dashboards | ClickUp Dashboard/List/Table |
| ClickUp KPI Template | Get free template | Ops, marketing, sales, HR, PMO | Baseline/target/actual, automations, goal linking | ClickUp List/Board/Timeline |
| ClickUp Company OKRs and Goals Template | Get free template | PMO, ops leaders | OKR intake forms, approval workflow, progress tracking | ClickUp List/Board/Calendar |
| ClickUp SMART Goal Action Plan Template | Get free template | Managers, founders | SMART stages, milestones, calendar, completion tracking | ClickUp List/Calendar/Dashboard |
Client dashboard templates are pre-built and customizable layouts that display key client data—such as financial performance, cash flow, sales performance, and project metrics—in a single, organized view.
They pull information from multiple data sources and structure it into charts, tables, and KPIs so teams can quickly create client reporting dashboards without starting from scratch. This way, one gets actionable insights to make data-driven decisions that directly improve ROI.
Client dashboard templates are particularly helpful for agencies, freelancers, and businesses that need to manage multiple client accounts and organize data in one centralized location.
💡 Also Read: Best Data Visualization Tools for Projects
A client dashboard template must be flexible enough to support various reporting methods, allowing stakeholders to understand what they’re looking at without needing explanations.
Look for templates that let you:
Client management shouldn’t feel like detective work. When project details are scattered across multiple platforms and tools, you waste time hunting for information instead of actually delivering value. This is often called Work Sprawl.
ClickUp solves this as the world’s first Converged AI Workspace.
ClickUp Dashboards bring everything together—project timelines, deliverables, budgets, and progress metrics—into one view that updates in real-time. This is how ClickUp also doubles up as an excellent CRM Software.
It eliminates all forms of Work Sprawl to provide 100% context and a single place for humans and agents to work together.
ClickUp also offers a range of customizable dashboard templates that are easy to integrate into your weekly or monthly reporting process. Let’s explore them together.
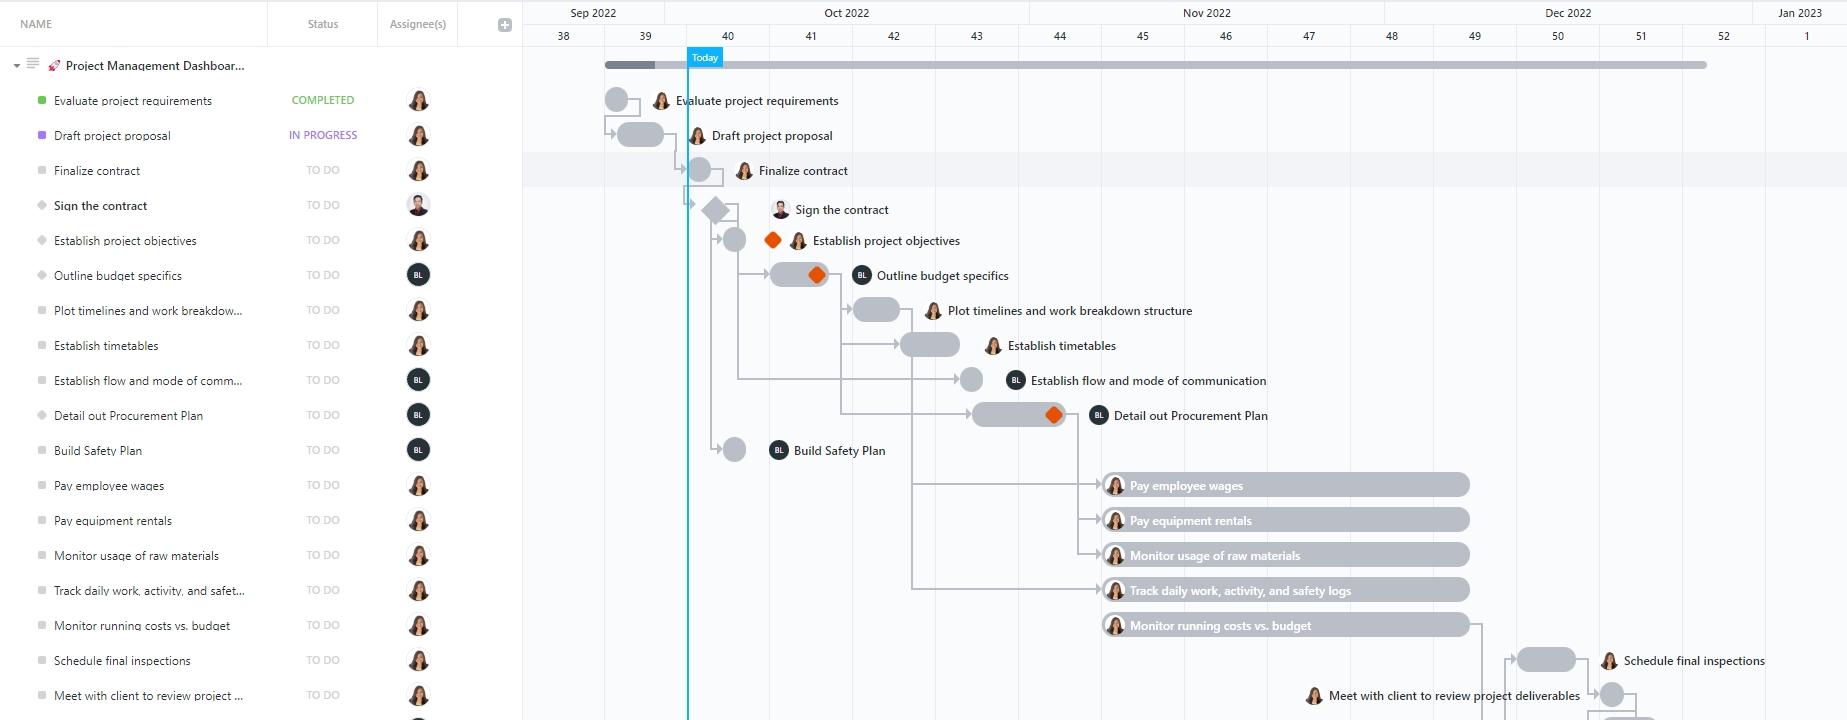
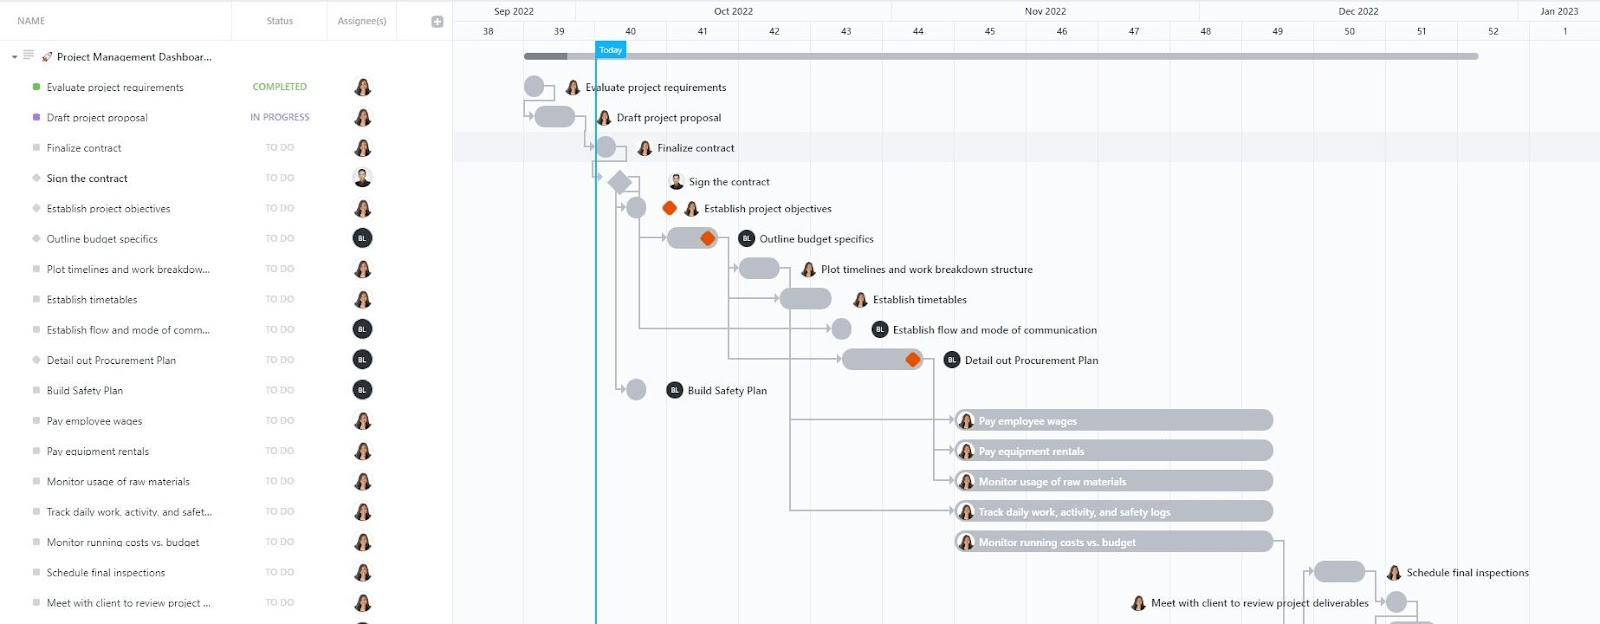
The ClickUp Project Management Dashboard Template allows project managers and teams to visualize and execute project tasks with complete visibility of timelines, costs, and risks.
Dashboards in ClickUp automatically fetch details from your project spaces and lists, providing you with insights into everything from progress to performance.
With a variety of widgets, you can customize your dashboard the way you want: progress bars for completion rates, line charts for trends, pie charts for individual contribution, workload widgets for resource allocation, and more.
Here’s why you’ll love this template:
📌 Ideal for: Project managers and team leads in construction, IT, marketing, or operations who need a dashboard software to monitor costs, dependencies, and team capacity
📮 ClickUp Insight: 31% of managers prefer visual boards. Others lean on Gantt charts, dashboards, or resource views. But most tools force you to pick one. If the view doesn’t match the way you think, it just becomes another layer of friction.
With ClickUp, you don’t have to choose. Switch between AI-powered Gantt charts, Kanban Boards, Dashboards, or Workload View in a single click. And with ClickUp AI, you can auto-generate tailored views or summaries based on who’s looking—whether it’s you, an exec, or your designer.
💫 Real Results: CEMEX sped up product launches by 15% and cut communication delays from 24 hours to seconds using ClickUp.
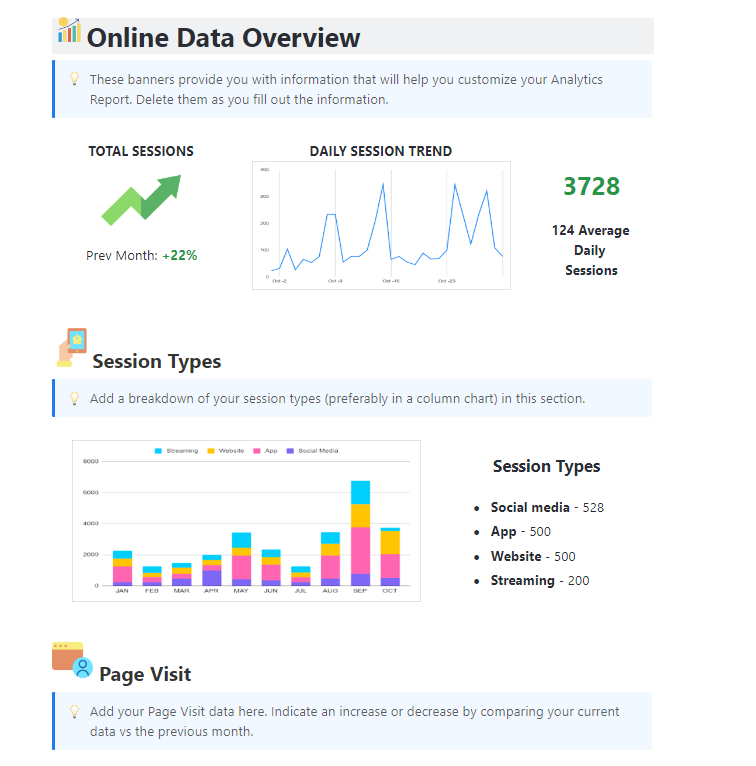
The ClickUp Analytics Report Template gives a clear roadmap for structuring client reporting dashboards. Instead of starting with a blank page, you get pre-built sections for a data overview depending on the metrics you want to report.
For instance, you can create a client portal to demonstrate website efficiency by highlighting session types, page visits, conversions, transactions, and other KPIs. You can insert numbers, upload various chart types, or relevant images to display the progress or the outcome of strategy execution.
Here’s why you’ll love this template:
📌 Ideal for: Agencies, freelancers, and in-house analysts who want to use a plug-and-play reporting template to visualize essential client information
💡 Pro Tip: Pair the Analytics Report Template with a KPI dashboard template to align your reporting with measurable business goals.
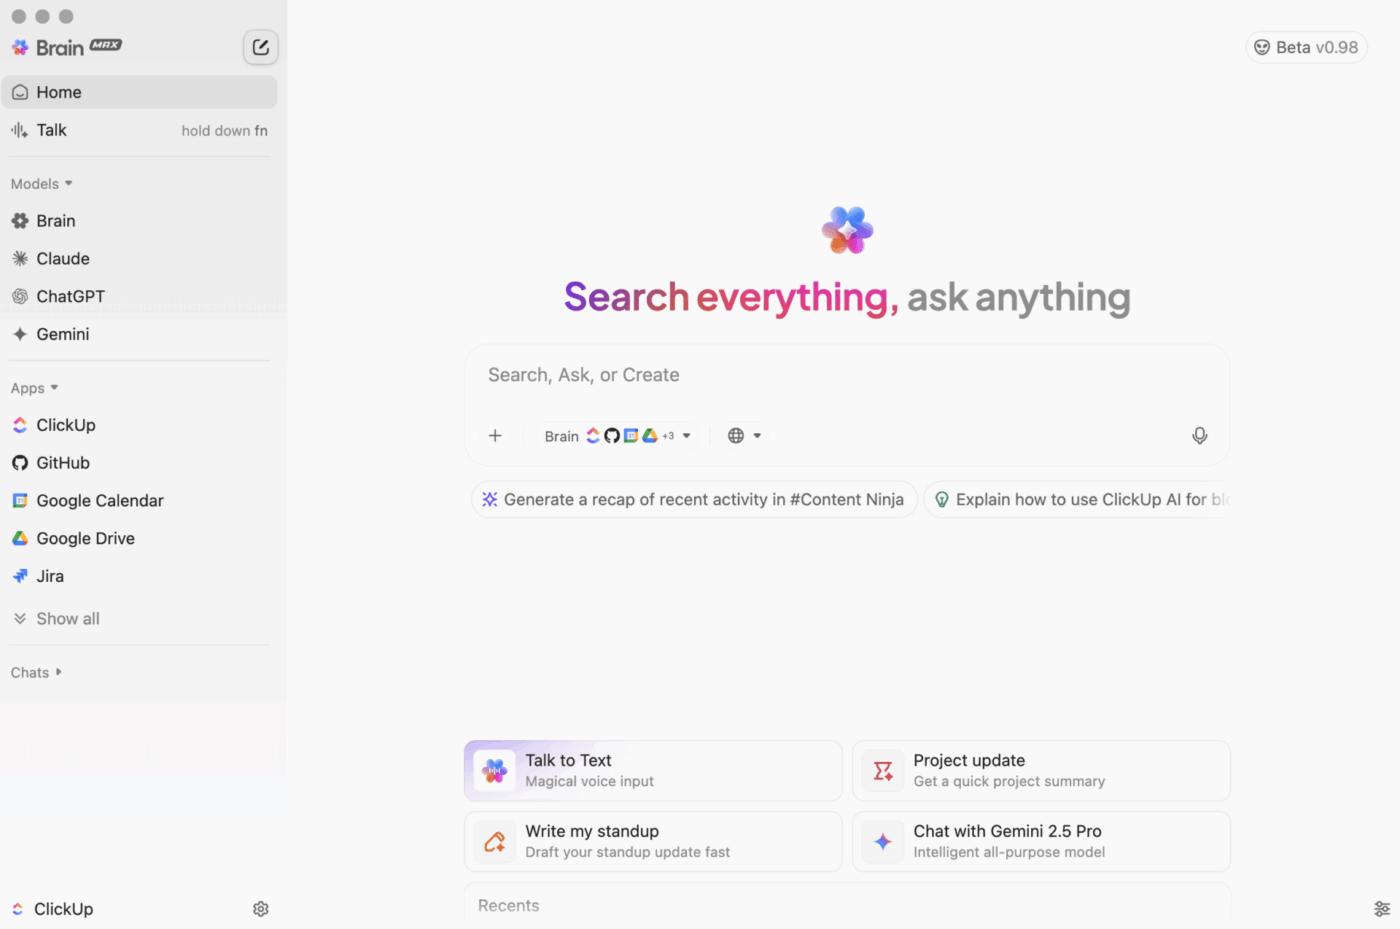
🧠 Quick Hack: Want to stay ahead of project delays without digging through different views?
With ClickUp Brain MAX, you can ask questions like, “What tasks are running over budget this week?” or “Who’s overloaded on the Phoenix rollout project?” and get instant, AI-generated answers pulled from your entire workspace and connected apps.
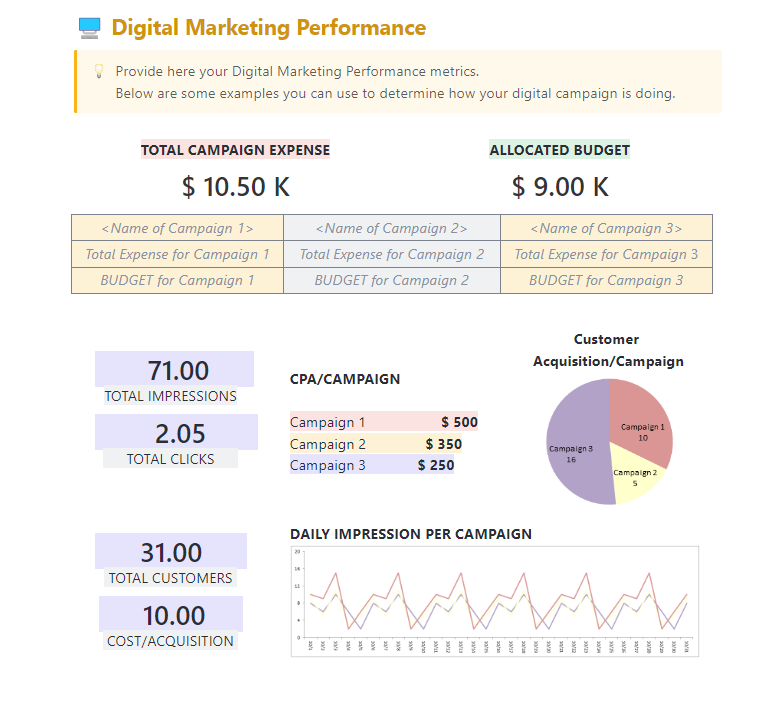
The ClickUp Digital Marketing Report Template provides marketing teams with a ready-to-use reporting format to track campaigns, performance, and ROI.
It also provides a high level of customization to organize campaign goals, key metrics, and more into a single, clean, and visually appealing document. Each block is editable, allowing you to add Campaign Details, upload visuals, highlight key metrics, and provide contact information.
Here’s why you’ll love this template
📌 Ideal for: Agencies, freelancers, and in-house analysts who want to use a plug-and-play reporting template to visualize essential client information
⏱️ Time-saving tips:
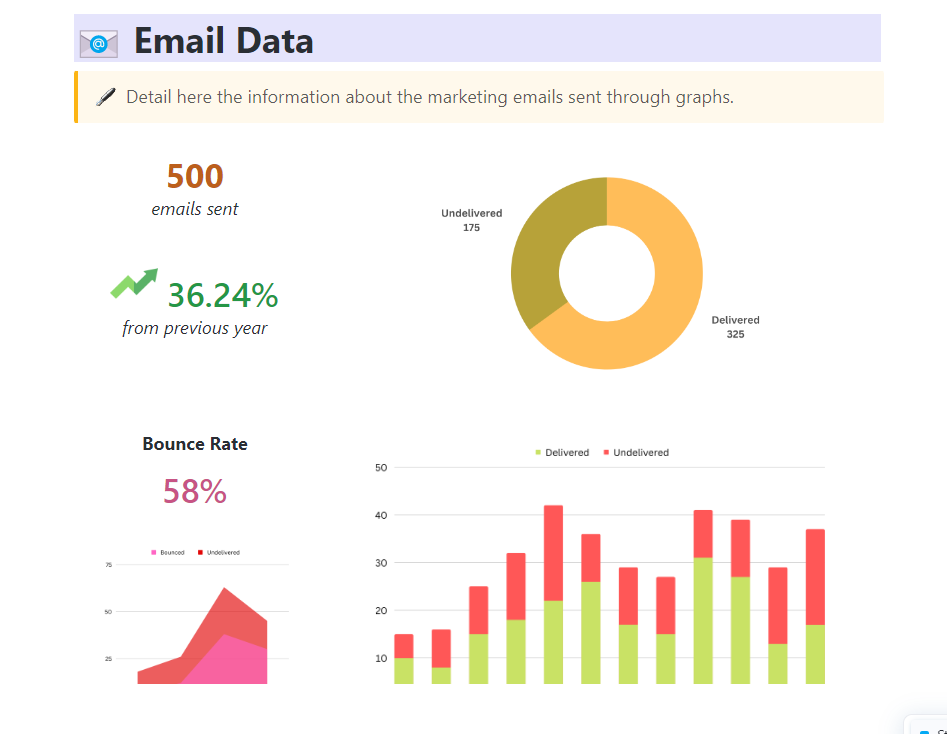
For marketing teams, the ClickUp Marketing Report Template helps consolidate campaign analytics, website and social media performance, and customer insights. This template has dedicated sections for campaigns, email data, web traffic, and customer conversions. You can add visuals and notes while keeping key metrics in plain sight for stakeholders to read.
Here’s why you’ll love this template:
📌 Ideal for: Marketing managers and analysts who need a structured template to present campaign results, performance metrics, and growth opportunities without spending time formatting reports
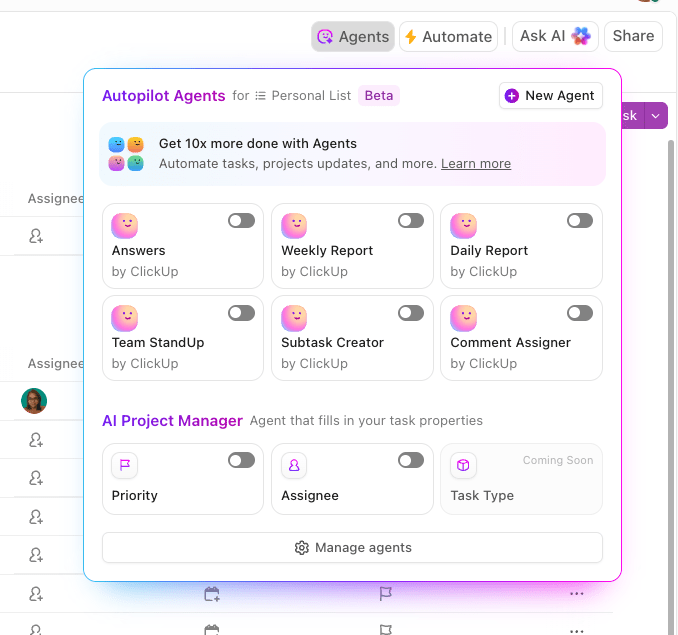
⚡Friendly Tip: Use ClickUp AI agents to instantly surface data for dashboards from your workspace, like project updates, campaign performance, chat summaries, task blockers, and more.
These intelligent agents can help you decide which metrics your client dashboard needs (tasks complete, upcoming deadlines, blocked tasks, budget vs. time spent, etc.) based on the insights you need.
Since they operate on triggers, conditions, actions, and knowledge bases, they can post updates at specified intervals and answer queries about your data.
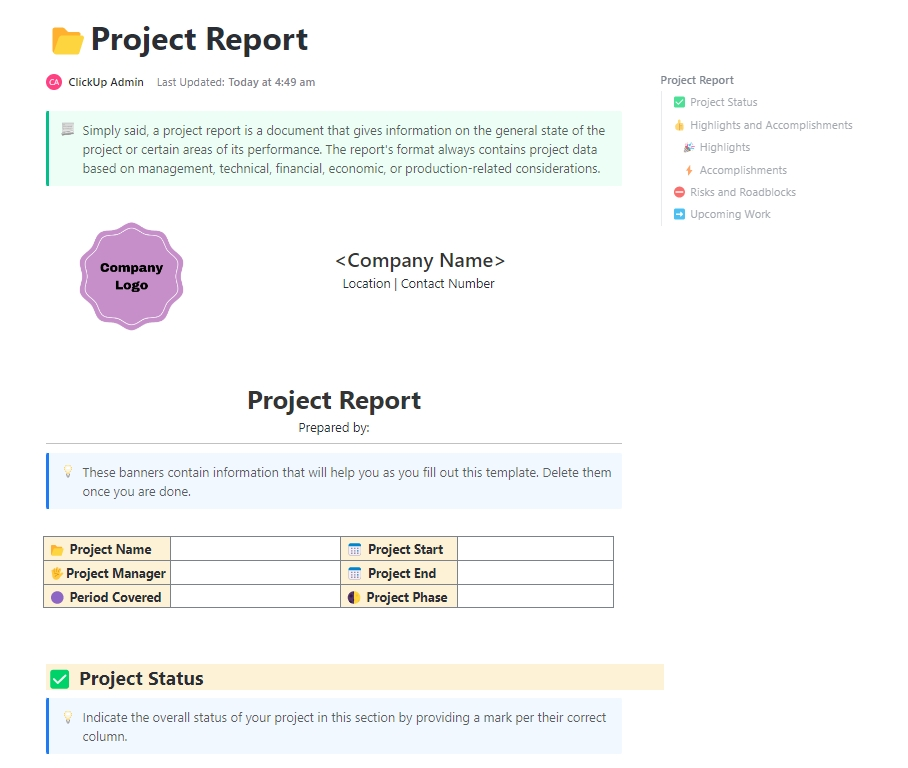
When you want to capture the overall health of their projects in one structured, easy-to-share document, try the ClickUp Project Report Template. It has sections for project details, status, highlights, risks, and upcoming work, which makes it easier to communicate progress without missing key details.
Here’s why you’ll love this template
📌 Ideal for: Project managers and team leads who need to present project updates clearly to leadership, clients, or cross-functional stakeholders without spending hours formatting reports
⚡ Template Archive: Client Management Templates in PowerPoint & ClickUp
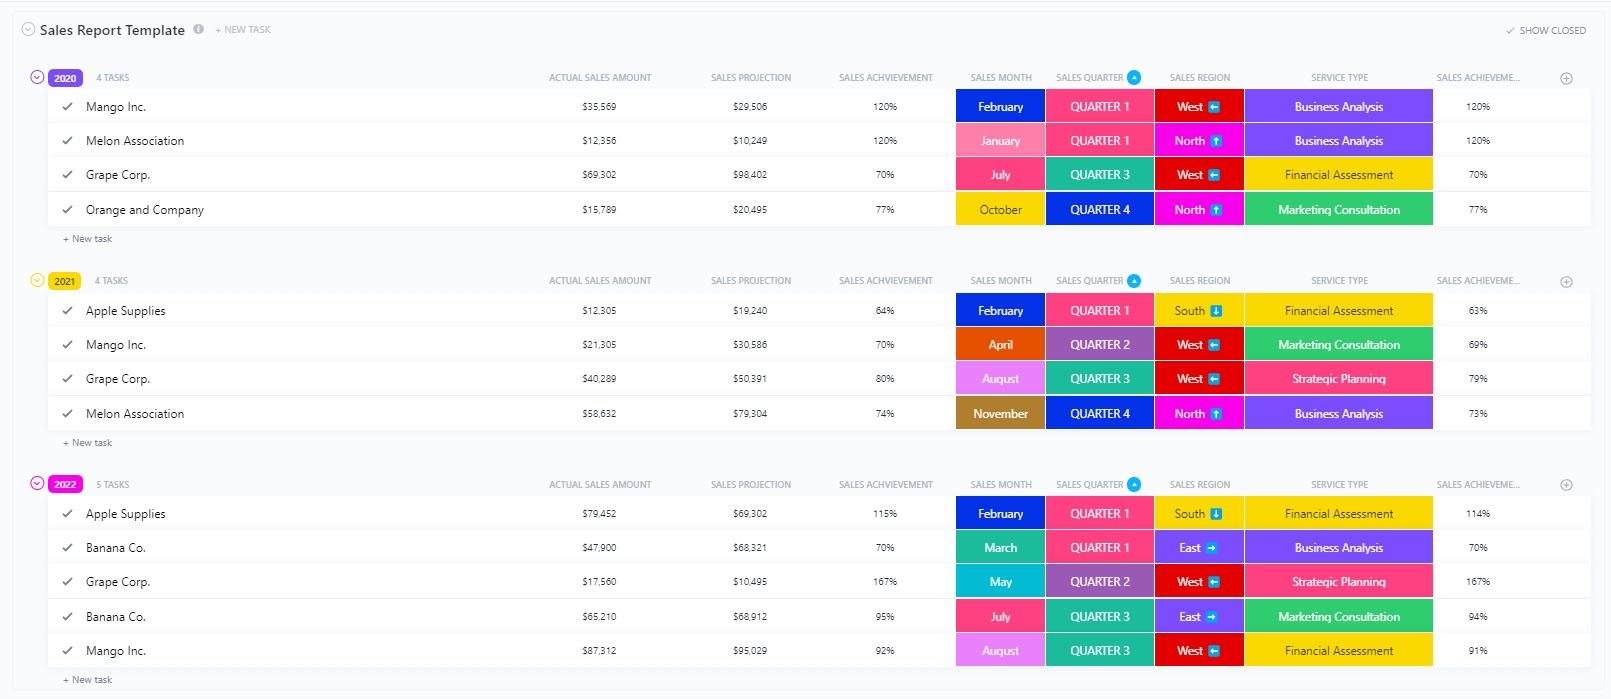
The ClickUp Sales Report Template helps sales managers and teams track real-time updates and performance across months, quarters, and years in a structured view.
With built-in views like Annual, Monthly, and Quarterly Reports, plus Board view and AI cards, you get to switch between macro-level insights and even specific breakdowns. Moreover, Custom Fields such as Actual Sales Amount, Sales Projection, Sales Achievement, and Region make it easy to filter and compare performance trends.
Here’s why you’ll love this template:
📌 Ideal for: Sales managers, regional leads, and revenue ops teams who need an at-a-glance system to monitor sales targets, track performance trends, and report across different timeframes
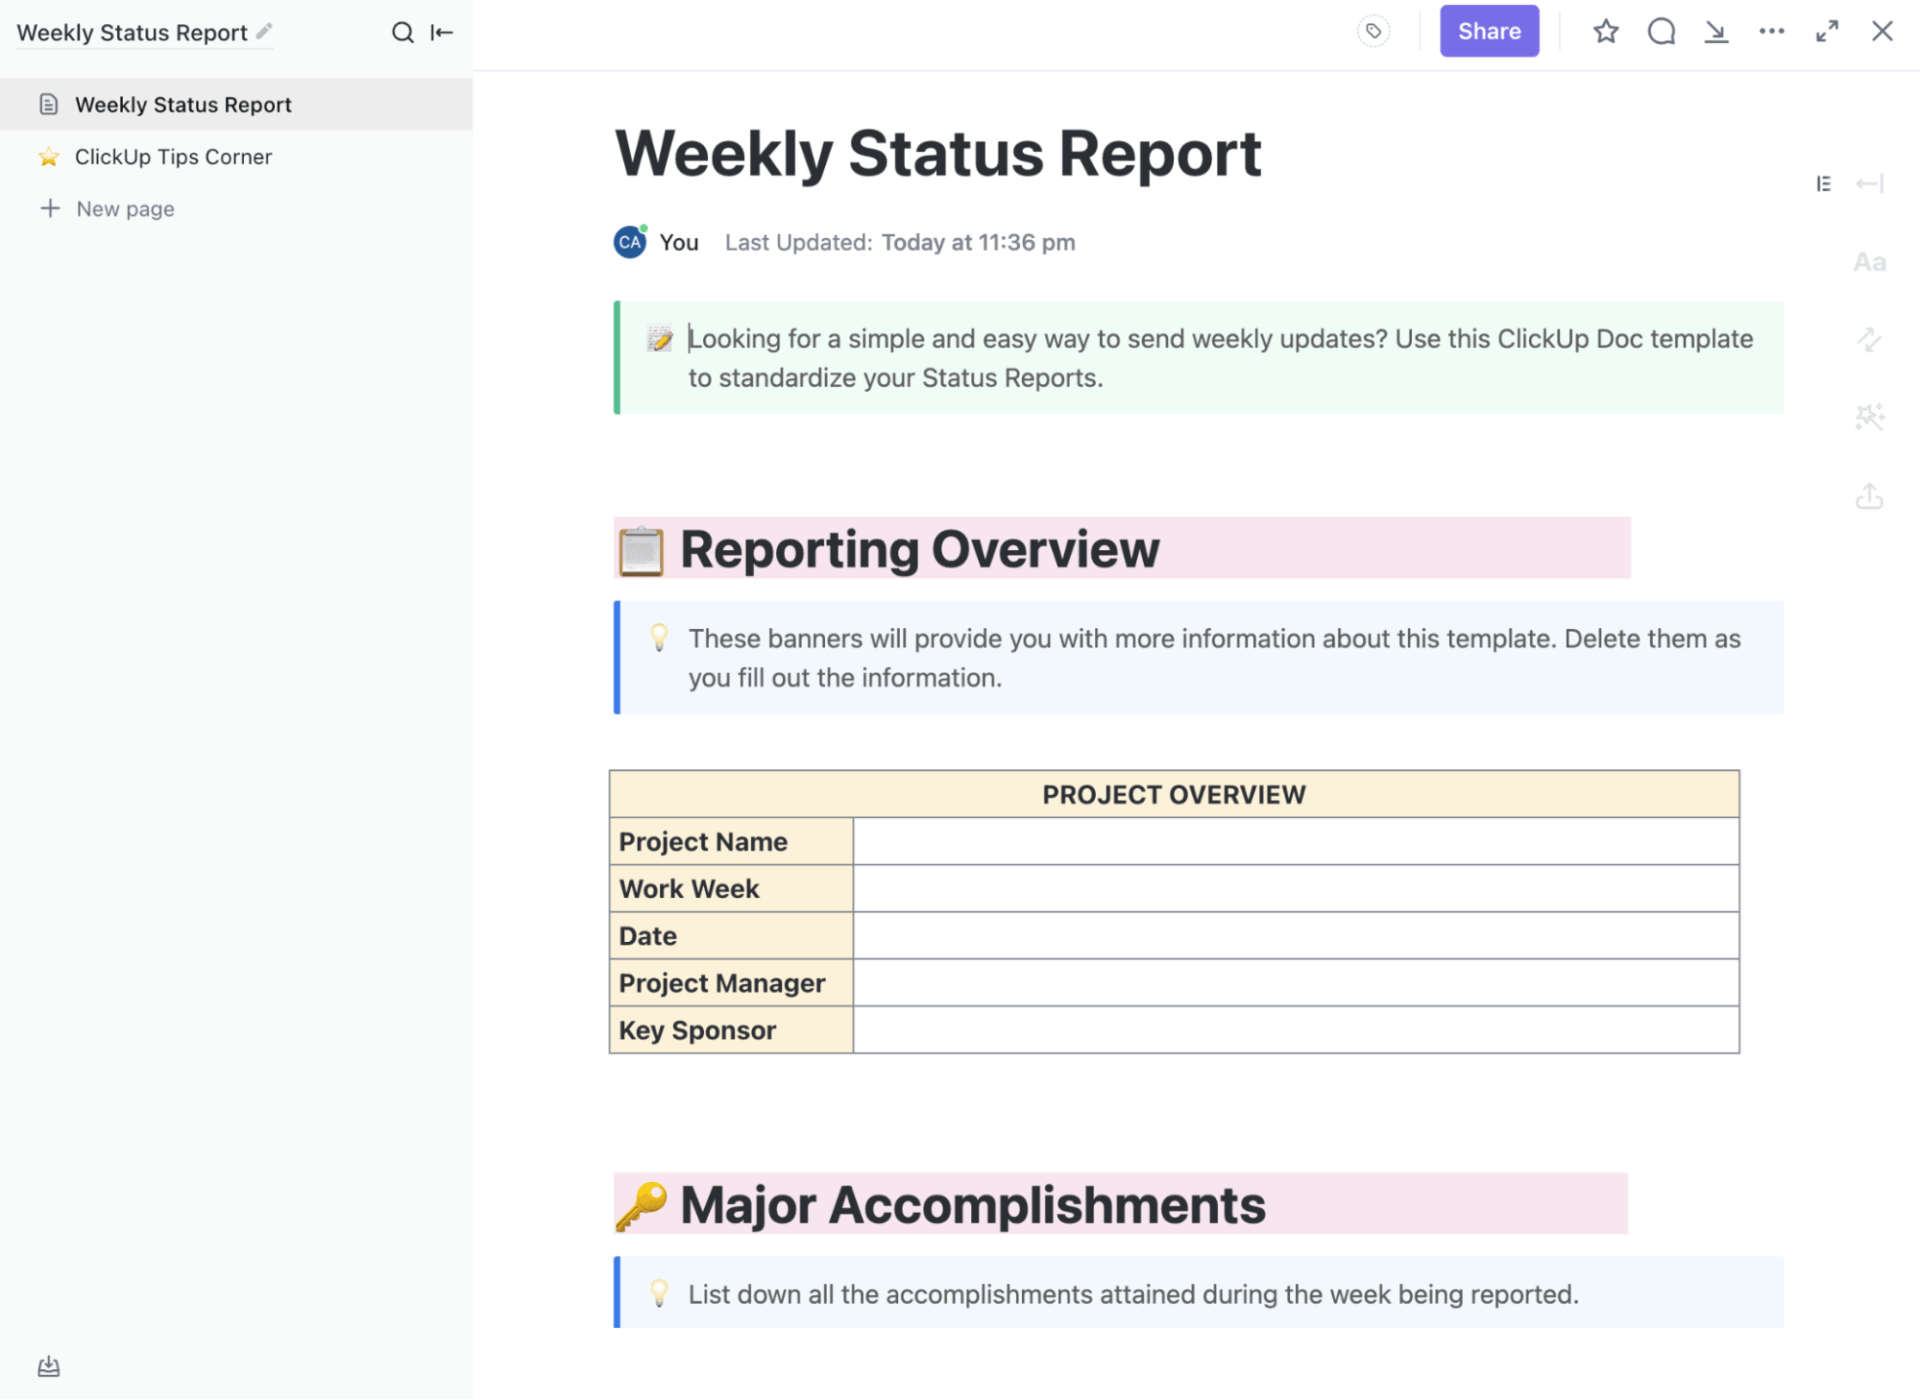
The ClickUp Weekly Status Report Template provides teams a reliable way to communicate progress, highlight wins, and flag what needs attention under a single hood. It brings together key updates — from tasks completed and upcoming milestones to blockers and risk areas—in one structured report. Thus, clients receive a straightforward snapshot of project health without additional explanations.
Here’s why you’ll like this template:
📌 Ideal for: Project managers, client-facing teams, and cross-functional squads that need a consistent weekly update for executives, sponsors, and clients
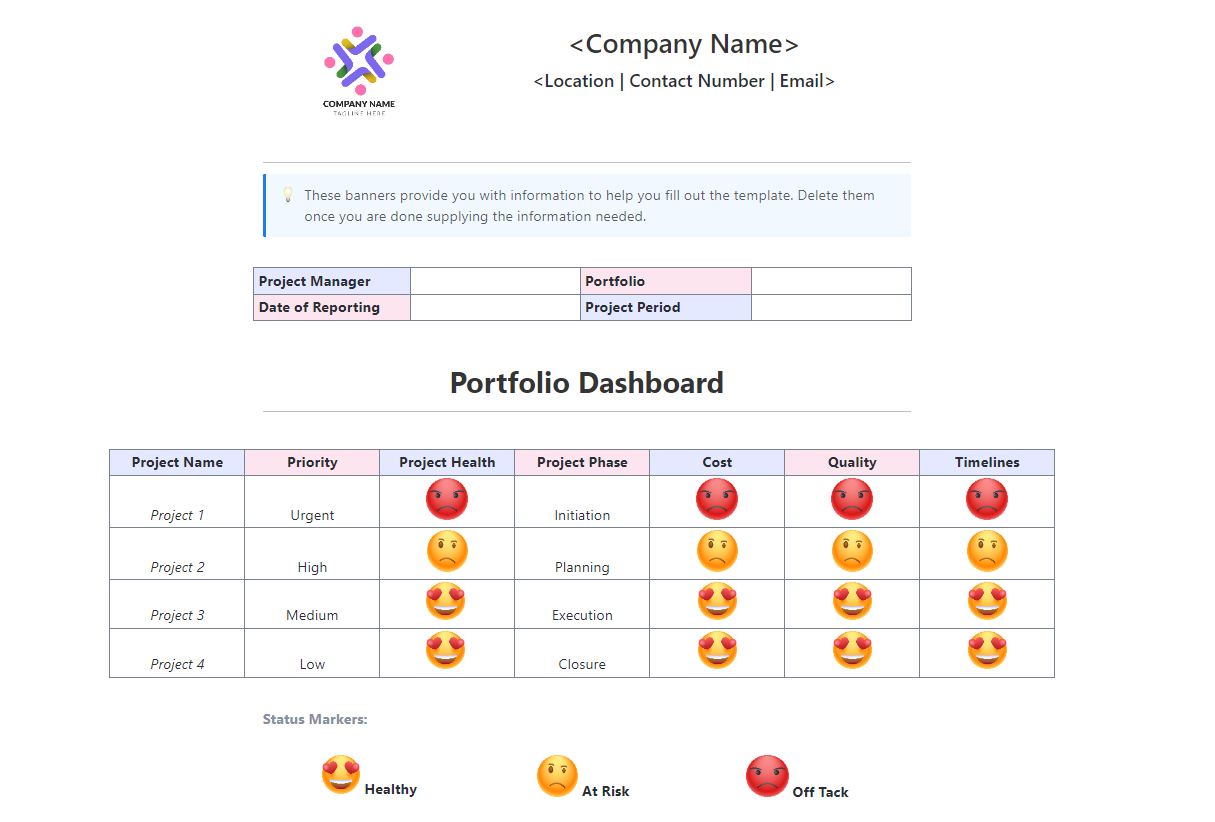
The ClickUp Multiple Projects Status Report Template is ideal for giving managers a portfolio-wide view of ongoing projects in one place. You can navigate multiple projects within a single project portfolio dashboard and obtain a detailed breakdown of deliverables, risks, costs, and quality metrics for each.
There are status markers in terms of Project Health (status: Healthy, At Risk, Off Track), so your team knows where things are headed.
Here’s why you’ll like this template:
📌 Ideal for: PMOs, program/portfolio managers, agency or delivery leads, and operations teams overseeing multiple projects with a need for executive-ready timelines
📚 Read More: Project Management Dashboard Examples & Templates
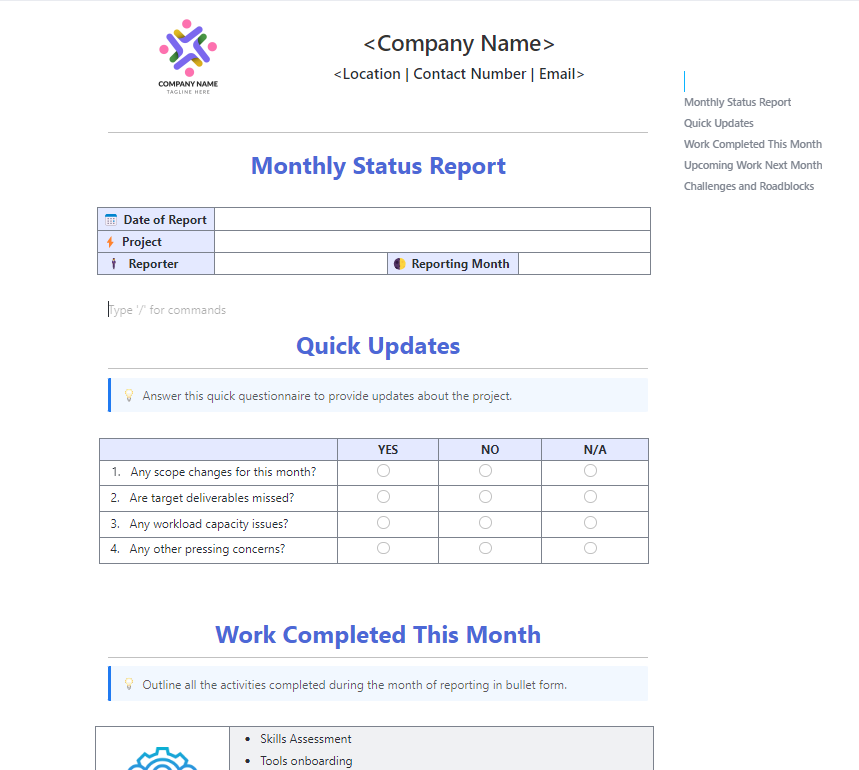
Looking for a starting point for high-level reporting? The ClickUp Monthly Business Status Report Template enables managers and teams to review progress on projects, financials, KPIs, and goals. You’ll find ready-to-edit blocks for quick updates, work completed, upcoming tasks, and challenges.
Customize the template to include the specific metrics and categories you want, such as total deliverables, billable hours, carryover tasks, and risk items.
Here’s why you’ll like this template:
📌 Ideal for: Ops leaders, department heads, and project leads who need a concise, repeatable monthly update dashboard for executives and cross-functional stakeholders
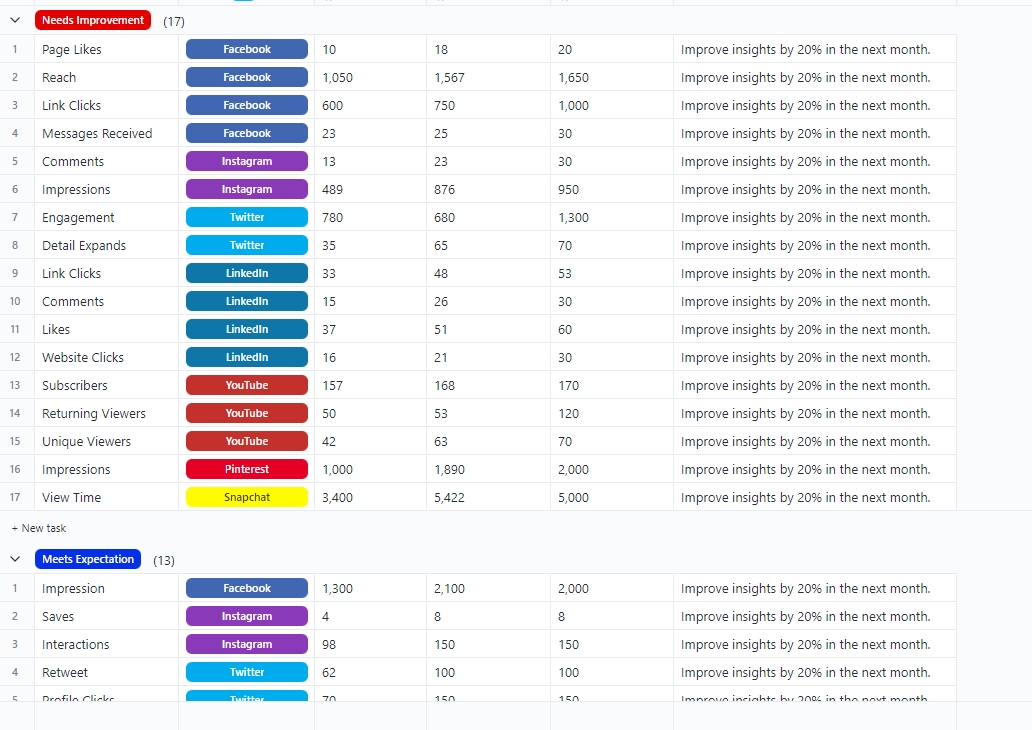
The ClickUp Social Media Analytics Template provides an exhaustive overview for social media teams to measure KPIs across all social media channels like Facebook, Instagram, Twitter, LinkedIn, YouTube, Pinterest, and Snapchat.
It can be transformed into a fully functional operations dashboard with Custom Fields for Benchmarks, Target Results, and Actuals, allowing you to see where campaigns are outperforming or falling short.
Here’s why you’ll like this template:
📌 Ideal for: Social media managers and in-house marketing teams, and agencies looking for multi-platform reporting with real-time KPIs and clear ownership
Here’s a step-by-step tutorial on creating a dashboard in under 15 minutes!
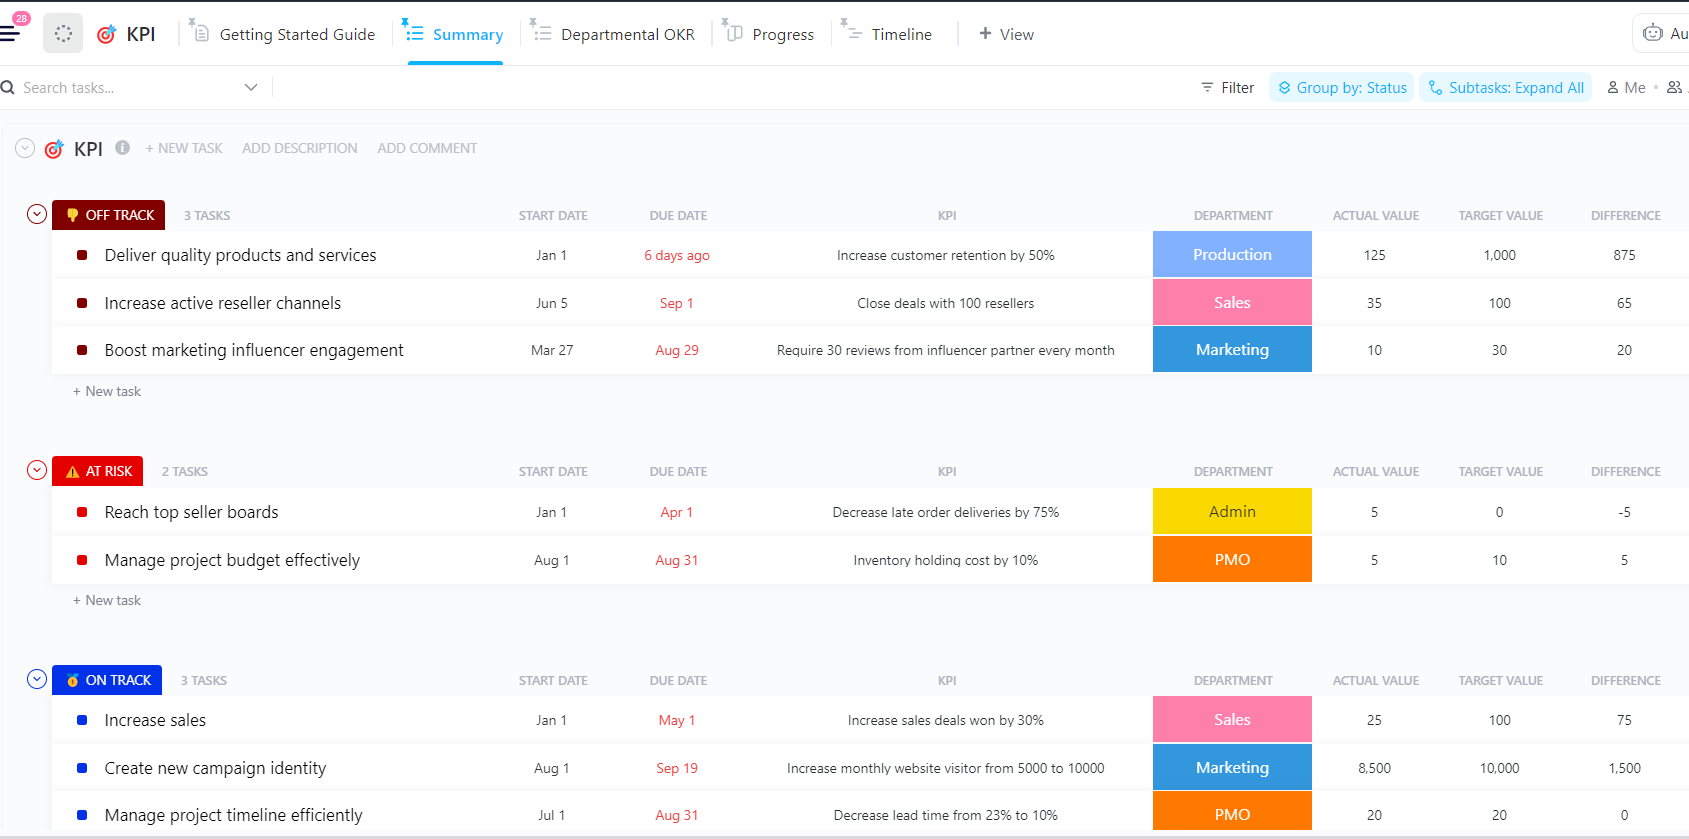
With the ClickUp KPI Template, it’s easy to track targets, baselines, and actuals in one place so you can measure KPIs in real time.
Use the Summary list to view the status across all KPIs, or switch to Departmental OKR to review KPI achievements by team. There’s also the Progress board stand-ups and the Timeline view that let you group by Status, Assignee, or Department. It’s a great way to spot ownership gaps and date clashes.
Here’s why you’ll like this template:
📌 Ideal for: Ops, marketing, sales, HR, and PMO leaders who need a practical KPI dashboard their teams will actually use
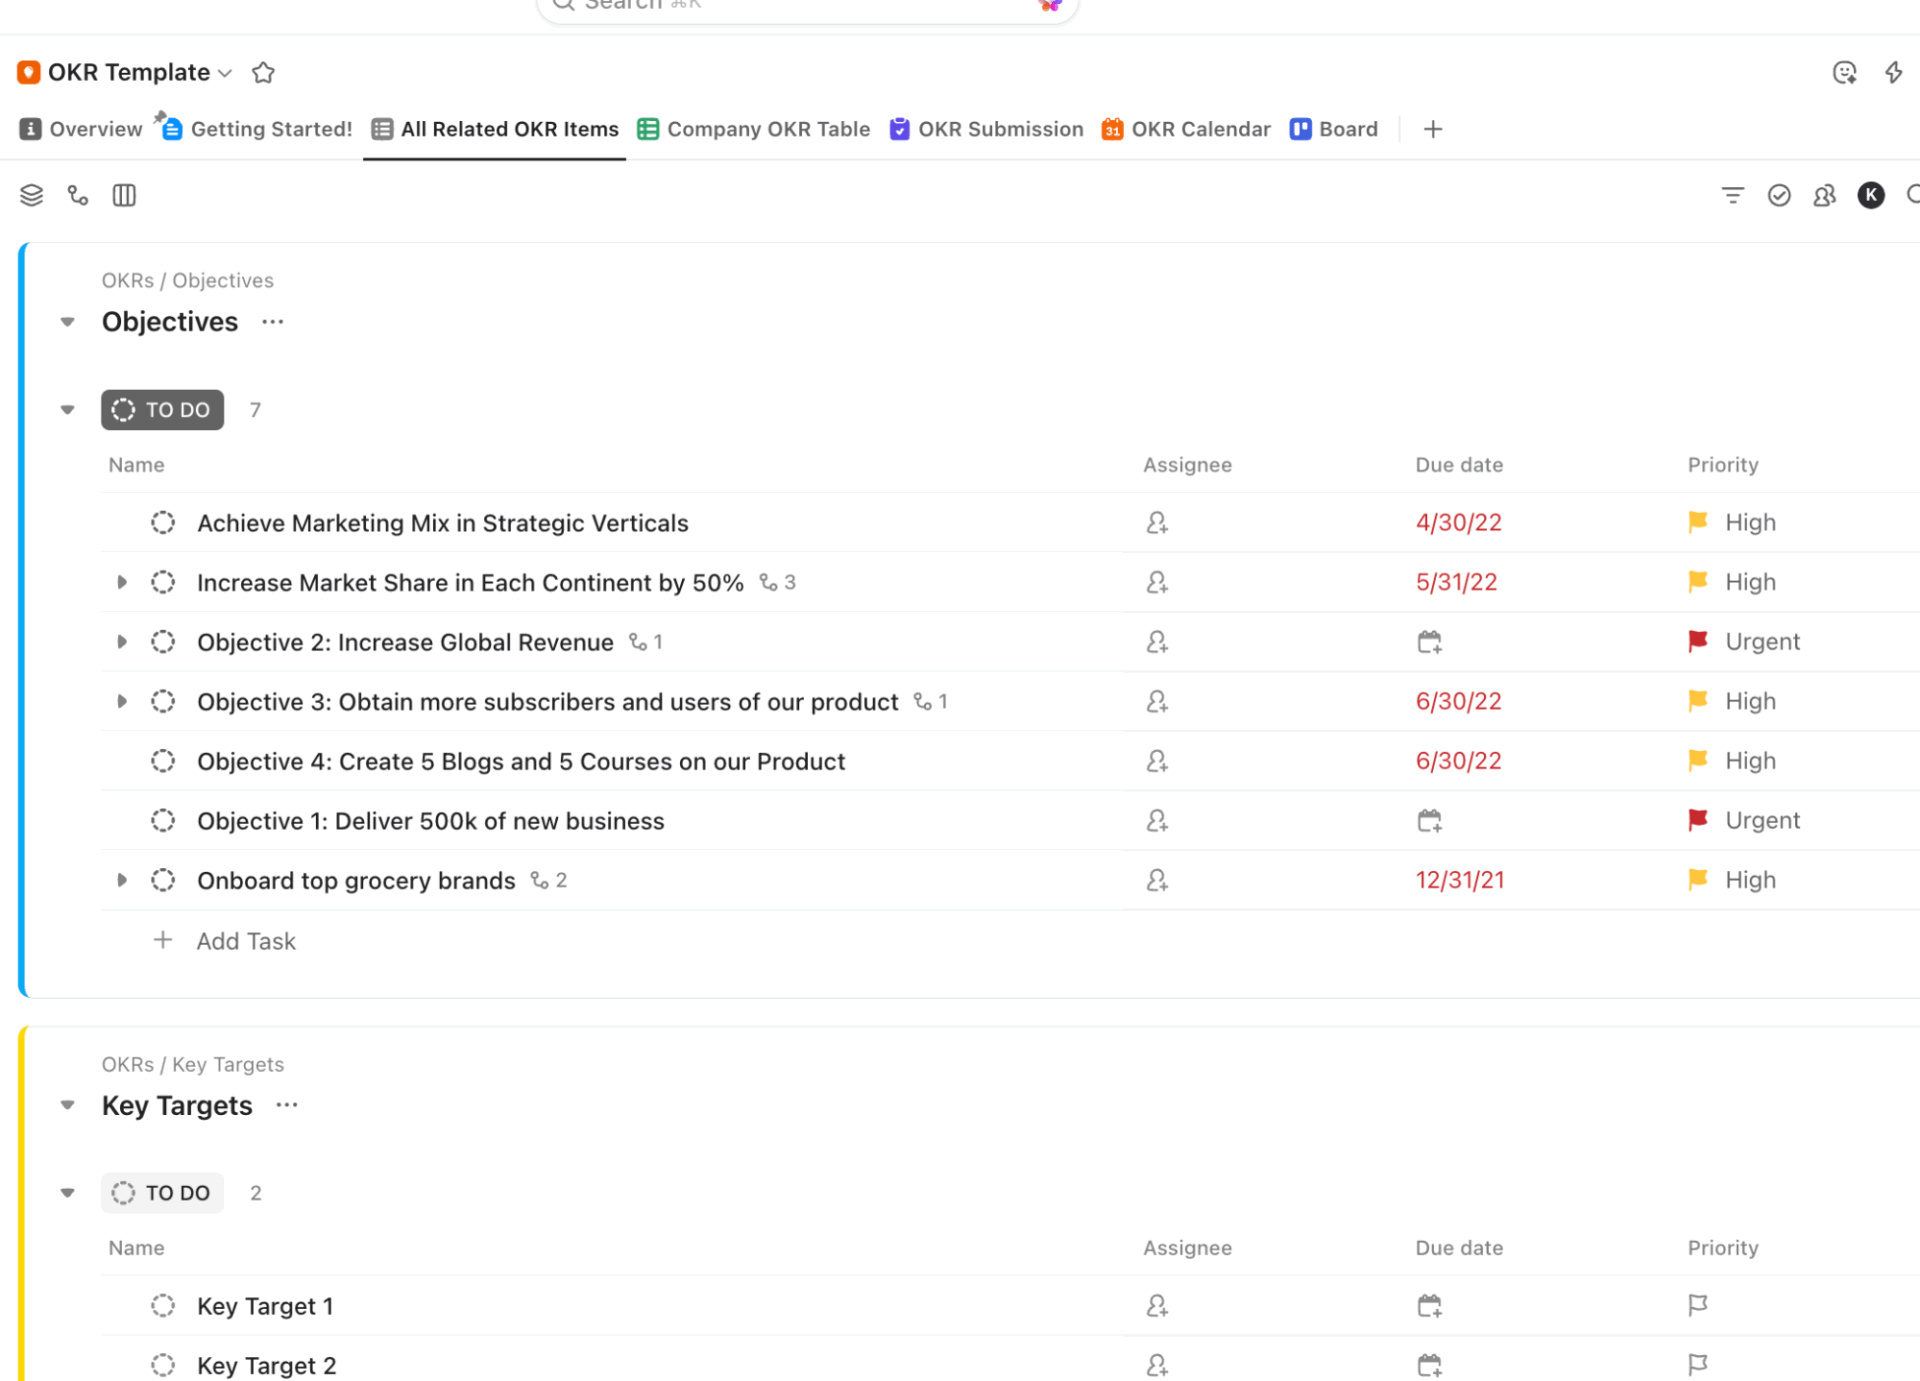
The ClickUp Company OKRs and Goals Template is what you need to manage end-to-end OKR workflows. Use the OKR Submission form (Build → Settings → Preview) to capture requestor, sponsor, baseline, and target, then auto-create OKR tasks in your Objectives list with fields mapped and owners set.
Use All Related OKR Items to review and approve proposals in one table, slot check-ins on the OKR Calendar, and track progress in List/Board views with status and priority.
Here’s why you’ll like this template:
📌 Ideal For: PMO/operations leaders rolling out company-wide OKRs who need intake → approval → scheduling → tracking in one system
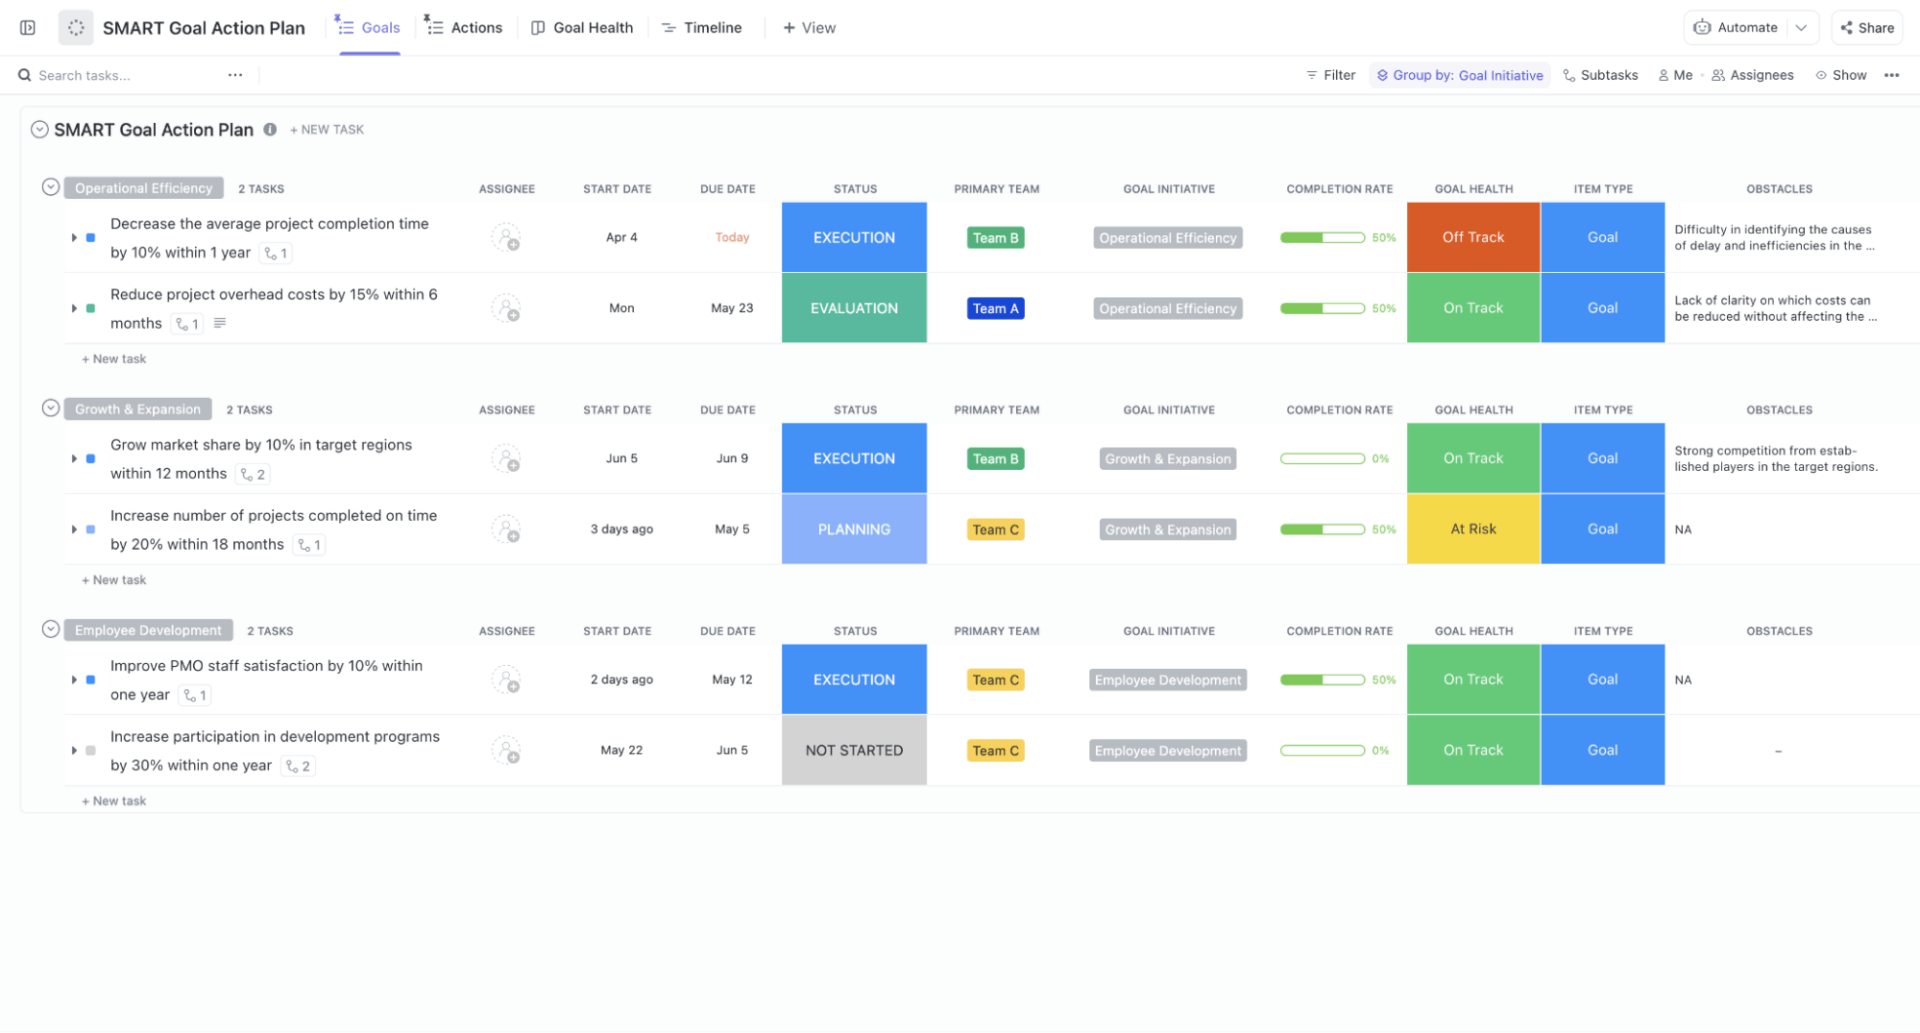
For teams that need a work dashboard for SMART goals they can actually ship, the ClickUp SMART Goal Action Plan Template comes to the rescue.
Use this template to track progress with Custom Fields like ‘Completion Rate’ and ‘Goal Health’, log obstacles, and flip key objectives into ClickUp Milestones. Additionally, consider adding a Calendar to schedule checkpoints or a Dashboard to visualize trends, so that the action plan remains visible without requiring manual checks with each team member.
Here’s why you’ll like this template:
📌 Ideal For: Managers and founders who need a simple, SMART-aligned system to turn goals into trackable execution
Static reports are a thing of the past. What clients really need is a real-time insights hub where performance data, progress updates, risk analysis, and business outcomes stay continuously (and automatically) up to date.
With ClickUp’s Dashboards, Automations, customizable templates, and AI-powered Agents, you can pull in live data from across projects and visualize it with dynamic charts and interactive widgets.
Want to empower your team and your clients with instant visibility and smarter decisions?
Get ClickUp for free and build your first client dashboard today.

© 2026 ClickUp

There’s an easier way. Try a free AI Agent in ClickUp that actually does the work for you—set up in minutes, save hours every week.