


Still downloading templates?
There’s an easier way. Try a free AI Agent in ClickUp that actually does the work for you—set up in minutes, save hours every week.
Sorry, there were no results found for “”
Sorry, there were no results found for “”
Sorry, there were no results found for “”


In the mid-20th century, Toyota was a small Japanese automaker struggling to compete with industry giants like Ford and General Motors. To improve its processes and products, Toyota began benchmarking against its competitors.
Toyota sent engineers to visit Ford’s production plants in the United States. They observed and documented Ford’s assembly line processes and quality control measures. Then, they improved those processes to create the Toyota Production System and became a leader in the manufacturing business, arguably exceeding the companies they learned from.
That’s how powerful benchmarking is. When you compare your efforts with those of industry leaders and apply their practices, you set yourself up for success.
This blog discusses different benchmarking examples and how you can implement them in your organization. Because when you benchmark yourself against the best, the sky’s the limit! 🚀
Benchmarking compares your organization’s processes, performance, financial metrics, and practices against those of industry leaders or other companies. The aim is to identify areas for improvement and enhance performance.
Benchmarking analysis is crucial because it helps you understand your competitive position, adopt best practices, and drive continuous improvement. When you compare yourself with top competitors and industry leaders, you use them as a reference point to assess your own business operations and results.
Once you do, it’s almost inevitable that you’ll find gaps in your performance and processes. You can then take concrete steps and create strategies to fill those gaps. By constantly benchmarking, you build a continuous cycle of improvement for your processes and overall business performance.
Performance benchmarking is the most commonly used benchmarking technique. It involves comparing your company’s performance metrics with those of your industry peers and competitors to identify strengths, weaknesses, and opportunities for improvement.
It also helps you understand your market position. Analyzing competitors’ data can provide insights into successful strategies and operational efficiencies.
Example: A retail company can compare its sales growth, customer satisfaction scores, and inventory turnover rates with those of leading competitors to identify areas for improvement in its operations and customer service. Thus, performance benchmarking involves an element of financial benchmarking as well.
For effective benchmarking, you need access to various performance data such as:
For an in-depth assessment of sales in your organization, you can also track sales KPIs like sales targets, sales per rep, sales cycle length, and new leads and opportunities.
Process benchmarking involves an internal or external review of your company’s processes and systems.
It helps you identify the best practices leading companies use to achieve superior performance. Then, you can improve your processes accordingly to gain competitive advantages.
Example: A manufacturing company can examine its production process efficiency by comparing its product management KPIs with a leading competitor known for lean manufacturing practices. The company analyzes cycle times, defect rates, and production costs to identify opportunities to streamline its processes.
For effective process benchmarking, you need access to the following management data on your processes:
Strategic benchmarking involves comparing your business strategy with that of industry leaders to identify gaps and learn from their growth and success.
It aligns your strategic goals with the industry’s best practices to help you stay competitive.
Example: A tech startup compares its marketing KPIs and expansion strategies with successful companies like Apple or Google. By analyzing its strategic decisions, the startup identifies areas to refine its strategy, such as product development, marketing approaches, and global expansion plans.
For strategic benchmarking, you need access to the following data:
Functional benchmarking is comparing internal functions and operations with industry standards to identify areas for improvement.
It helps you enhance specific functions by identifying inefficiencies and adopting industry best practices. It can improve performance, save costs, and better utilize resources in key operational areas.
Example: A company’s HR department benchmarks its recruitment process against the industry standard by analyzing the time-to-hire, cost-per-hire, and employee retention rates. This comparison helps the company streamline its recruitment process and adopt best practices.
For functional benchmarking, you need access to the following internal function data:
In internal benchmarking, you compare different groups, teams, and processes within your own business to identify best practices and areas for improvement.
It enables organizations to leverage their internal successes and operations better, promoting consistency and efficiency.
Example: A large retail chain compares the sales performance and customer service metrics across its various store locations. Identifying the top-performing stores will help the chain replicate successful practices across other locations to improve overall performance.
For internal benchmarking, you need access to the following internal function data:
External benchmarking is a general term that means comparing your company’s performance metrics, such as product marketing KPIs, sales revenue, etc., with those of other organizations in a similar niche or vertical to identify areas for improvement and best practices.
It provides a broader perspective on industry standards and helps you to observe and apply innovative practices that your direct competitors may follow.
Example: A healthcare services provider compares its patient satisfaction scores, treatment outcomes, and operational costs with those of leading regional hospitals. This comparison helps identify gaps and implement best practices to enhance patient care outcomes and operational efficiency.
For effective external benchmarking, you need access to the following data and reports:
Competitive benchmarking involves comparing different groups, teams, and processes within your organization to your competitors to identify strengths, weaknesses, and opportunities for improvement.
By analyzing competitors’ strategies and performance, companies can adopt best practices, close performance gaps, and enhance their market standing.
Example: An e-commerce company compares its brand awareness KPIs, such as followers, social shares, and brand mentions, with those of a leading competitor to find gaps and differences. After comparing more such marketing productivity metrics, the company launches better awareness campaigns to get in front of its target audience.
For effective competitive benchmarking, you need access to the following data and reports:
Best-in-class benchmarking, as the name suggests, compares different groups, teams, and processes within your organization against those considered ‘best-in-class’ at a specific function, regardless of their industry, to identify superior practices and performance standards.
You can learn from these leaders and maintain a competitive edge.
Example: A marketing team benchmarks its KPIs, such as conversion rate, churn rate, and upsell rate, against those of a top-performing agency known for its highly innovative, viral marketing strategies. Based on the findings, the department improves efficiency and client satisfaction.
For effective best-in-class benchmarking, you need access to the following data and reports:
Key Performance Indicators (KPIs) are specific metrics tied to strategic business objectives. They are essentially data points that help your organization monitor performance, identify trends, and make informed decisions.
People often confuse metrics with KPIs, but there’s a clear distinction. While all KPIs are metrics, not all metrics are KPIs. Metrics are quantitative measures used to track and assess the quality of specific business processes.
Read this: KPIs vs Metrics: What They Are & How To Track Them
For benchmarking, you need KPIs to compare your business performance within your organization or competitors.
Here are some KPIs that you should track:
Revenue growth: Measures a company’s sales increase over a specific period
Revenue growth = (Current Revenue−Previous Revenue) / Previous Revenue × 100
Profit margin: Indicates the percentage of revenue that exceeds costs
Profit margin = (NetProfit / Revenue) × 100
Net Promoter Score (NPS): Assesses customer loyalty based on their likelihood to recommend a company
NPS = % Promoters − % Detractors
Customer retention rate: Shows the percentage of customers retained over a period
Customer retention rate = ((EndCustomers−NewCustomers) / StartCustomers) × 100
Customer acquisition cost (CAC): Calculates the cost to acquire a new customer
CAC = Total Acquisition Costs / Number of New Customers
Customer lifetime value (CLV): Estimates the total revenue a customer generates over their lifetime
CLV = Average Purchase Value × Purchase Frequency × Customer Lifespan
Specific formulas exist for each KPI, but instead of calculating these metrics manually, you can use pre-built templates.
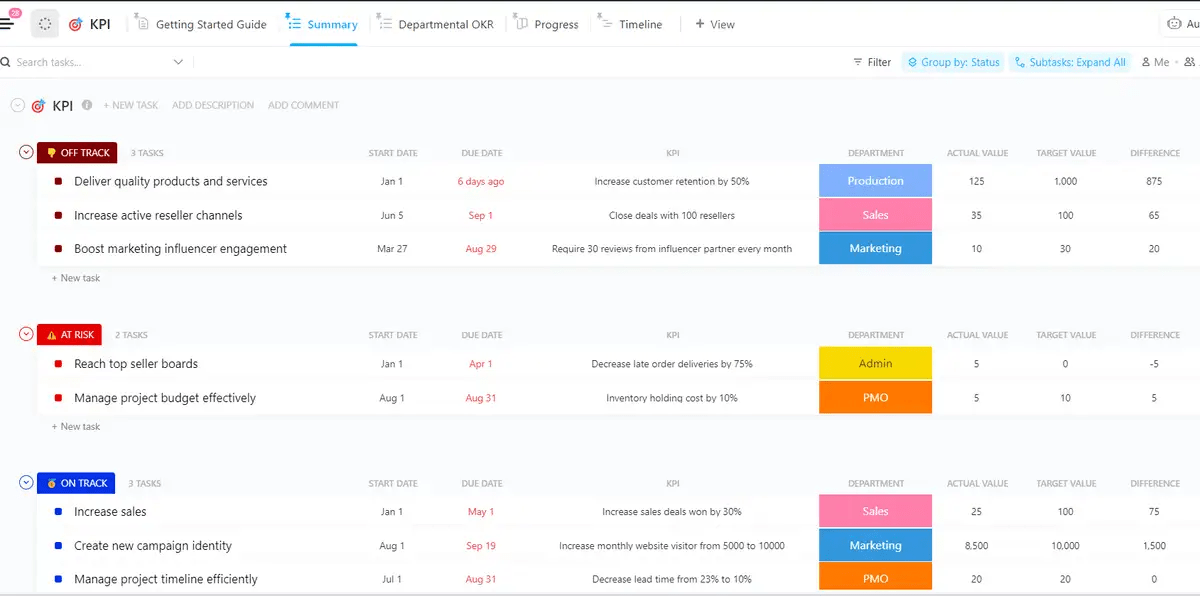
ClickUp offers various templates, such as the KPI Tracking Template, to help you get started quickly. This template includes pre-configured fields and views that save time and ensure consistency in tracking your benchmarks.
This template gives visibility into your team’s progress toward its goals and empowers management to make data-backed decisions. You can use this template to:
ClickUp is a robust project management tool that helps you organize, track, and manage your tasks. Unlike traditional project management tools focusing only on task management, ClickUp offers other comprehensive features such as Goals, Tasks, and Custom Fields, as well as multiple ways to view aggregate data and collaborate with your team and stakeholders.
These features help you plan and execute projects while comparing various metrics, making ClickUp an excellent tool for benchmarking.
ClickUp also integrates with data from various external sources, which makes it easier to compare and analyze performance across different business departments. With ClickUp, you can set clear benchmarks, align tasks to achieve those goals, and monitor real-time progress.
You can start benchmarking in ClickUp in four easy steps:
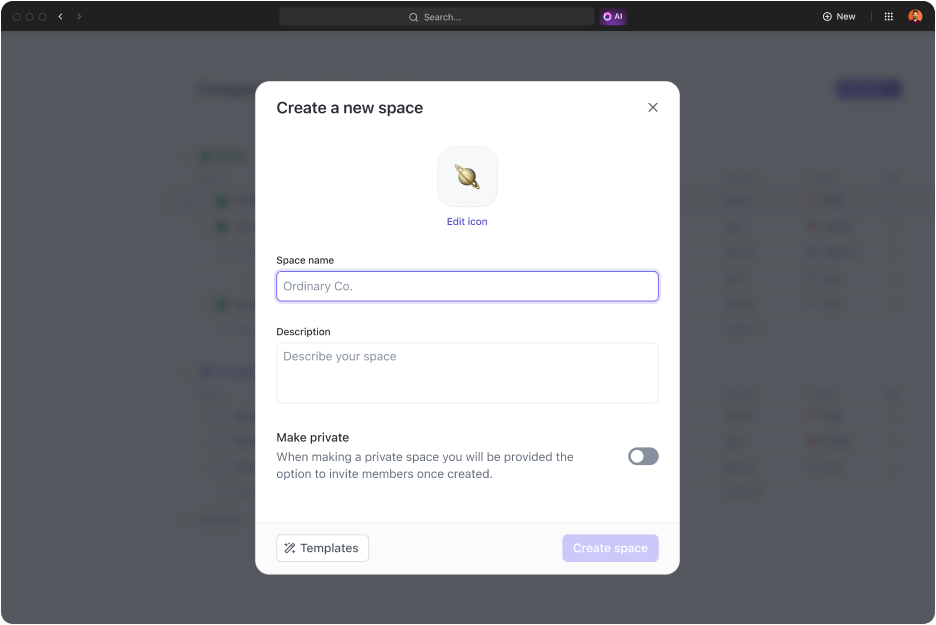
This will help you organize your benchmarking activities. The dedicated space within ClickUp will be a central hub for all your benchmarking tasks, documents, and data.
Here’s how you can create a dedicated space in ClickUp:
Use ClickUp’s Goals Tracking Feature to seamlessly set, track, and achieve your benchmarking objectives.

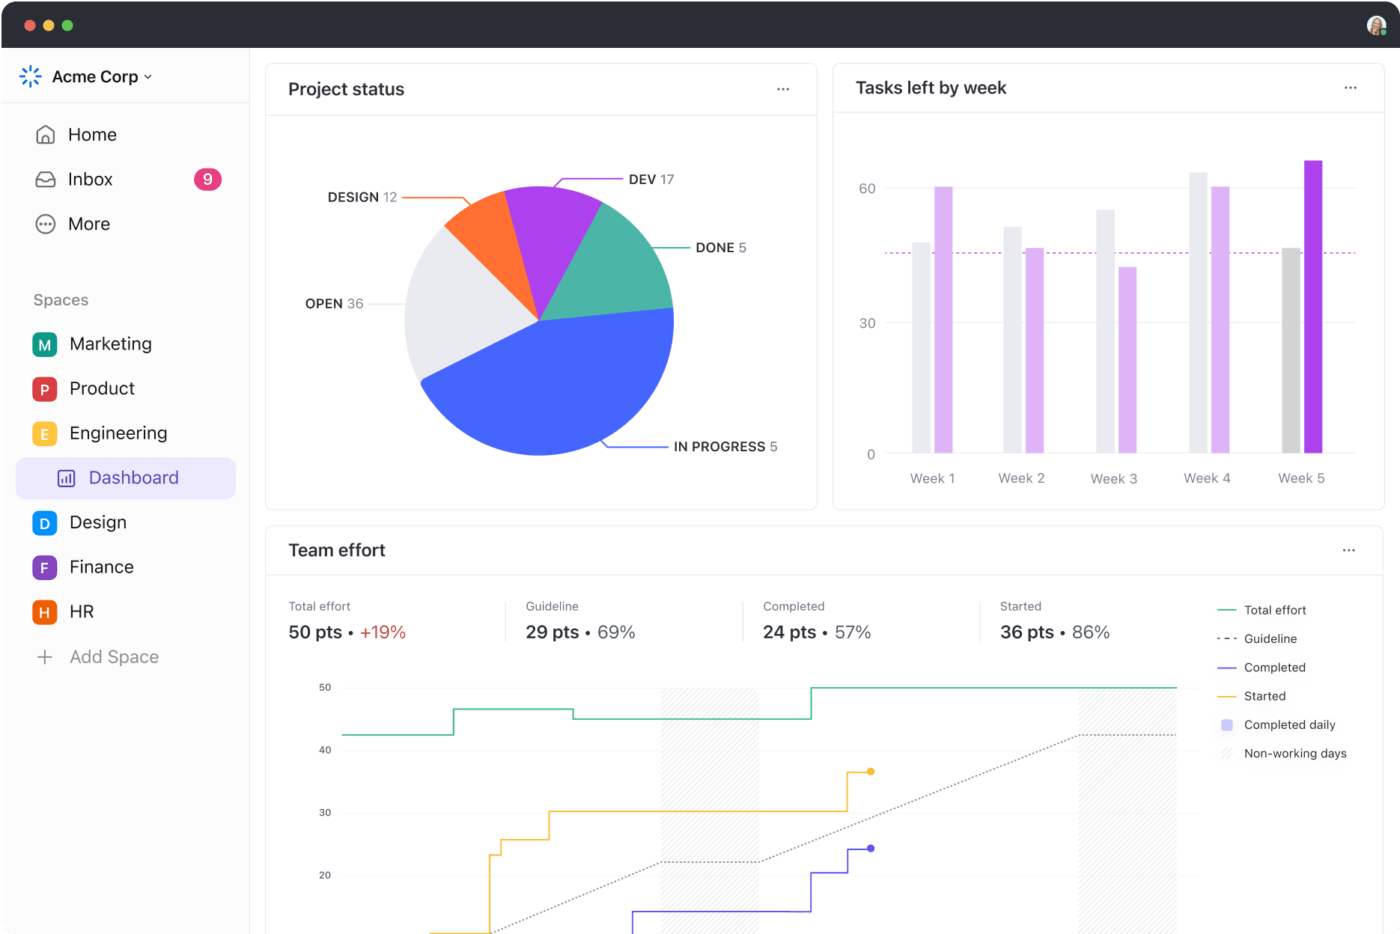
ClickUp’s Custom Fields and Dashboards provide powerful tools to monitor and analyze your progress.
It’s essential to keep your benchmarking process dynamic and responsive to new data to meet and exceed benchmarks continuously. Here’s how you can do this:
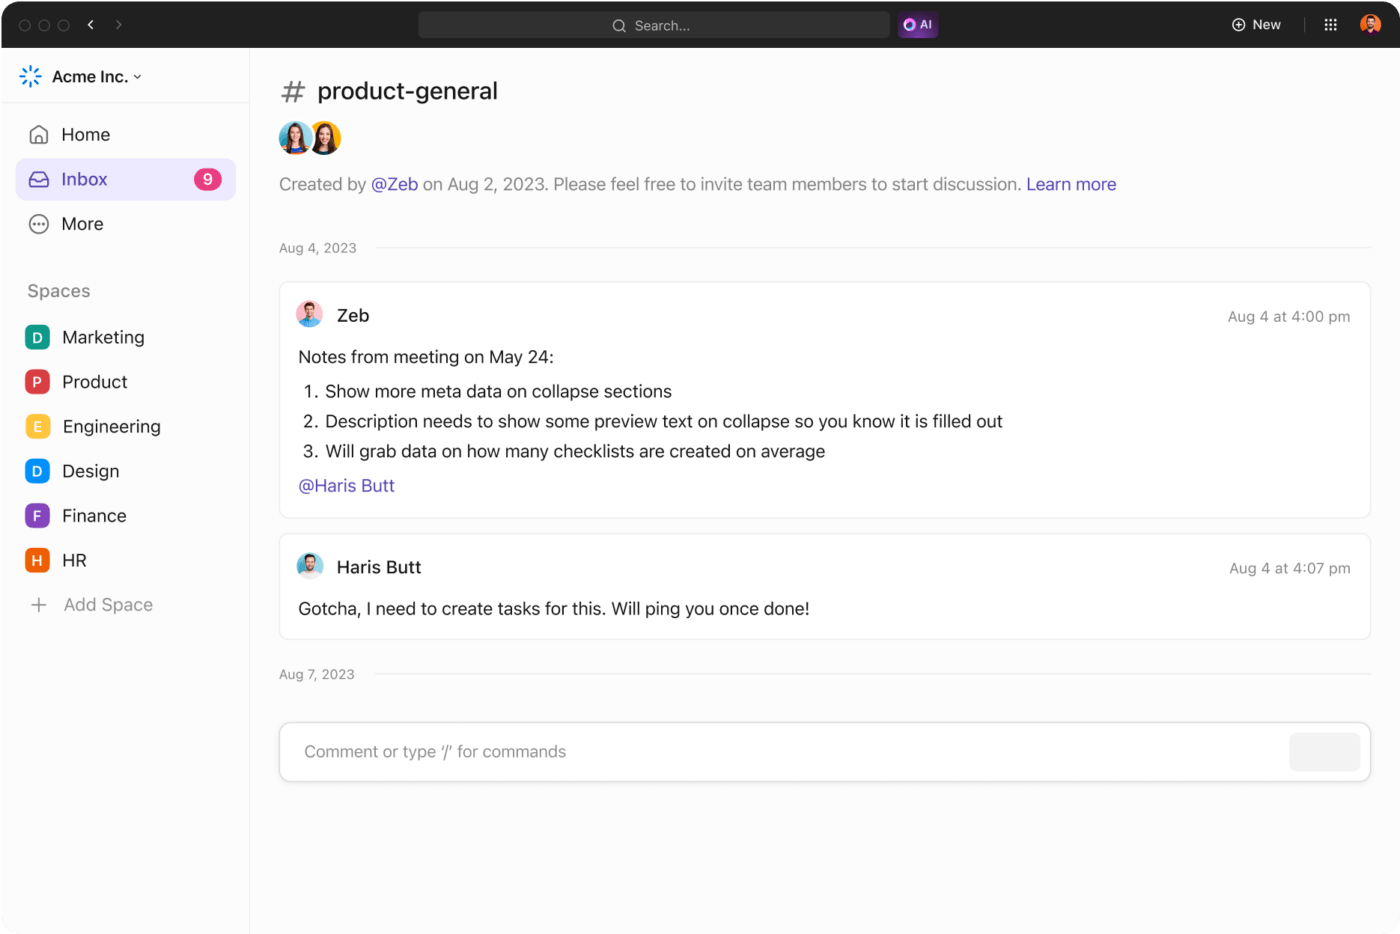
In Chat View, you can assign action items by mentioning your team members and sharing project links. You also receive notifications inside Chat View, so you always know what’s happening.
📮 ClickUp Insight: 78% of our survey respondents make detailed plans as part of their goal-setting processes. However, a surprising 50% don’t track those plans with dedicated tools. 👀
With ClickUp, you seamlessly convert goals into actionable tasks, allowing you to conquer them step by step. Plus, our no-code Dashboards provide clear visual representations of your progress, showcasing your progress and giving you more control and visibility over your work. Because “hoping for the best” isn’t a reliable strategy.
💫 Real Results: ClickUp users say they can take on ~10% more work without burning out.
All types of benchmarking exercises rely on specific formulas and data to make them effective. Running them manually takes hours and is also prone to error. That’s why you need a robust benchmarking tool like ClickUp.
ClickUp has KPI templates, goals, and dashboards that let you monitor and manage your benchmarks. With ClickUp, you can automate the benchmarking process and gain insights into your progress. Then use Chat View to easily share reports with your team and other stakeholders.
Increase your competitive edge in the market with benchmarking; sign up on ClickUp for free and kickstart your journey.

© 2026 ClickUp

There’s an easier way. Try a free AI Agent in ClickUp that actually does the work for you—set up in minutes, save hours every week.