
At its foundation, product marketing defines what products will be marketed, to whom, how, for how much, and in what way. With the growth of the tech and SaaS industry, product marketing has gained renewed interest.
Could anyone be a product marketer? Yes. If they can be the voice of the customer, drawing from key user/market data to make business decisions.
To enable this, product marketers need two things:
Product marketing metrics: Indicators of performance, serving as the compass, guiding marketers through the complexities of consumer behavior, market trends, and the effectiveness of marketing strategies.
Tools: Software and frameworks that capture the data you need to accurately measure performance like ClickUp’s product marketing platform. It offers a comprehensive suite of features designed to track, manage, and analyze product marketing KPIs with precision.
In this blog post, we explore both. We first understand key metrics and their importance, followed by how you can use the right tools to ensure product marketing success.
25 Product Marketing KPIs & Metrics to Track Success
- Product Marketing Metrics in Businesses
- 25 Product Marketing Metrics to Track in 2024
- 1. Net Promoter Score (NPS)
- 2. Customer Satisfaction Score (CSAT)
- 3. Churn rate
- 4. Content usage
- 5. Conversion rate
- 6. Lead conversion rate
- 7. Cost per lead (CPL)
- 8. Social media engagement rate
- 9. Session duration
- 10. Pageviews per session
- 11. Email open and Click-Through Rates (CTR)
- 12. Bounce rate
- 13. Customer Acquisition Cost (CAC)
- 14. Customer Lifetime Value (CLV)
- 15. Onboarding content/guide views
- 16. Return on Marketing Investment (ROMI)
- 17. Feature adoption rate
- 18. Shopping cart abandonment rate
- 19. Customer engagement score
- 20. Retention rate
- 21. Product return rate
- 22. Time to Value (TTV)
- 23. Market share
- 24. Average Revenue Per User (ARPU)
- 25. Monthly Recurring Revenue (MRR)
- How to Track Product Marketing KPIs
- FAQs About Product Marketing Metrics
Product Marketing Metrics in Businesses
Every product business needs to measure its performance, not just in terms of sales, but also various leading factors. That’s what product marketing metrics help in.
What are product marketing metrics?
Product marketing metrics are standards for measuring the effectiveness of marketing strategies over a given period. They connect marketing efforts to business outcomes.
Why are product marketing metrics important?
Like any metrics, product marketing KPIs also help evaluate performance. In addition, they offer significant long-term business benefits including:
- Facilitating data-driven product decisions, including big ones like the right features to build for the ideal customer persona (ICP)
- Enabling a culture of experimentation by testing multiple campaign ideas to identify successful approaches
- Increasing customer adoption and retention
Together with these metrics, product marketing templates create repeatability and efficiency in marketing efforts.
How do product marketing metrics contribute to the business?
The biggest benefit of product marketing metrics is that they help technology, marketing, and the sales team collaborate effectively based on common context and goals. They align the direction of the product with the overall organizational objectives.
- For example, let’s say the company’s business objective is to increase customer loyalty
- Corresponding product marketing metrics would be Net Promoter Score (NPS) and annual recurring revenue
- To meet those metrics, product teams would double down on features that customers love, improve on features that they are dissatisfied with, eliminate problem areas, etc.
Simply put, these metrics act as the bridge between the product/technology and the customer, making the journey smooth.
Let us look at some of the most effective product marketing metrics you can track in 2024.
25 Product Marketing Metrics to Track
Hundreds of product companies appear every day, building unique solutions for niche problems. Good product marketing metrics have the potential to be the difference between market leadership and obsolescence.
Choose the ones that best suit your business from the 25 top product marketing metrics we’ve curated for you.
1. Net Promoter Score (NPS)
Net promoter score measures the likelihood of your customer to recommend your product to a friend/colleague. Businesses typically ask: “On a scale of 0-10, how likely are you to recommend our product to a friend or colleague?” Scores of 9-10 are promoters, 7-8 are passives, and 0-6 are detractors.
NPS helps gauge:
- Customer satisfaction with the product
- Customer loyalty and likelihood of retention
- Effectiveness of the product in meeting customer needs
2. Customer Satisfaction Score (CSAT)
CSAT measures customer satisfaction using surveys asking the question, “how satisfied are you with your experience?” It is far more straightforward than NPS and more popular as well.
3. Churn rate
Churn rate is the number of customers who stop using your product or service over a given period. For SaaS businesses, this might be the number of customers who end the contract mid-cycle or do not renew at the end of the cycle.
Churn rate = Number of customers lost during the period / total number of customers at the start of the period
While churn rate might have more to do with the product than the marketing, higher churn can imply that product marketing team isn’t engaging existing customers enough.
4. Content usage
Content usage tracks how customers interact with your marketing content. This can mean:
- How many people are downloading your gated content?
- How many of your web pages are they viewing?
- How much time are they spending reading your blog posts on the website?
It helps marketers understand which types of content are most effective at engaging customers and driving conversions.
5. Conversion rate
Conversion rate refers to the percentage of customers who take the action that leads them from one stage in your marketing funnel to the next. This could be signing up for a newsletter, downloading an asset, signing up for a trial, or becoming a paying customer.
Conversion rate = (Number of conversions / Total number of visitors) X 100
Conversion rates measure the attractiveness of your offers, helping you optimize the bottom-of-the-funnel (BOFU) interactions.
6. Lead conversion rate
Lead conversion rate is a bit more specific, measuring the rate at which leads convert to paying customers.
Lead conversion rate = (Number of new customers / Total number of leads) X 100
Lead conversion rate is an important measure of the quality of your lead gen engine. Very low lead conversion rates might indicate that you’re either capturing the wrong ICP or not engaging them effectively.
7. Cost per lead (CPL)
Cost per lead is the amount spent in marketing to acquire a new lead across various channels such as search, social media, events, etc.
CPL = Total cost of a marketing campaign / Number of leads generated
Leads capture the strength of an organization at the top of the funnel. CPL shows your ability to generate awareness and interest with minimal investment. It also plays a key role in identifying channels that work and investing in them.
8. Social media engagement rate
Social media engagement rate quantifies the level of interaction users have with a brand’s social media content, including likes, shares, comments, and follows.
Social media engagement rate = (Total engagement / total number of impressions) X 100
This metric helps product marketers evaluate the effectiveness of social media strategies in building brand awareness and engagement. While this appears like a vanity metric, it can be a leading indicator for the effectiveness of social media as a channel in generating awareness and interest.
9. Session duration
Session duration is the average length of time a user spends on your website during a single session.
All good marketing analytics tools measure session time as a foundational metric for user engagement and quality of content on the site. Longer sessions can indicate more engaging content or a more effective user interface.
10. Pageviews per session
Pageviews per session measures the average number of pages viewed during a session.
In conjunction with session duration, pageviews per session measure how well your content captures and retains user attention, guiding improvements in site navigation and content quality.
11. Email open and Click-Through Rates (CTR)
Email open rate measures the percentage of recipients who open an email campaign. Click-through rate tracks how many clicked on a link in the email.
All the world’s email campaigns can be useless if users neither open nor read the messages you send to them. Email open and click-through rate is proof that you’re not screaming into the voice (or unfortunately, you are).
CTR not only measures the performance of your email campaigns, it also indicates how attractive your messages and offers are to the target audience.
12. Bounce rate
Bounce rate is the percentage of visitors to a website who navigate away after viewing only one page. Imagine a prospect interested in your product leaving without spending any time learning about it. That’s a bad scenario.
Bounce rate might indicate that:
- The site content is not relevant to the user
- There is no call-to-action compelling enough for the user to respond to
- The site is too slow and the user couldn’t be bothered
- The user found what they needed and isn’t interested
It is commonly believed that a high bounce rate is bad. It doesn’t have to be. If your customer gets everything they need right at the landing page and then leaves, you might just have a great landing page.
Use this metric alongside the user journey and expected action before you decide how you’re performing.
13. Customer Acquisition Cost (CAC)
CAC is the amount of marketing and sales expenses incurred to acquire a new customer. CAC = Total acquisition costs / No. of new customers
CAC is a primary indicator of the efficiency of marketing efforts. If the cost of acquiring a customer is more than the revenue derived from them, you might need to adjust your strategy over the long term unless your ‘customer lifetime value’ makes up for it.
14. Customer Lifetime Value (CLV)
Customer lifetime value is the estimate of how much a business can earn from a single customer throughout the course of their relationship.
CLV = Average purchase value of a customer X the number of purchases per year X average customer lifespan
CLV helps measure:
- Efficiency of marketing efforts
- ROI on marketing investments
- CAC efficiency, based on which you can design future budgets
15. Onboarding content/guide views
Onboarding content/guide views measures the number of times new users view or interact with onboarding materials. It is a key metric to evaluate the effectiveness of your customer success team.
Typically, high views and positive feedback on onboarding content suggest a smooth transition for new users, while low engagement may indicate confusion or lack of interest. Alternatively, low views might suggest the product is easy to use and customers don’t need support. And high views might mean that the product is complicated.
So, this metric needs to be viewed in conjunction with other customer satisfaction metrics related to onboarding.
16. Return on Marketing Investment (ROMI)
ROMI or marketing ROI calculates the sales/profits generated from marketing investments.
ROMI = (Sales attributable to marketing – marketing costs)/marketing costs
From marketing to sales, there are multiple steps. For instance, a search ad needs to get impressions, then clicks, then leads, then move down the pipeline to demo/trial, and eventually sale. With process mapping tools, you can track this journey and measure the velocity of this process in dollar terms.

17. Feature adoption rate
Feature adoption rate is the number of people who start using a new feature of your product within a certain timeframe after its release.
Feature adoption rate = (Number of users who have used the feature / Total number of users) * 100
This product marketing metric helps teams understand the reception and usability of new features.
18. Shopping cart abandonment rate
The shopping cart abandonment rate is the percentage of online shoppers who add items to their shopping cart but then abandon the purchase.
As a product marketer, this is a key metric in understanding gaps in customer experience and fixing them.
19. Customer engagement score
Customer engagement score represents how much your customers engage with your product or service. This can be answering questions like:
- How often do they log in to their account?
- How many features are they using?
- How many of your Instagram posts are they liking?
This score helps businesses identify highly engaged users for upsell opportunities and those at risk of churning for targeted customer retention efforts.
20. Retention rate
Retention rate, like conversion rate, is the percentage of users who take the expected action consistently at regular intervals. This could be:
- Listening to weekly episodes of your podcast
- Continuing to use the free version of your product
- Renewing their subscription to your product
Retention rate = [Total no. of customers – new customers for that period]/total no. of customers], represented as a percentage
A high retention rate indicates high customer satisfaction with the product, relationship, pricing, etc.
21. Product return rate
Product return rate measures the percentage of products returned by customers.
Product return rate = Total returns / total purchases [can be calculated for individual products as well]
You can also calculate return rate for individual products by dividing returns for said product by its purchases.
It’s essential for assessing product quality, customer satisfaction, and the effectiveness of return policies. A high return rate may indicate issues with product expectations or quality.
22. Time to Value (TTV)
Time to value measures the time it takes for a customer to realize value from a product or service after purchase. If you’re selling pizza, you might alleviate hunger straight away. However, if you’re selling a project management system, it might take a few weeks, if not months, to realize value.
Product marketing teams use this metric to evaluate the effectiveness of onboarding processes and the initial user experience. A shorter TTV can lead to higher customer satisfaction and retention rates.
23. Market share
Market share refers to how much of the market opportunity you’ve captured. For instance, if 1 million cars are sold in a year and BMW sells 200,000 out of that, their market share in 20%.
Market share = (Company sales / Industry sales) X 100
Market share is used by product marketers to understand opportunity. For instance, if you have captured 10% of the market, you might invest in growing your share. However, if you have 100% of the market share, you might want to rethink your strategy towards expanding the market itself.
24. Average Revenue Per User (ARPU)
ARPU is precisely what it says on the box. It is calculated by dividing total revenue by the total number of users during the period.
For SaaS-based product businesses that follow the usage-based pricing model, APRU is a critical metric. User-based pricing models, like Netflix, might have consistent ARPU, making it redundant.
However, for a brand like Mailchimp that charges by the number of emails sent or the number of contacts you have, APRU helps evaluate the revenue-generating capacity of their user base.
25. Monthly Recurring Revenue (MRR)
As the name suggests, monthly recurring revenue is the total subscription paid by customers over the period of a month.
MRR = Total number of paying customers X the average revenue per user
MRR is essential for understanding cash flow and forecasting future revenue. Especially for subscription-based businesses, it is a key indicator of performance and financial strength.
Now that you know what to track, let’s see how.
How to Track Product Marketing KPIs
Most product marketing teams work across several disparate tools for campaigns, creatives, analytics, etc. Tracking these metrics itself can become a tedious task.
ClickUp’s product marketing software is designed to solve precisely that problem. Here’s how a robust tool like ClickUp can help you track and achieve product marketing goals.
Set your product marketing goals
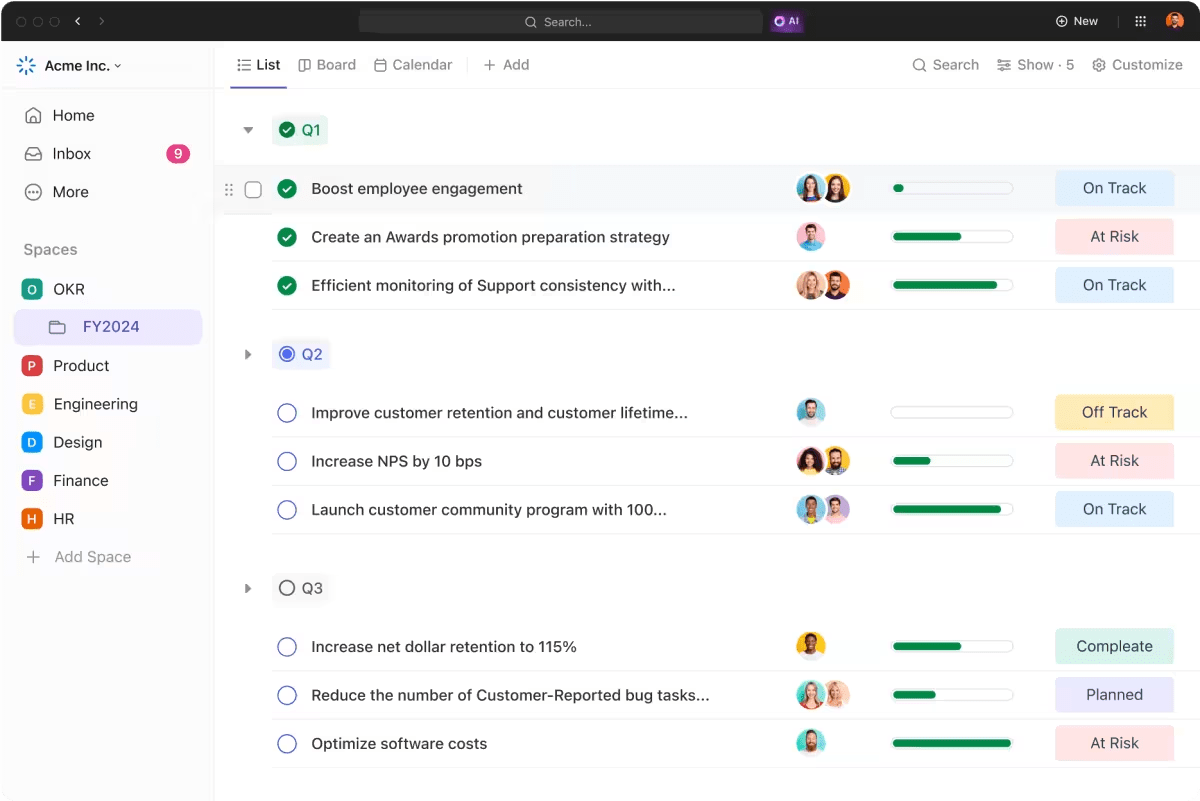
Use ClickUp Goals to set specific, measurable goals directly linked to your product marketing strategies. If you’re using objectives and key results (OKR) frameworks, use ClickUp to break down each objective into quantifiable key results, making it easier to measure progress and outcomes.
Make this quicker with the ClickUp Key Performance Indicator (KPI) template. Customize, set up, and move on to the marketing work!

Integrate your product marketing projects
Add all your projects as tasks into ClickUp, turning it into a central hub for your product marketing efforts. This consolidation ensures that no task falls through the cracks and allows for seamless collaboration among team members.
What’s more? You can automate goal reporting based on task completion on ClickUp’s marketing project management tool.

Manage product marketing relationships
Product marketing involves a range of people in product, content, design, marketing, customer success, and more. With ClickUp, you can manage your product marketing tasks, assign users, tag dependencies, and give access to external stakeholders all in one place.
Review and retrospect
ClickUp lets you consolidate your team’s work to review performance in one place.
- Connect tasks to objectives for a clear line of sight from effort to outcomes
- With 100+ integrations, bring data from across platforms to ClickUp
- Use this data to create customized reports to track the product marketing metrics you care about
ClickUp Dashboards offer a consolidated way to visualize metrics from website traffic and conversion rates to customer engagement scores and market share. Analyze trends, identify areas for improvement, and make data-driven decisions to enhance your product marketing strategies.
Rinse, repeat
An agile organization seeks to improve efforts and outcomes continuously. Use collaboration features like comments, real-time document editing, etc., to discuss feedback.
Incorporate feedback and insights into your product marketing strategy. Adjust and realign your project management goals and OKRs based on performance metrics.
Ace Your Product Marketing KPIs With ClickUp
Good product marketing needs metrics and tools. We’ve discussed 25 examples of metrics in this post.
On the other hand, you might use various digital marketing apps to execute your strategy. For instance, to capture website traffic data, you might use Google Analytics, send email campaigns from MailChimp, or use Canva for designs. Each of these tools creates its own data silos, which fragment your product marketing context.
ClickUp’s comprehensive product marketing software unifies your workspace and allows you to manage, track, and analyze your efforts. Whether you’re looking for marketing tools for small business or an enterprise, ClickUp can adapt.
See it in action. Try ClickUp for free today.
FAQs About Product Marketing Metrics
1. What are KPIs in marketing?
Key Performance Indicators or KPIs in marketing are quantifiable metrics used to evaluate the success and effectiveness of marketing activities. They help businesses track performance, adjust strategies, and make data-driven decisions.
2. What is KPI in product management?
In product management, KPI is a measurable value that demonstrates how effectively a product is achieving its objectives.
Some of the most commonly used product management KPIs and metrics are:
- User Engagement
- Customer Satisfaction Score (CSAT)
- Monthly Recurring Revenue (MRR) or Annual Recurring Revenue (ARR)
- Churn Rate
- Feature Adoption Rate
- Conversion Rate
- Time to Market
3. How do you measure product marketing success?
Product marketing success is measured with KPIs designed to suit the organization’s offerings. For instance, if you’re a subscription business, annual recurring revenue (ARR) or monthly recurring revenue (MRR) might be a key metric. If you follow a product-led growth (PLG) strategy, NPS might be a key metric.
Here’s a structured way to measure product marketing success:
- Define clear objectives and goals
- Identify relevant KPIs and set goals
- Use marketing analytics software
- Monitor customer feedback
- Track performance on identified metrics
- Optimize efforts to improve outcomes


Everything you need to stay organized and get work done.

Recent Articles
Marketing Agency Leadership in 2026: The New Operating Model for Profit 
Marketing Agency Leadership in 2026: The New Operating Model for Profit
How to Scale a Marketing Team: A Phase-by-Phase Guide
How to Scale a Marketing Team: A Phase-by-Phase Guide
How to Write Release Notes That Get Read (With Examples) 
How to Write Release Notes That Get Read (With Examples)
