Sorry, there were no results found for “”
Sorry, there were no results found for “”
Sorry, there were no results found for “”
Are you unable to track progress due to scattered updates, spreadsheets, and siloed task dashboards? You’re not alone. And you’re definitely not the problem. The real issue is a lack of visibility and clarity.
A good progress chart cuts through the noise. It shows you what’s done, what’s in motion, and what’s falling behind. You get a consolidated view of progress without the stress of status meetings or Slack chases.
But how do you build an effective one without spending hours on it? In this post, we’ll share the best progress chart templates to keep you organized, efficient, and actually in the loop.
Progress chart templates are frameworks for visually representing the progression of tasks or projects over time. They offer individuals and teams a standardized approach for monitoring, managing, and communicating progress.
The main types of progress charts include:

A well-designed progress chart template is critical for properly tracking and managing projects. Key features include:
📮 ClickUp Insight: 92% of workers use inconsistent methods to track action items, which results in missed decisions and delayed execution. Whether sending follow-up notes or using spreadsheets, the process is often scattered and inefficient. ClickUp’s Task Management Solution ensures seamless conversion of conversations into tasks, so your team can act fast and stay aligned.
Finding the correct progress chart template doesn’t have to be complicated. These templates will help you visualize project activities, manage milestones, and organize your workflow better. Use them online or print a physical copy to get started!
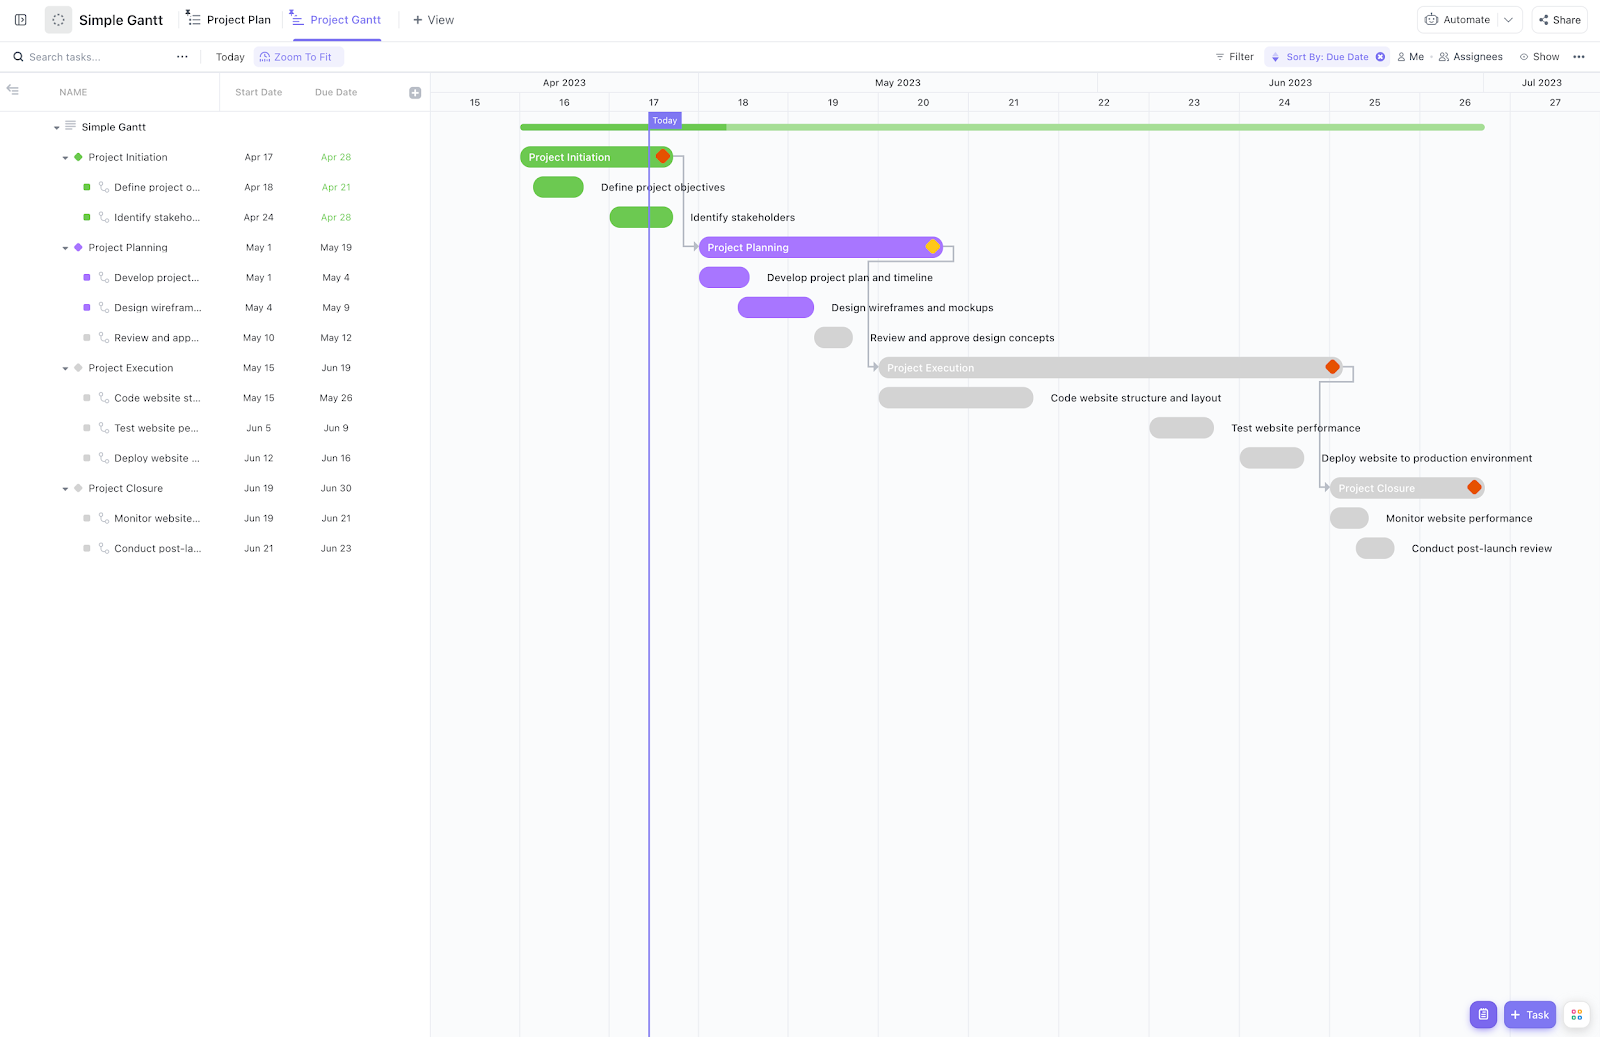
The ClickUp Simple Gantt Chart Template is a simplified project management tool that displays project timelines, task dependencies, and milestones using a ClickUp Gantt chart.
This template allows for efficient task scheduling, priority management, and real-time adjustments to keep projects on track. Thanks to an intuitive drag-and-drop interface, schedules, dependencies, and deadlines can be easily altered.
🎯 Ideal for: Project managers, Agile teams, and cross-functional groups looking to better plan and track project timelines
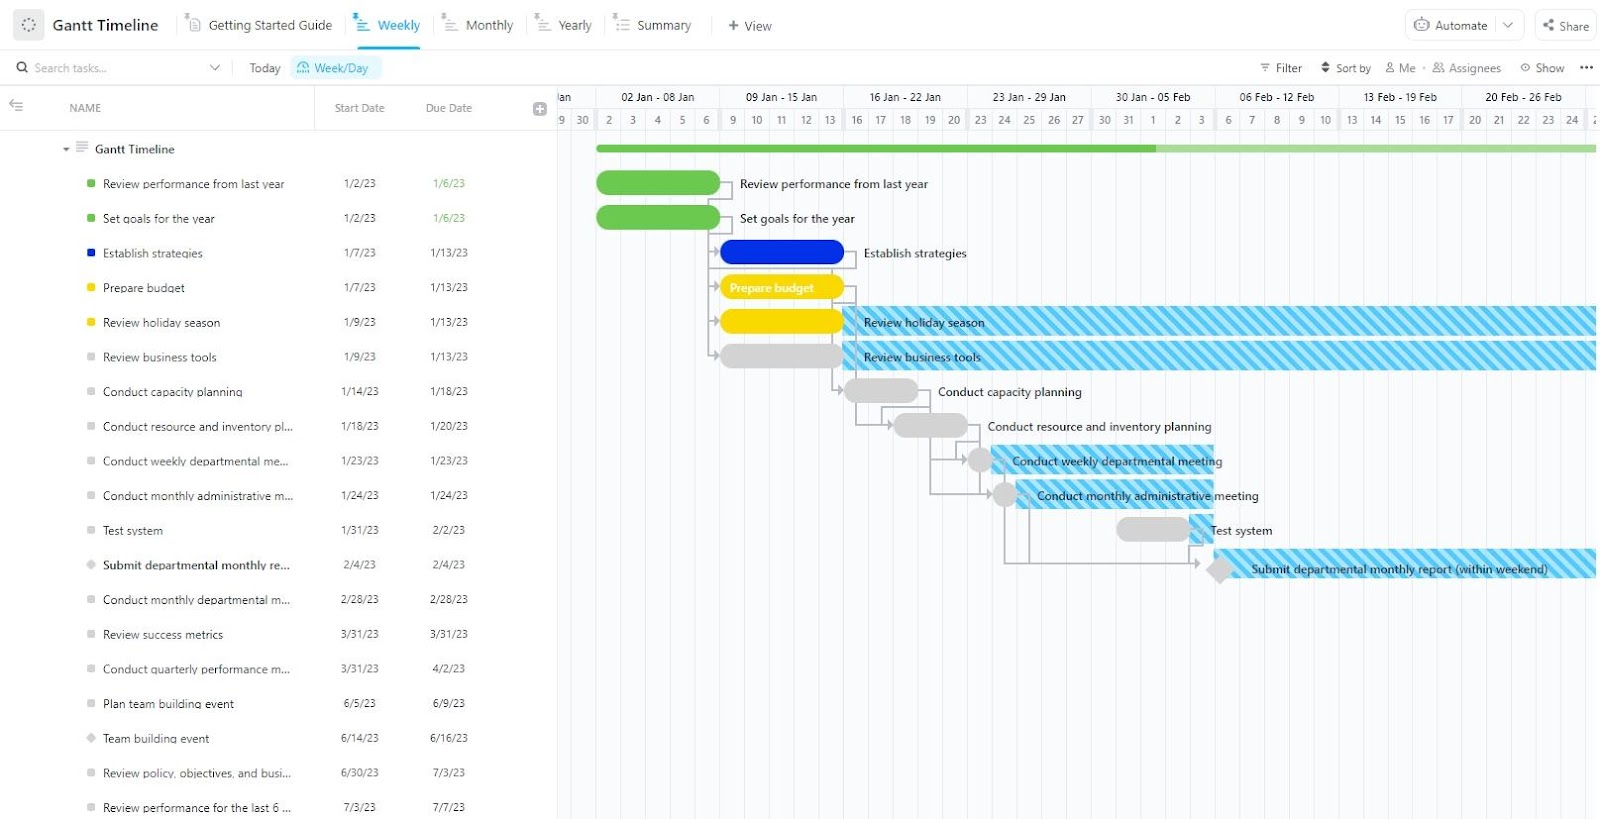
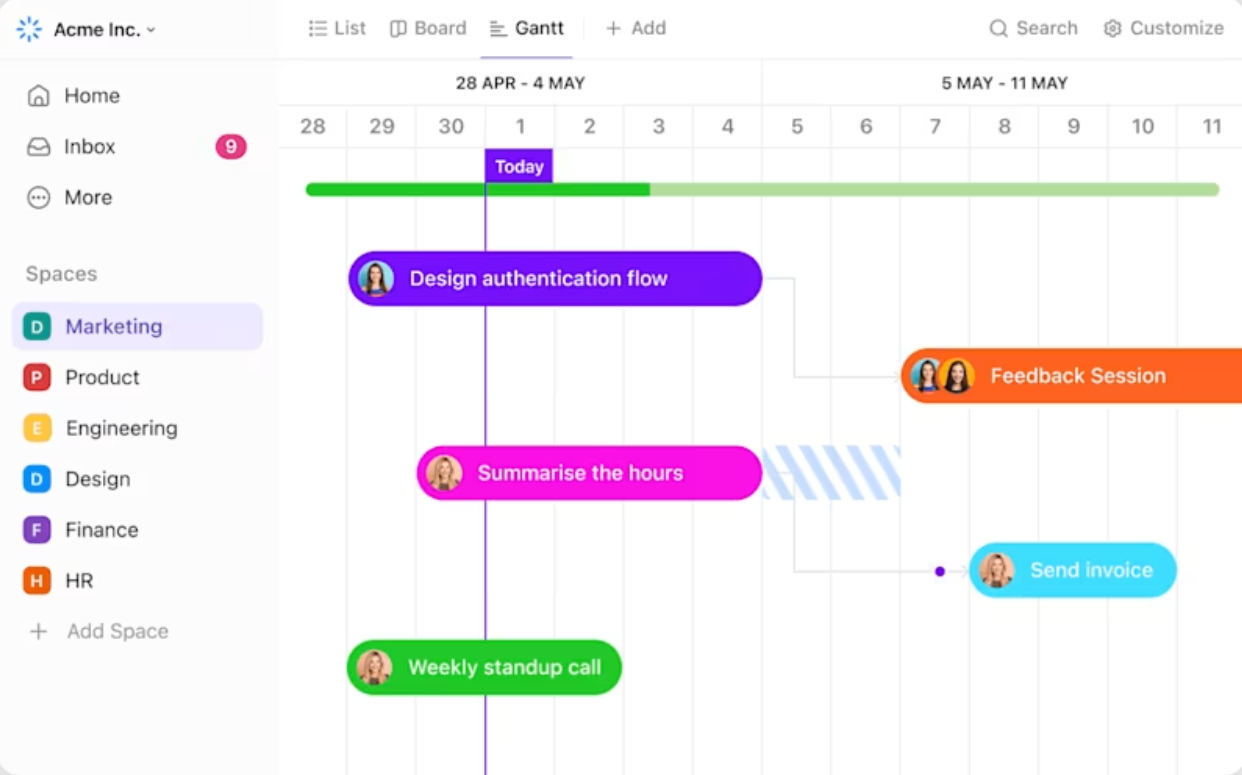
The ClickUp Gantt Timeline Template helps teams remain on track to successful project delivery by giving a structured, timeline-based view of tasks, deadlines, and dependencies. With real-time progress tracking and drag-and-drop features, you can easily change task timetables, reassign jobs, and meet commitments.
The interactive interface lets you easily detect bottlenecks, track milestones, and ensure risks don’t derail projects—all from one centralized view.
🎯 Ideal for: Project managers, teams handling complex workflows, and organizations looking for a clear and interactive way to manage project timelines
🔎 Did You Know: Organizations that overlook project management in their strategic planning face a 60%+ project failure rate, according to research by PMI.
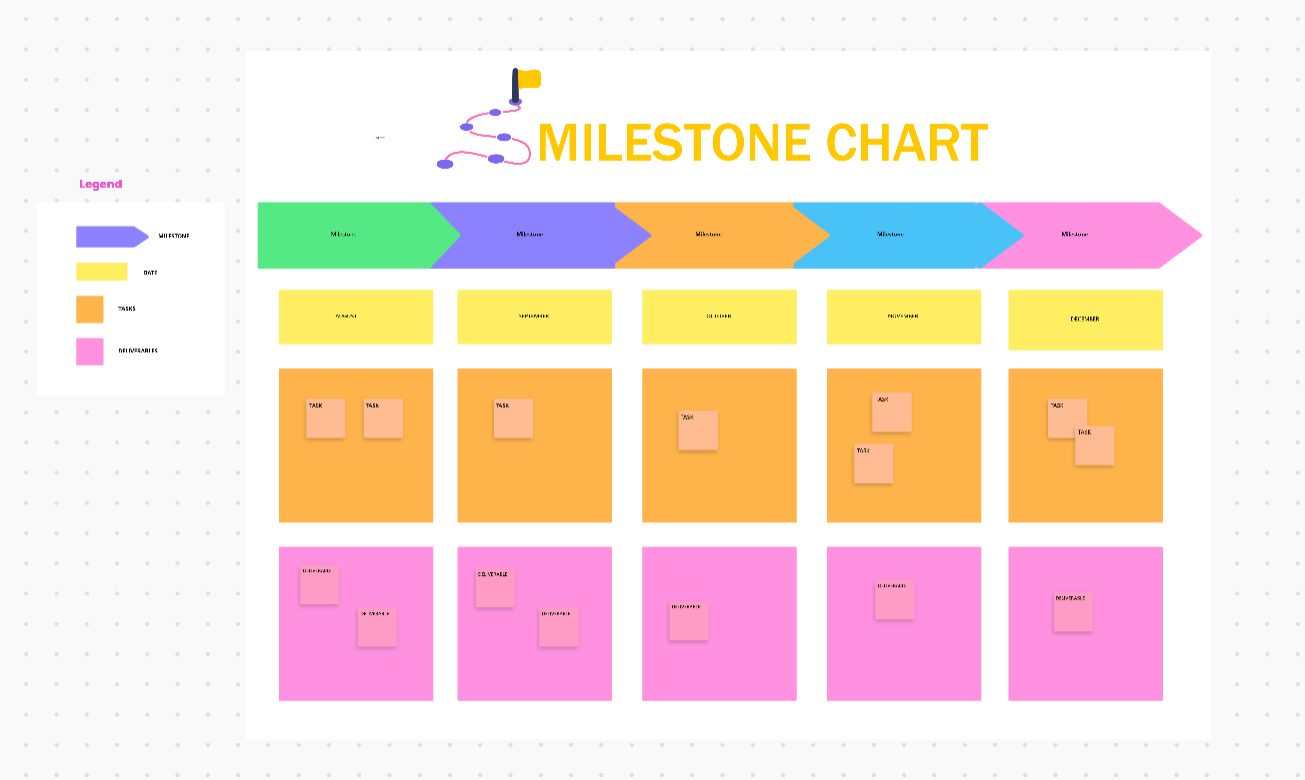
The ClickUp Milestone Chart Template is a versatile tool that helps teams break down big projects into manageable steps. Use it to mark milestones that give everyone a clear picture of progress and encourage the team to put in their best efforts.
To complement this milestone template, use ClickUp Goals to set measurable targets, track key results, and ensure all milestones contribute to your larger business objectives.
🎯 Ideal for: Project managers, team leads, and organizations that need a clear and interactive way to manage and communicate project milestones and build team morale
🎥 Watch this video to learn how to use project milestones:
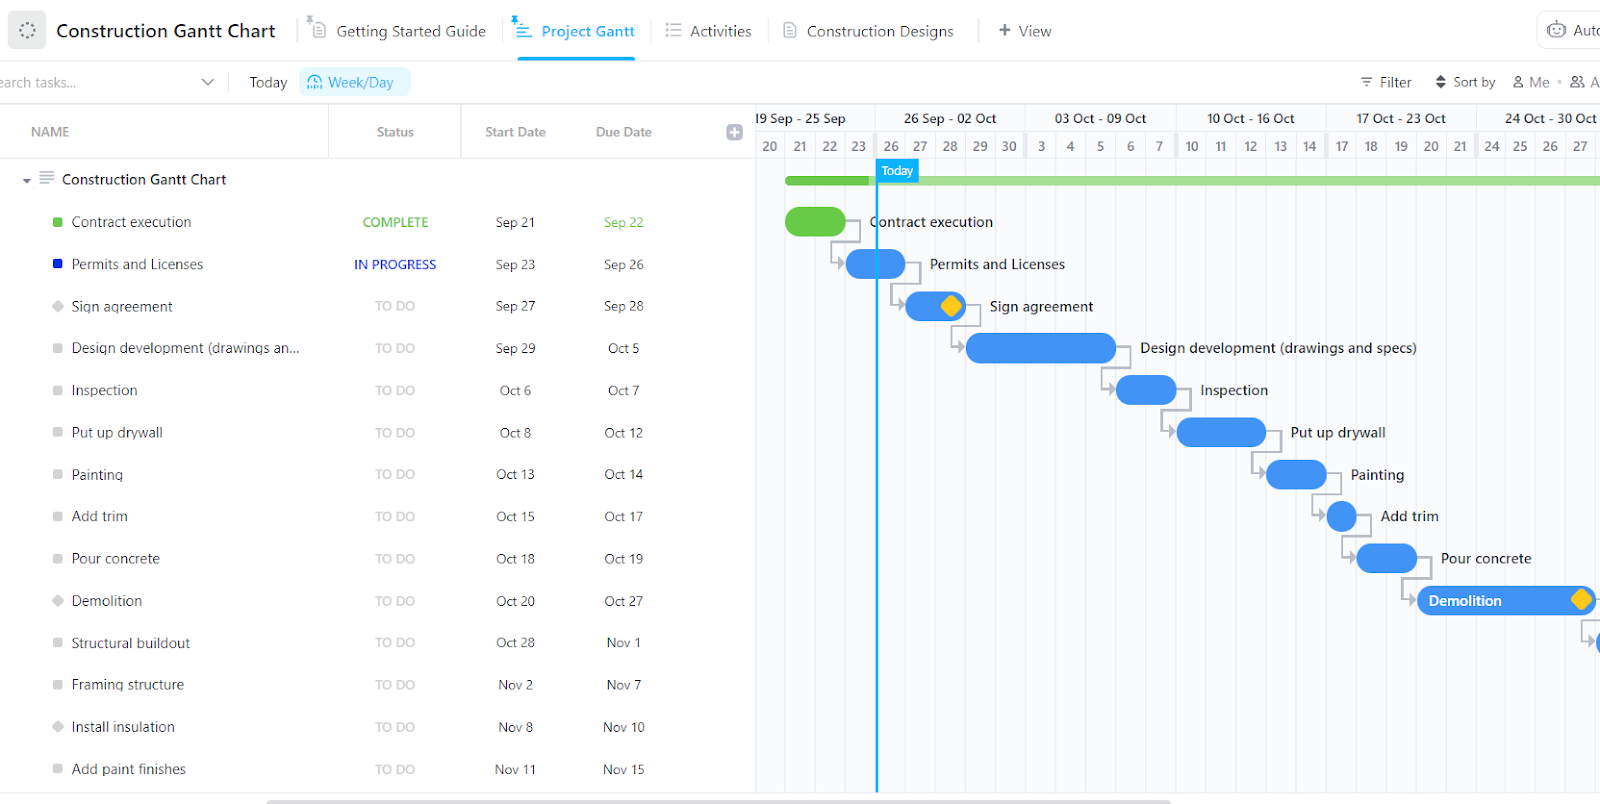
Delays in construction projects can lead to skyrocketing costs, missed deadlines, and strained stakeholder relationships. They can also trigger legal disputes and disrupt planned operations or occupancy.
The ClickUp Construction Gantt Chart Template is a tool designed to assist construction project managers and teams in planning, scheduling, and monitoring all aspects of their projects and avoid such complications.
This template allows you to create visual timetables, assign resources, and track goals in real time, ensuring that your entire construction project stays organized and meets planned deadlines.
🎯 Ideal for: Construction project managers, contractors, and teams seeking an effective way to plan, execute, and monitor construction projects from start to finish
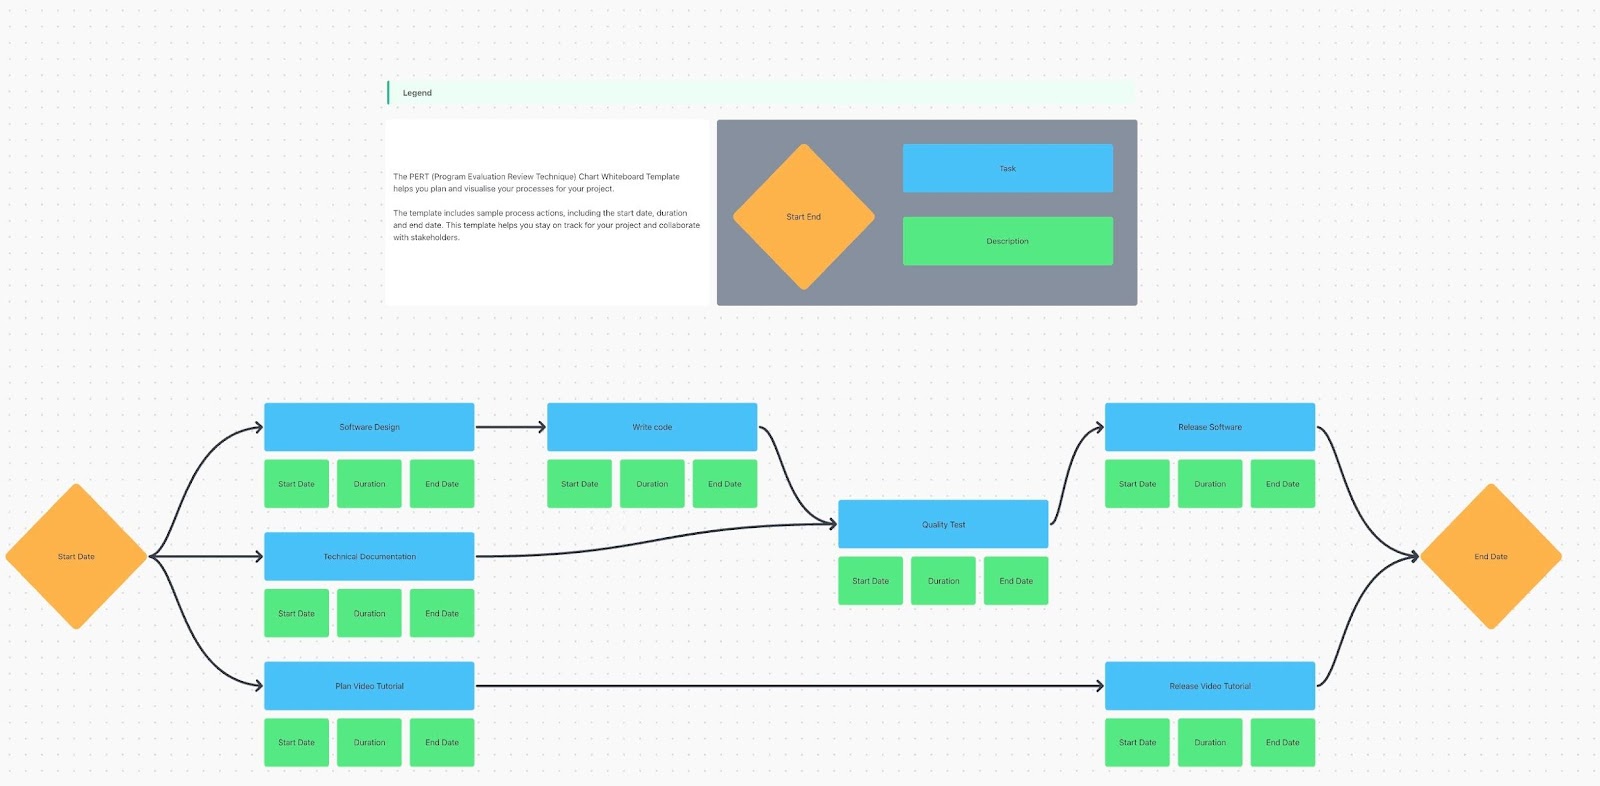
A PERT chart (Program Evaluation Review Technique) is a visual project management tool used to map out tasks, timelines, and dependencies in a project. It helps teams identify the critical path, estimate how long each task will take, and spot potential delays before they happen.
Thus, the ClickUp PERT Chart Template enables teams to successfully plan, schedule, and coordinate individual tasks to complete bigger projects.
This template provides a whiteboard to map workflows, assess job dependencies, and predict project durations.
With a clearly laid out project plan, teams recognize possible bottlenecks, optimize decisions, and manage resources more efficiently, keeping projects on schedule.
🎯 Ideal for: Project managers, team leads, and organizations looking to streamline complex projects and improve task management
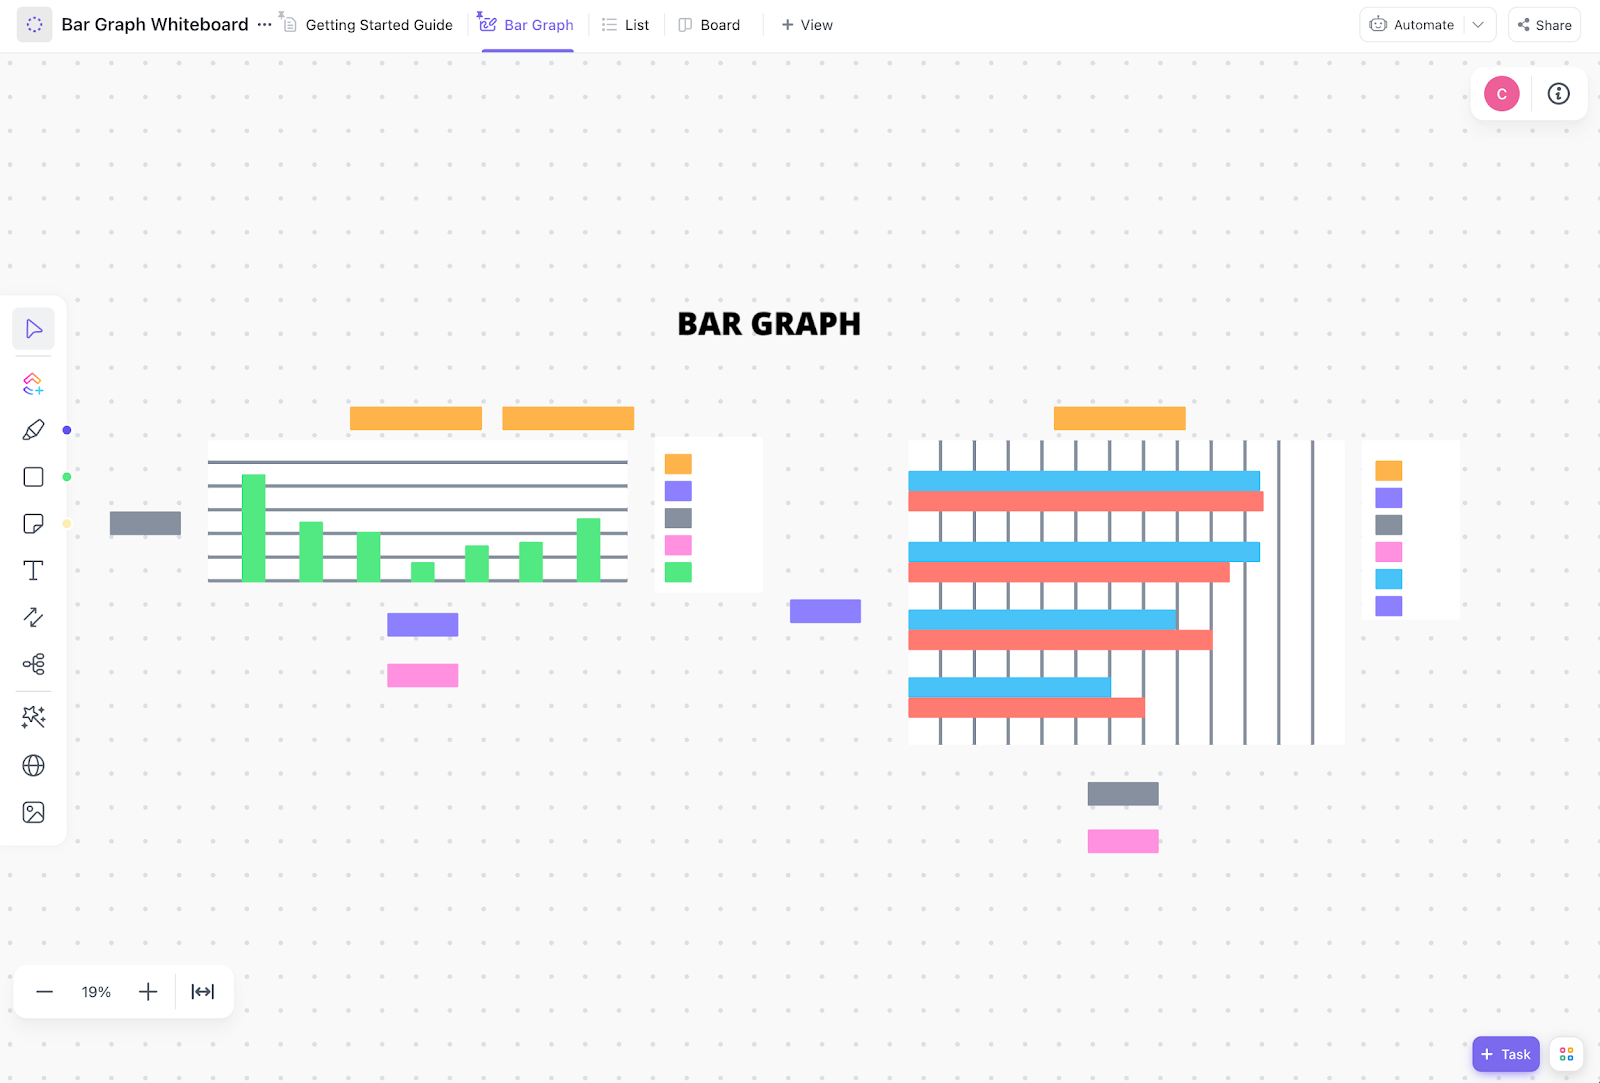
The ClickUp Bar Graph Whiteboard Template is a versatile tool that helps teams convert raw project data into clear, visual bar graphs. It boosts real-time collaboration by allowing team members to brainstorm, strategize, and organize ideas for greater clarity and focus.
Whether you’re presenting a business case or reviewing project metrics, this template guarantees that your data is clear and actionable.
🎯 Ideal for: Data analysts, project managers, and teams looking to enhance their data visualization and collaborative analysis capabilities
Here’s what Jayson Ermac, Process Manager at AI Bees, had to say about using ClickUp Whiteboards:
ClickUp has tools to visualize your process, goals, etc. It is the peak of collaborative work and it has been improving on that end, especially with the addition of the Whiteboard View.
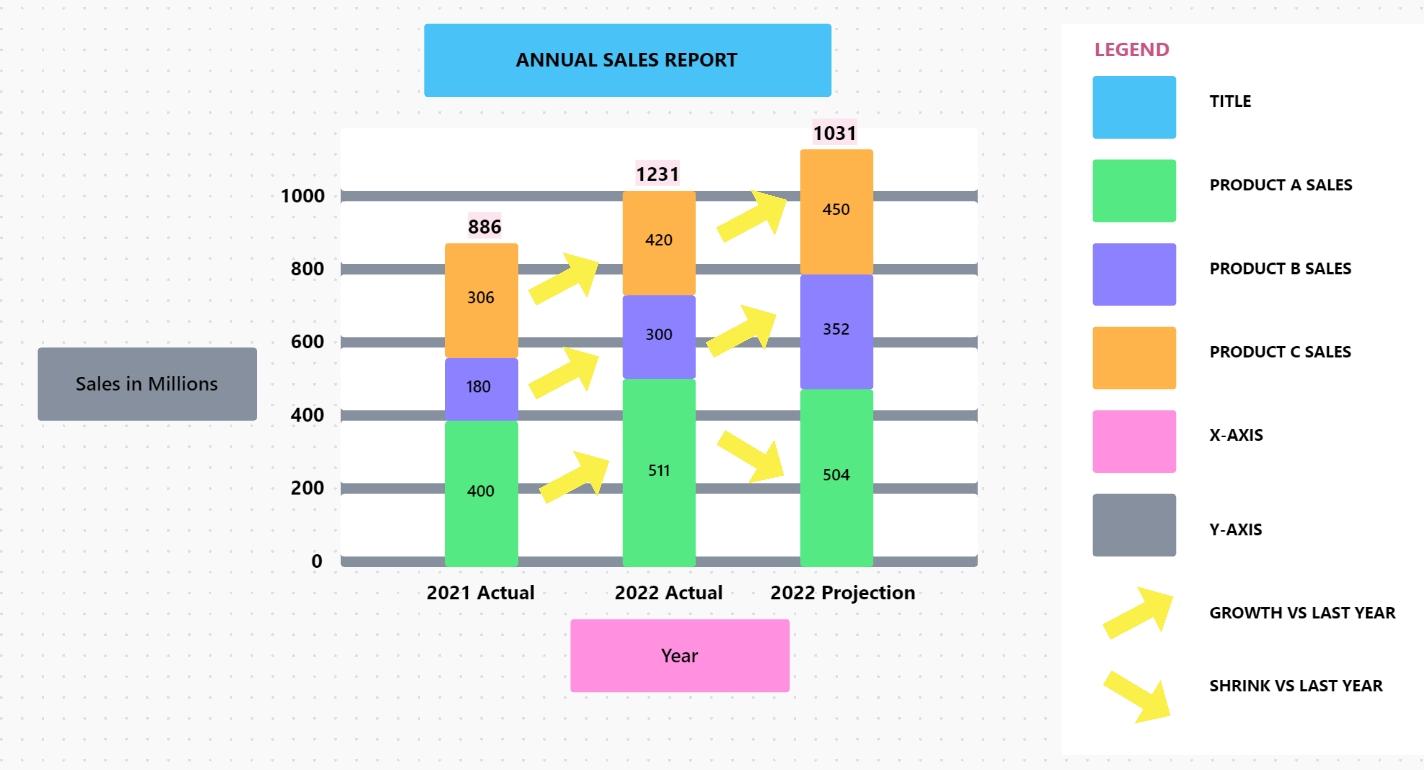
The ClickUp Stacked Bar Graph Template is a great tool for teams to translate complex data into clear, actionable insights. It allows you to construct stacked bar graphs that provide a full perspective of how your data is distributed, making it easier to compare several series inside the same chart.
Moreover, with the option to label and color your data points, this template guarantees that the key metrics you need are displayed clearly and intelligibly. The built-in legend also makes it easier for external stakeholders to interpret the data.
🎯 Ideal for: Data analysts, project managers, and teams needing an effective way to visualize complex data and enhance decision-making processes
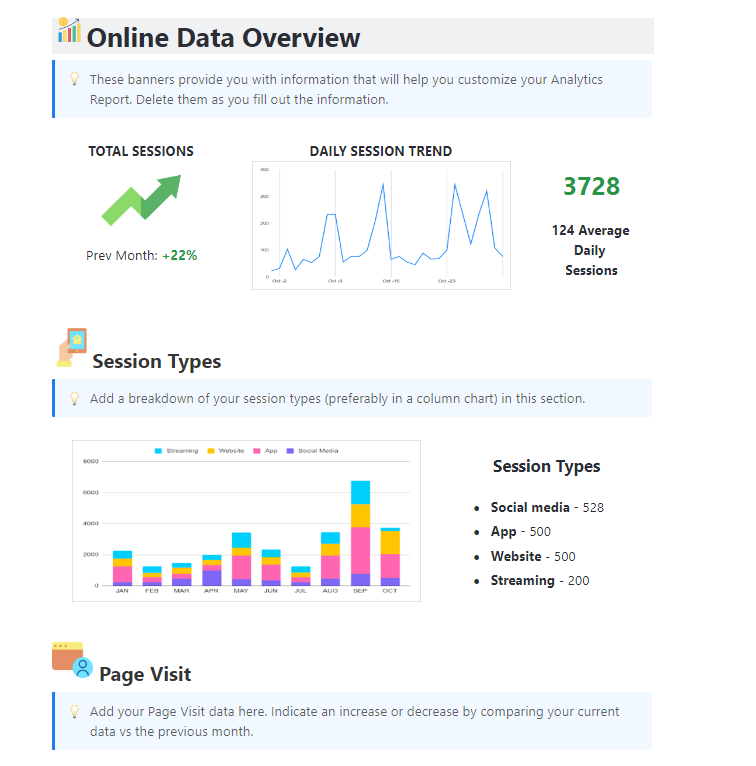
The ClickUp Analytics Report Template enables teams to track, analyze, and report on critical indicators. Visualize complicated data sets using simple yet aesthetic graphs and charts. Track essential performance metrics and evaluate trends, correlations, and patterns to draw meaningful conclusions about various functional activities within your organization. This template can be adapted for marketing campaigns, sales deals, product launches, and more.
For a more dynamic and interactive reporting experience, you can also build custom ClickUp Dashboards. Choose from over 50+ cards to visualize the metrics that matter—in real time.
🎯 Ideal for: Data analysts, business managers, and teams that want to enhance their data reporting and decision-making processes
🧠 Fun Fact: Since switching to ClickUp, 60.2% of customers have saved 3+ hours weekly, while 40.9% have replaced three or more tools!
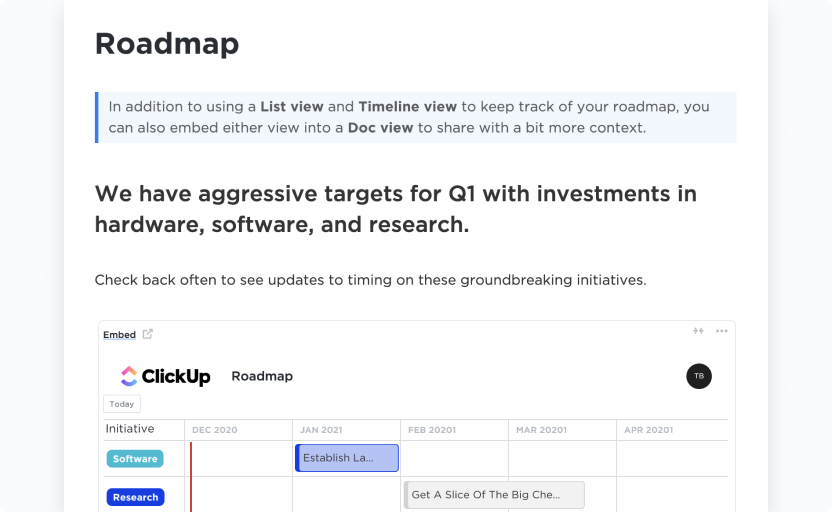
The ClickUp Quarterly Roadmap Template is a strategic planning tool that enables teams to see and prioritize critical initiatives for the following quarter. It gives teams a structured way to outline goals, track initiatives, and align efforts across departments in one dynamic workspace.
With clear priorities and a big-picture view, teams can stay focused on key objectives without losing sight of an overarching strategy. Additionally, integrate OKRs to define clear goals and measurable key results, keeping your team results-driven.
🎯 Ideal for: Project managers, team leads, and organizations looking to simplify their quarterly planning process and achieve strategic objectives
💡 Pro Tip: Use progress report templates in ClickUp to standardize the format for updates across your organization and make them easier to follow. Use built-in Custom Fields to track deadlines, owners, and status at a glance, and set up Automations to notify stakeholders when milestones are hit. With real-time Dashboards, your team gets instant visibility—no chasing, no second-guessing.
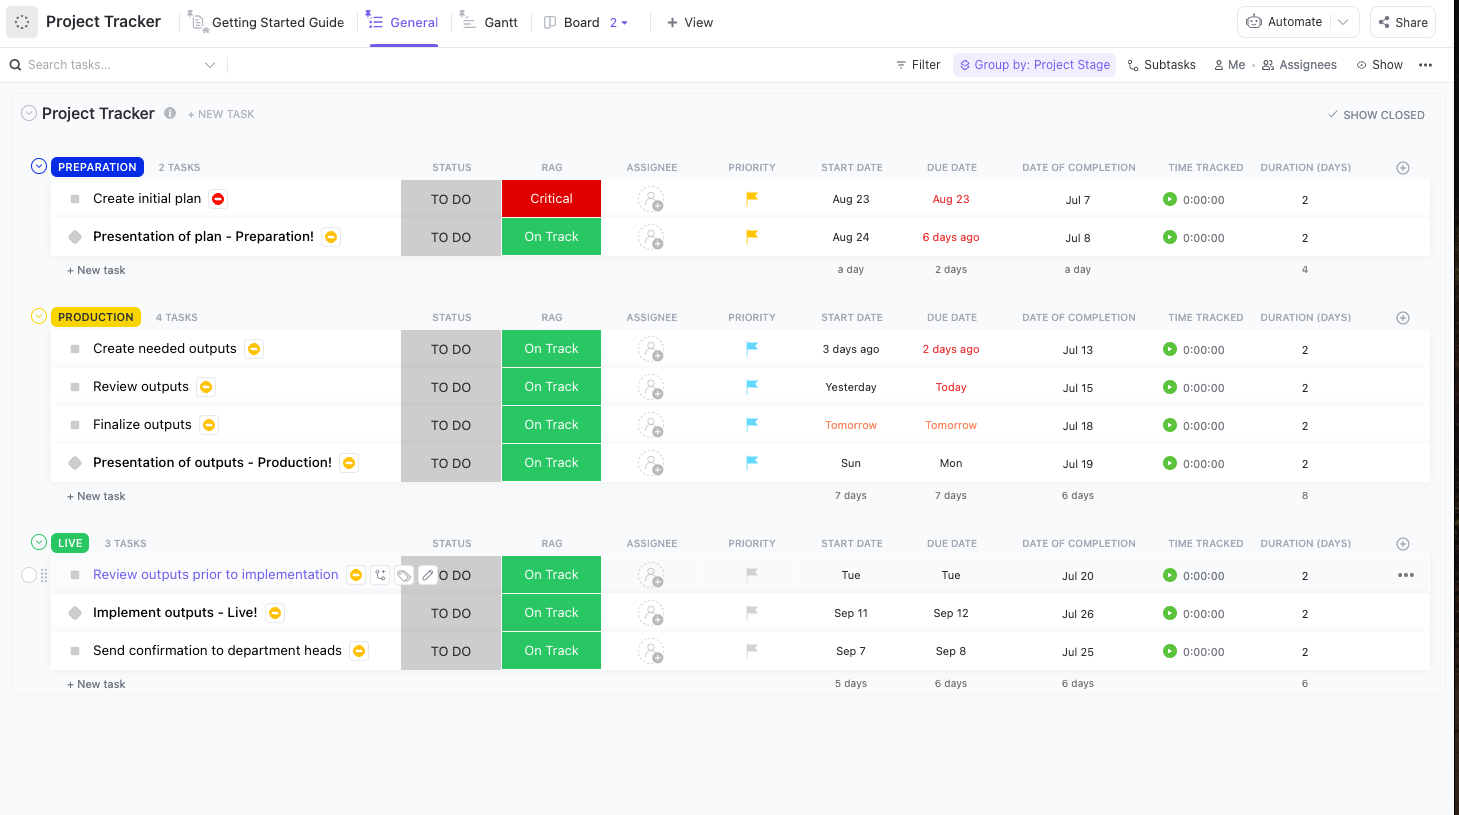
The ClickUp Project Tracker Template enables teams to track project progress, manage tasks, and fulfill deadlines without juggling multiple tools.
This template adapts to your needs with automation, real-time progress tracking, and seamless collaboration tools. Whether you’re overseeing a marketing campaign, IT rollout, or client project, this template keeps everything organized and moving forward.
🎯 Ideal for: Project managers, team leads, and organizations looking to organize tasks, monitor progress, and collaborate
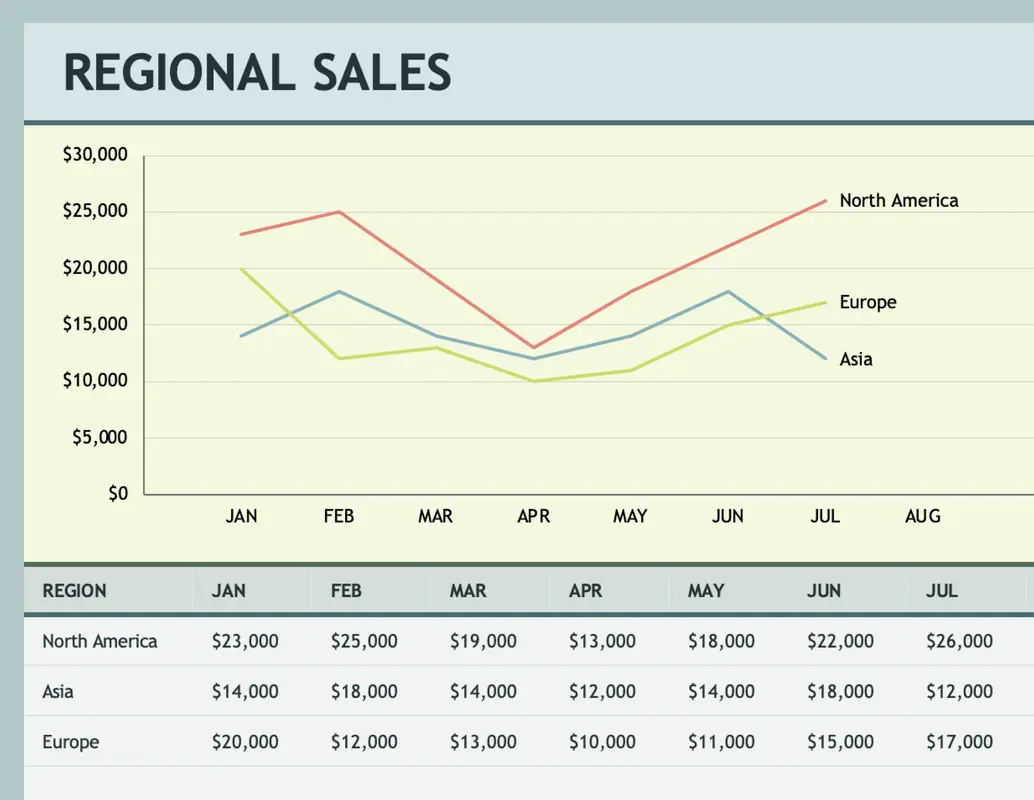
The Excel Sales Progress Chart Template is a simple tool that allows companies to track and analyze sales performance across multiple geographies.
By entering your data by location and month, this easily accessible Excel task tracker template provides graphical representations that allow you to discover sales and revenue trends and make informed decisions.
🎯 Ideal for: Sales managers, business analysts, and teams looking to effectively monitor and present regional sales data
The appropriate progress chart template is determined by your project’s needs, team workflow, and tracking requirements. These templates provide a disciplined and transparent approach to efficiently tracking progress.
For teams that require real-time sync for changes, task dependencies, and seamless collaboration, ClickUp’s templates are a perfect solution. With configurable statuses, drag-and-drop functionality, and different views, keeping projects on track becomes easier.
ClickUp also simplifies progress monitoring from planning to execution with native automation, integrations, and customizable workflows. Whatever the scale or complexity of your project, ClickUp has the tools you need to stay organized and in control.
Sign up for free today and start tracking progress with clarity and confidence.
© 2025 ClickUp