

Whether you’re a marketer, a salesperson, or a manager, tracking and analyzing specific data can help you grow your SaaS company faster.
However, in a sea of different KPIs and metrics waiting to be measured, it’s crucial to identify the ones that best align with your project objectives and help optimize your business strategy effectively.
Picking the right KPIs to track is especially important for SaaS businesses, as they operate in highly competitive industries, and their growth and success depend on customer acquisition and retention rates.
Some of the most important SaaS KPIs reveal the success of your marketing campaigns and help you identify areas for improvement. While effective, tracking SaaS KPIs for only sales and marketing efforts isn’t enough to ensure your business will keep growing. ?
In this article, we’ll reveal the 10 essential SaaS KPIs to track in 2024 and explore common challenges you may face while doing so. We’ll also introduce you to tools to help you monitor all SaaS KPIs seamlessly.
- Understanding SaaS KPIs and Metrics
- 10 Essential SaaS KPI Metrics to Track in 2024
- The Role of SaaS KPIs in Strategic Planning
- The Importance of Balance Sheet KPIs for SaaS Growth
- Challenges of Tracking KPIs and How to Overcome Them
- How to Track the Most Important SaaS Metrics and KPIs
- Summarizing Common FAQs
Understanding SaaS KPIs and Metrics
While they may sound similar, SaaS KPIs and metrics don’t refer to the same thing.
SaaS key performance indicators (KPIs) are high-level metrics that provide an overview of the company’s overall health. These are the most important measurable metrics that track a business’s progress against its objectives.
Typically, these KPIs evaluate areas like revenue growth, status of new and existing customers, website visitors, etc. They’re usually used by executives and SaaS managers, as well as a company’s customer success team, to make data-driven decisions.
Meanwhile, metrics is an umbrella term that includes KPIs and other tools for measuring progress and performance. In other words, not all metrics are SaaS KPIs. They’re used on a broader scale by marketing and sales team members, product managers, and customer support teams to optimize different business areas.
How Does a SaaS Business Model Work, and How Does It Affect KPI Tracking?
Software as a service (SaaS) companies operate on a specific business model—they provide users with access to their software for a monthly or annual fee. The customers can keep using the software as long as they continue paying for it. On top of that, they can typically cancel their subscription whenever they like, as they’re usually not bound by a contract.
Using such a specific business model means that SaaS businesses have distinct ways of measuring performance. This is because the success of these companies depends on the number of subscriptions and monthly users—more users means more revenue generated. ?
All in all, for a SaaS business, the main aim is to keep the monthly recurring revenue high. Therefore, you should focus on customer retention as one of the primary KPIs if you want your company to thrive. It’s also important to track monthly active users, customer acquisition cost, customer lifetime value, and other essential KPIs discussed in the next section.
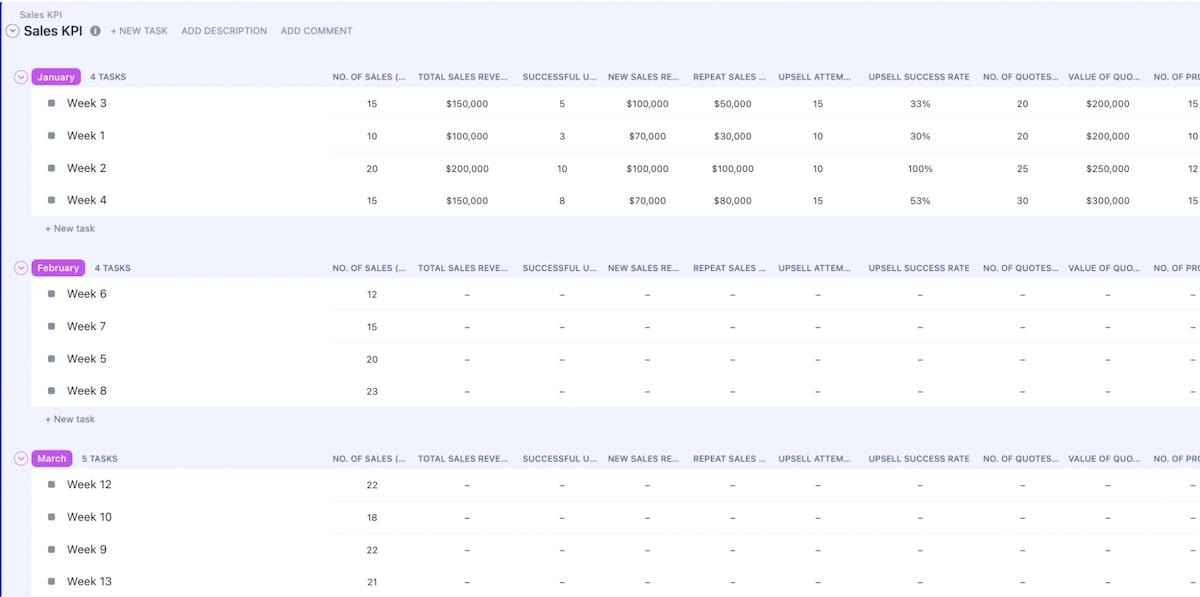
Pro tip: Eager to start tracking your SaaS sales and revenue metrics right away? Leverage the ClickUp Sales KPI Template to monitor KPIs and improve processes across all stages of your sales funnel from a single window. ?
10 Essential SaaS KPI Metrics to Track
There are dozens of important metrics, but tracking them all is neither necessary nor productive. Instead, you should focus on the most important ones to streamline business growth.
Let’s look at the essential SaaS KPIs your company needs to track.
1. Churn rate
Since SaaS businesses depend on subscribers, measuring customer churn rate is the obvious first step. This KPI shows you the number of subscribers lost in a specific timeframe.
When your business relies on customer retention and your churn rate is high, it means many customers are dissatisfied with your software. However, a higher churn rate should be expected if your software isn’t a permanent solution for users.
An increased churn rate may be caused by market trends, competitors, or pricing. So, if your SaaS business experiences a higher-than-average churn rate, you should reexamine your features and pricing strategies.
Here’s how to calculate the churn rate:
Lost customers ÷ Total customers at the start of the time period) x 100
2. Revenue churn rate
Tracking revenue churn rate is even more important than tracking customer churn rate. It reflects the revenue lost over time because of canceled or downgraded subscriptions.
Tracking this KPI quarterly or monthly can help you better understand customer behavior and take the necessary action to reduce the churn rate.
Here’s how to calculate the revenue churn rate:
Recurring revenue lost during the period ÷ Recurring revenue at the start of the time period) x 100
3. Monthly recurring revenue
Monthly recurring revenue (MRR) is the total value your SaaS company generates from active subscribers in a month. MRR tracks upsell, new sales, renewals, and churn, helping you keep a record of your monthly revenue flow. It also shows how your business grows and can help you reach decisions in areas like resource allocation and product development.
Here’s how to calculate the MRR:
The formula for calculating MRR can vary depending on the type of MRR you’re tracking. The more straightforward way of calculating MMR is:
MRR = (number of customers) x (corresponding revenue from them)
If you have 10 customers who pay you $10 a month— your MRR is 10 x 10 = $100 for that month.
Businesses with different deal sizes and plans may calculate using the formula below.
MRR = (number of customers) x (average monthly revenue per customer)
4. Product-qualified leads
Product-qualified leads (PQL) measure the number of customers who have used your product in a free trial and reached pre-defined triggers that indicate they may become paying customers.
While marketing qualified leads (MQL) are based on specific actions like clicking on a link received by email, PQLs reflect customer behavior—they provide insight into the impact of certain software features on the customer during the trial period.
This information allows you to improve the features existing customers seem to like best and advertise them more in your free trial.
Here’s how to calculate the PQL to paid conversion rate:
Total number of PQLs converted to pay ÷ total PQLs x 100
5. Customer conversion rate
Customer conversion rate (CCR) informs you about your product’s customer engagement by revealing the number of prospects that became paying customers.
A low CCR indicates potential customers have lost interest in your product. You may identify why you lose your existing customers by closely examining the SaaS sales funnel process. For most SaaS companies, the loss typically occurs during the free trial.
You may also have a low CCR if the sales team keeps profiling the wrong customers. If that’s the case, analyzing your CCR can lead you to a potential solution to this issue. Plus, tracking your custom conversion rate can help you measure the performance of multiple marketing campaigns to see which campaign is the most successful.
Here’s how to calculate the CCR:
Total conversions ÷ Total website visitors
6. Customer acquisition cost
Measuring your customer acquisition cost (CAC) is essential to avoid overspending issues. The main factors contributing to CAC are research, marketing, and employee costs, which can accumulate if you put in extra effort to acquire new customers.
Note that the CAC only considers the cost of acquiring a customer by getting them to purchase your service. This doesn’t include the cost of software production.
Analyzing this KPI can help you understand where your money is going and what you can do to save it, especially if you’re wasting too much of your company’s income on unprofitable avenues. The goal is to make more money than it costs you to acquire a customer.
Here’s how to calculate the CAC:
(Cost of sales + Cost of marketing) ÷ New customers acquired
7. Customer retention rate
One of the most important KPIs for SaaS businesses is the customer retention rate (CRR), which shows how many active users are over a set timeframe. A high CRR means customers keep using your service, which leads to revenue growth. ?
If you have low CRR, common reasons may be:
- Technical issues
- Lack of features
- Poor customer support
- Not responding to customer feedback
Here’s how to calculate the CRR:
[(Customers at the end of the period – Customers acquired during the period) ÷ Customers at the start of a period] x 100
Analyzing your CRR can help you identify issues, if there are any, and come up with a suitable solution to retain existing customers.
For example, if you link a weak CRR to your SaaS company’s poor ticketing culture, you can start taking steps toward improving customer service. If you’re a ClickUp user, you can easily jump on the ClickUp Customer Service Management Template to manage resolutions from start to finish and implement more proactive efforts toward customer satisfaction. ?

8. Customer lifetime value
Your customer lifetime value (CLV) estimates the total income you’ll receive from each customer while they’re subscribed to your services. It’s one of the more critical customer success KPIs as knowing the profitability of your existing customers can help you make strategic decisions regarding features, marketing, and pricing.
While tracking CLV, you should also pay attention to CAC or the customer acquisition cost to ensure getting new customers isn’t costlier than their average lifetime value. Ideally, no business should spend more money on getting new customers than it earns from them.
Here’s how to calculate the customer lifetime value:
Customer value x Average customer lifespan
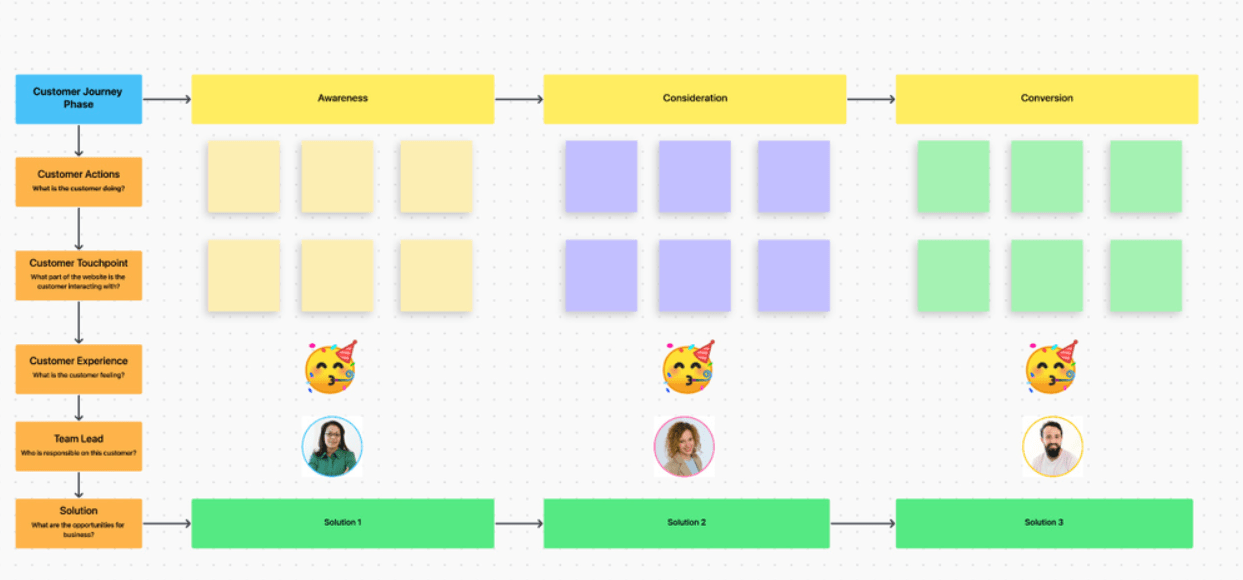
Bonus tip: Visualize customer experience with your product across all touchpoints with the ClickUp Customer Journey Map Template. Easily measure customer satisfaction by tracking awareness, consideration, and conversion on an interactive whiteboard and identify areas of potential friction faster.
9. Average revenue per user
Measuring the average revenue per user shows how much each subscriber spends on your services every month. Tracking this SaaS KPI can help you determine the amount of money you make from each user so that you can invest your earnings better.
Since most SaaS businesses include subscription tiers and add-ons in their offer, there are typically differences in customers’ spending. Still, this KPI can help you understand what users most often pay for and why.
Here’s how to calculate the ARPU:
Total revenue ÷ Total number of users
Calculating this metric will be easier if you use the ClickUp Daily Sales Report Template to get real-time visibility into customer activity and trends, leading to more accurate revenue estimates.

10. Net promoter score
Relying on the net promoter score (NPS) informs you of how many customers are satisfied with your service. This is a crucial KPI to measure since it reveals how well your SaaS company is doing. If the score isn’t favorable, it allows you to identify areas for improvement and make the necessary adjustments.
The NPS format requires asking your customers how likely they would recommend your company, product, or service to a friend or colleague. Respondents then provide a score from 0 (not likely at all) to 10 (extremely likely).
Those who respond with a score of 9 or 10 are considered promoters or loyal customers who may recommend your service to others. The ones who provide a 0 to 6 score are considered relatively dissatisfied with the service and aren’t likely to give recommendations or keep using your services.
Here’s how to calculate the net promoter score:
The percentage of promoters – The percentage of detractors
The Role of SaaS KPIs in Strategic Planning
KPIs are crucial for strategic planning as they turn visions and abstract goals into achievable objectives and recurring revenue. They help you identify the factors that impact your business success the most, measure performance in those areas, and compare the values against industry benchmarks.
Besides this, KPIs also contribute to strategic planning by:
- Making the planning process more data-driven
- Tracking parameters to verify the effectiveness of strategic planning
- Identifying challenges and opportunities so you can adjust your plan
- Promoting cross-functional collaboration by encouraging teams to work toward common goals
- Helping you prioritize revenue-generating elements in your marketing strategy for better outcomes
- Fostering transparency by quantifying business performance to stakeholders
- Revealing the SaaS business success factors so you can design your future success plan accordingly
You can now use strategic planning templates to create your SaaS business roadmap without starting from scratch! Start planning immediately with the ClickUp Strategic Roadmap Template to map out and visualize long-term goals and objectives, as well as determine the SaaS metrics suitable for measuring progress.

The Importance of Balance Sheet KPIs for SaaS Growth
Besides performance, tracking your business’s financial health is essential for your company to grow and have a secured monthly revenue flow. The easiest way to assess your SaaS company’s health at a specific point in time is to use balance sheets. They provide insights into the business’s health, growth potential, and risk factors.
There are numerous balance sheet KPIs you could follow to better understand your company’s health, efficiency, and liquidity.
Here are five of the most important balance sheet KPIs for SaaS businesses:
- Current Ratio: Compares your company’s current assets to its current liabilities
- Quick Ratio: Measures the business’s liquidity and ability to pay short-term liabilities using liquid assets
- Debt-to-Equity Ratio: Shows how much debt you’re using to finance the company’s assets by comparing your company’s total debt to your shareholders’ equity
- Equity Ratio: Calculates how much of the company’s assets are financed by owner’s equity
- Interest Coverage Ratio: Measures if your company can pay its interest expenses on outstanding debt based on how much revenue it generates
Challenges of Tracking KPIs and How to Overcome Them
Let’s explore a few common challenges of tracking KPIs and learn how to overcome them.
Picking the right SaaS KPIs for revenue growth
Due to the high number of KPIs you can track, many businesses find it hard to decide which ones to choose and end up asking a consultant to pick the KPIs for them.
However, choosing the right KPIs requires deep knowledge of your business practices and lots of experimentation. You have to factor in questions like:
- What’s the stage of your SaaS business?
- Does a KPI have the potential to reveal the trends you seek?
- Which KPIs are more aligned with your current business goals?
Choosing the right software
Picking the best business intelligence (BI) tool to collect, analyze, and display KPIs isn’t easy, as there’s a wide array of software to choose from. Ideally, the tool you pick should have:
- Intuitive dashboards for easy data visualization
- Advanced analytics features
- AI tools to speed up data analysis
- The ability to integrate with other analytics tools your teams use
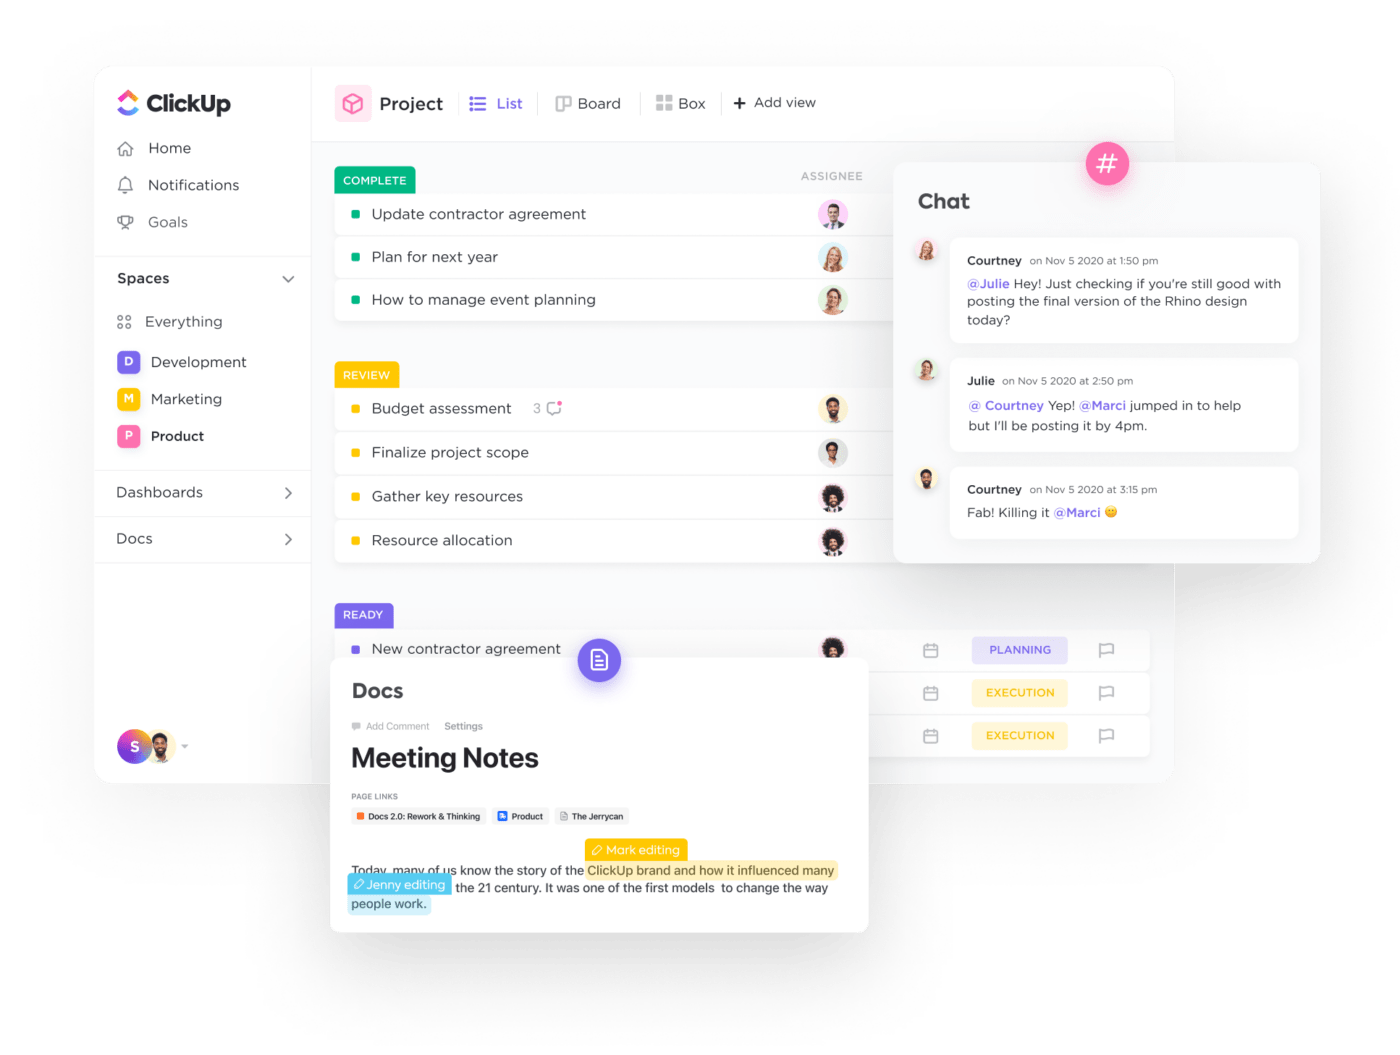
Besides BI tools, you can leverage the robust KPI tracking capabilities offered by ClickUp. This all-in-one project management solution helps you track, organize, and share data within a single platform.
Collecting data
Locating and collecting the data you need to calculate a specific key performance indicator can be challenging, especially if you have to pull the data from multiple sources. And it’s a whole different kind of nightmare if you have to do it manually. In this case, you’ll have to put in time and effort to find a way to store the data in a readily accessible way.
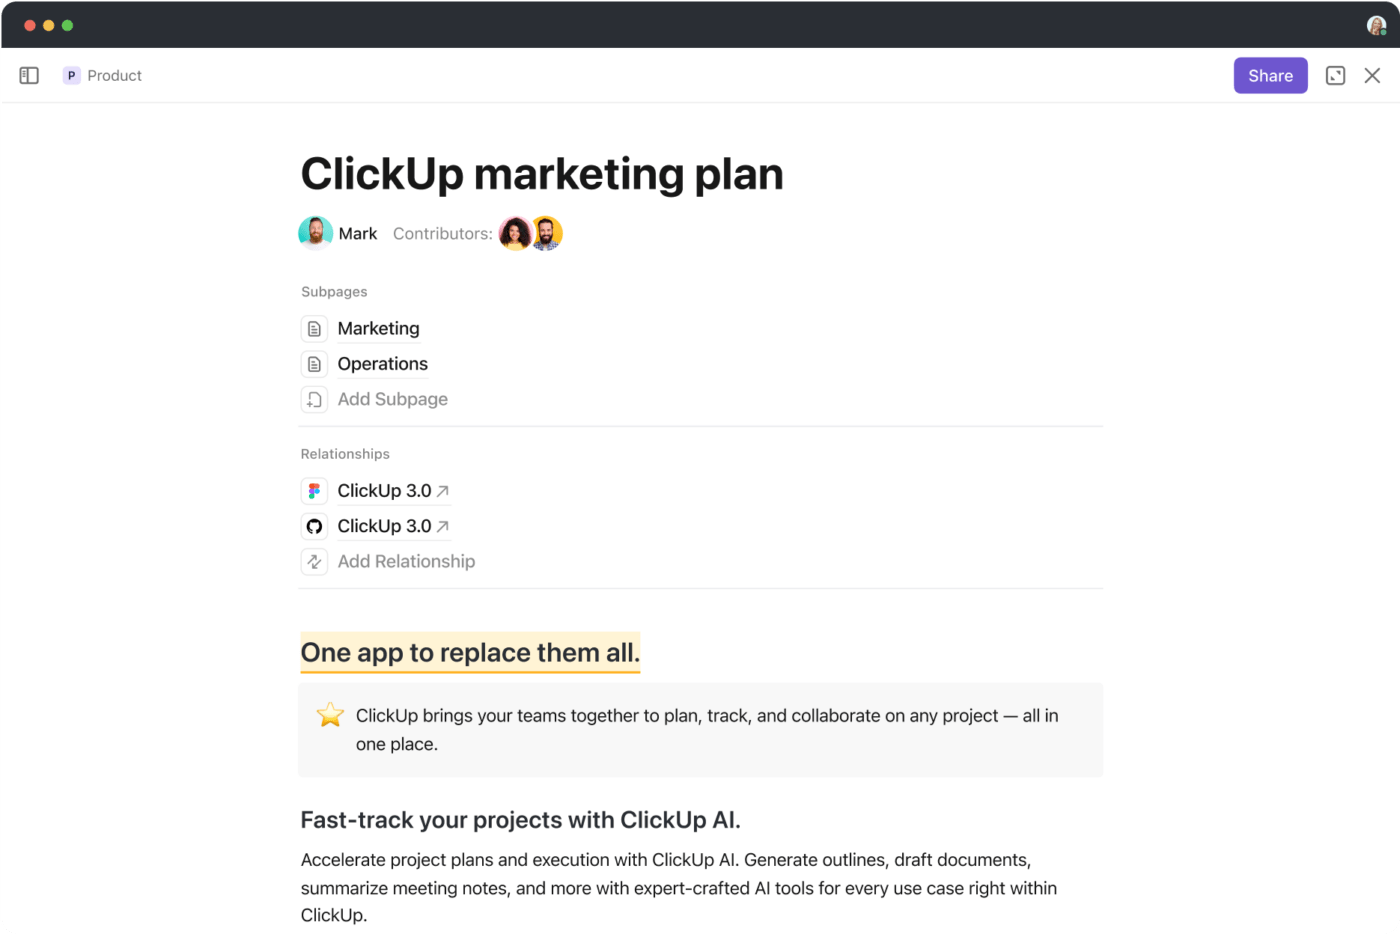
Online document management platforms like ClickUp Docs are a great solution to this issue, as they provide a centralized location to keep your data and reports. Import data from other analytics tools you use and share everything with your team through simple links.
If you’re collecting computational data, use the ClickUp Table view to arrange your data in spreadsheet-style columns. You can add advanced formulas to your data using Custom Fields and calculate the KPIs you need.
How to Track the Most Important SaaS Metrics and KPIs
Tracking SaaS KPIs can be simple as long as you rely on user-friendly SaaS tools for help. ClickUp is an ideal solution for monitoring and organizing all your essential KPIs to see if they meet your performance expectations. ⭐
Using ClickUp Goals is the easiest way to track your SaaS KPIs and their progress. You can break down all your goals into smaller Targets representing your business objectives.
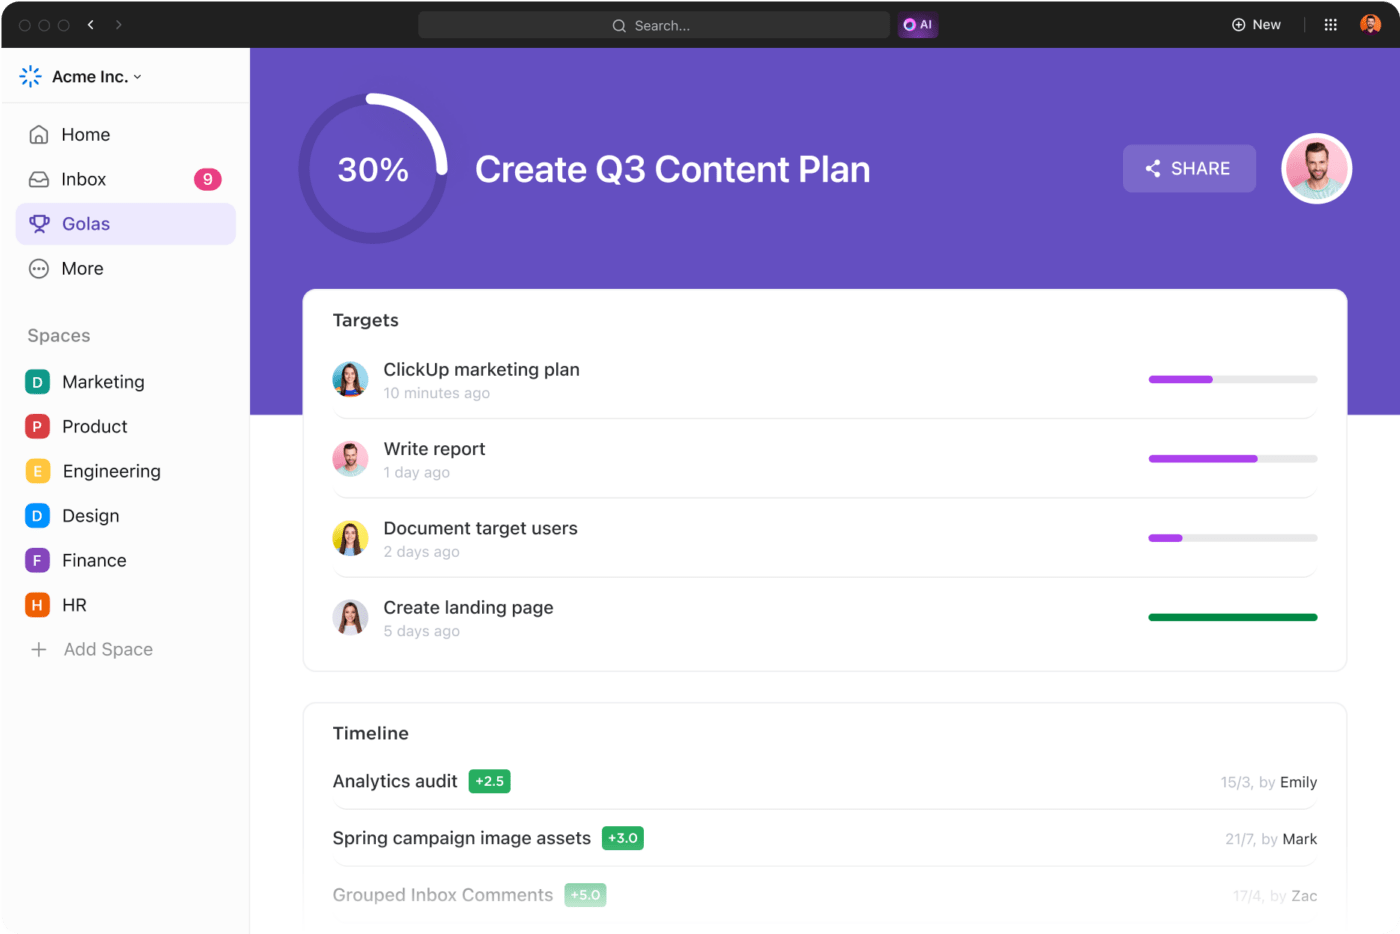
As you complete each target, you’re getting closer to completing your goal, and your progress is updated in real time. ⏳
The best part? You can customize your metrics to measure unique Targets as:
- Numbers: For numerical figures like scores and percentages
- True/false: To track the completion rate in terms of done/not done
- Currency: For metrics like churn rate and profit
- Tasks: To monitor performance based on task completion
To kickstart tracking your KPIs, leverage the ClickUp KPI Template. It provides a Summary List view of all your KPIs categorized by progress, so you can see which ones are:
- On track
- Off track
- At risk
- Completed
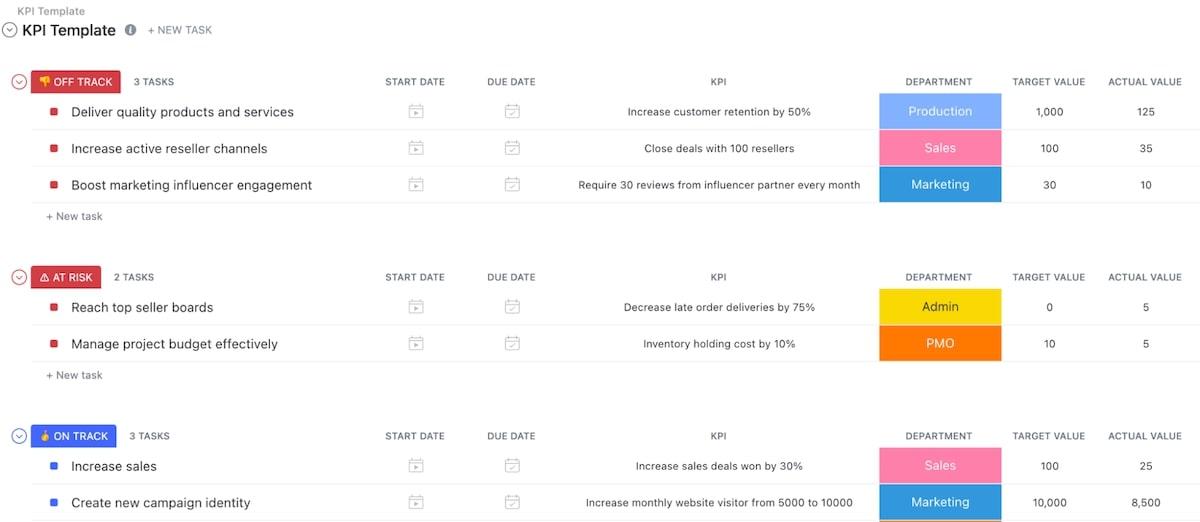
Visualize progress by opening a drag-and-drop Kanban board view and get a better sense of KPI deadlines through the Timeline view.
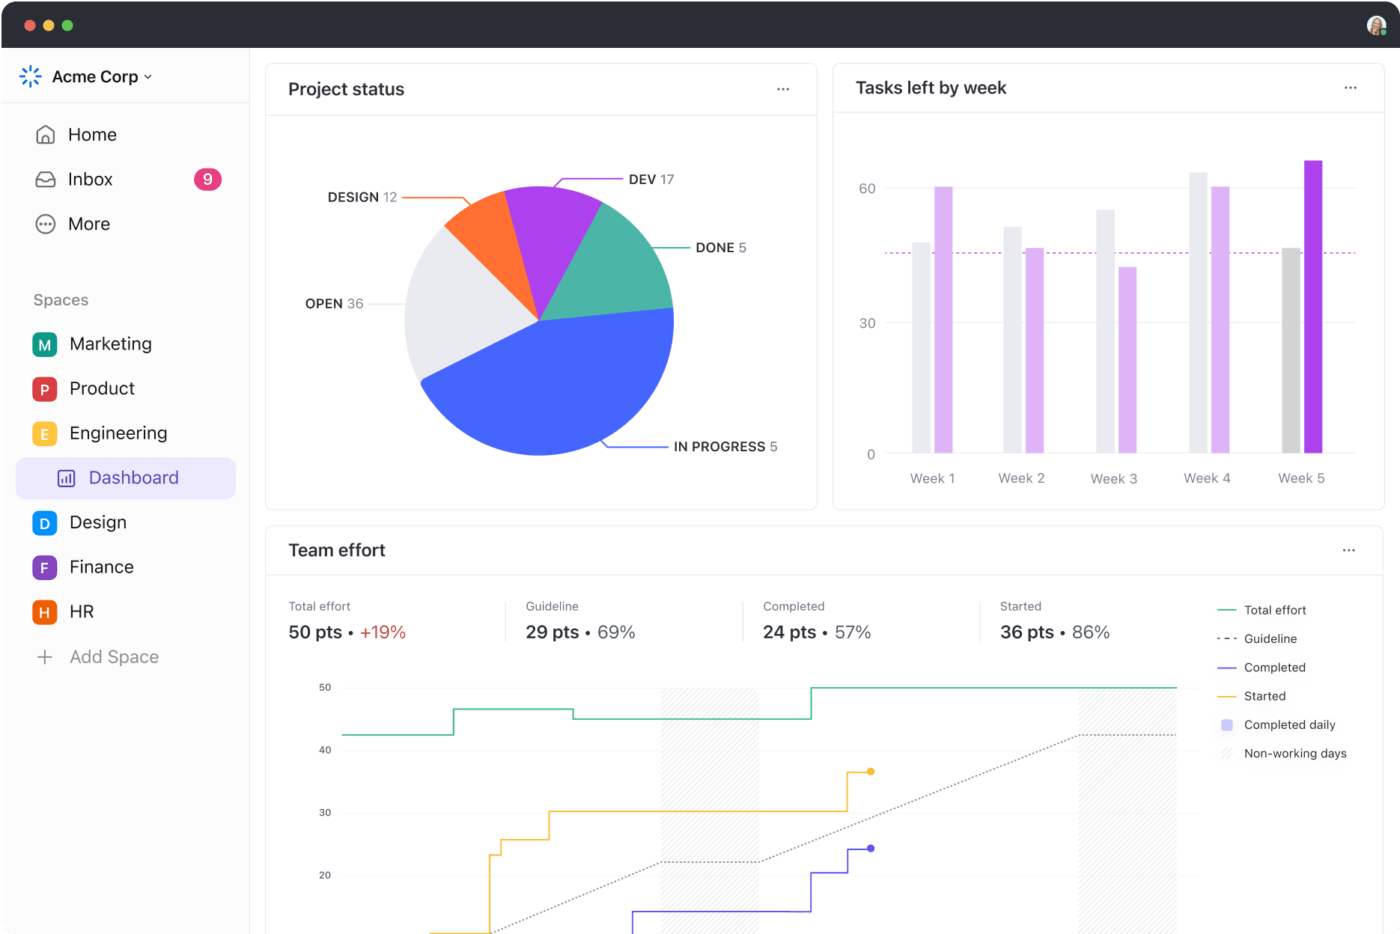
You can also use ClickUp Dashboards as your KPI command center. They are customizable and provide a bird’s eye view of all your KPIs. Include Custom cards (or reports) that monitor your metrics in the style you prefer, be it a line, bar, or pie chart. ?
Track SaaS KPIs Like a Pro with ClickUp
Proper KPI tracking and SaaS business growth go hand in hand—measuring and analyzing KPIs reveals how well your business is performing and helps you steer your decisions in the right direction.
Keep in mind that it’s crucial to continually track and adjust your KPIs if you want your business to keep growing in an ever-evolving market.
To make your KPI tracking journey a breeze, sign up to ClickUp for free today! Leverage its handy KPI templates for a quick start, easily track goals, visualize KPI progress, and use its native CRM functionalities to help your business blossom! ?
Summarizing Common FAQs
1. What is a KPI in SaaS?
Key performance indicators (KPIs) track a company’s performance against its objectives. For both B2C and B2B SaaS companies, KPIs help track the business’s market share or highlight the areas for improvement. Since SaaS business success depends on its subscribers and the future revenue they generate, the most important SaaS KPIs typically have customer-related parameters.
2. What are common SaaS metrics?
The most common SaaS metrics include customer and revenue churn rate, monthly and annual recurring revenue, customer conversion and retention rate, customer acquisition cost and lifetime value, the average revenue per user, and net promoter score.
3. How do you measure the success of SaaS products?
The KPIs you measure and analyze can tell you how successful your business is in various areas. For example, a high customer retention rate (CRR) indicates a large number of active subscribers, which likely means your revenue is also high.


