
Sorry, there were no results found for “”
Sorry, there were no results found for “”
Sorry, there were no results found for “”
Ever found yourself staring at a blank Excel cell, wishing you could just tell it what to do?
Composing a functional Microsoft Excel formula can be a struggle, especially when you’re trying to create formulas that can handle more than simple calculations. It often involves trial and error, which can be frustrating for beginners.
That’s where ChatGPT can help.
It can write Excel formulas with ease, saving you several hours in the process.
Let’s learn how to generate Excel formulas using ChatGPT. We will also explore some essential, advanced formulas for data analysis. 👇
Excel’s strength lies in its versatility. It’s a powerful spreadsheet software for users across various fields, including finance, data science, marketing, etc.
Here are some essential formulas you could use if you’re in any of those fields.
What does it do? Adds up a range of numbers.
Example: To calculate the sum of sales figures from columns A1 to A10 in a spreadsheet.
Formula: =SUM(A1:A10)
What does it do? Calculates the mean value of a range.
Example: Useful for determining the average revenue over a specific period.
Formula: =AVERAGE(A1:A10)
What does it do? Counts the number of cells containing numbers.
Example: You can count how many months have recorded sales figures in a sales sheet.
Formula: =COUNT(A1:A10)
What does it do? It searches for a value in a table and returns related information from another column.
Example: You can look up a stock’s name in one column and return its price from another.
Formula: =VLOOKUP(A2, B2:D10, 3, FALSE)
What does it do? Performs a logical test and returns a value based on the result.
Example: To check if expenses exceed a budget limit and return “Yes” or “No.”
Formula: =IF(A1>1000, “Over Budget”, “Within Budget”)
What does it do? Calculates the payment for a loan based on constant payments and interest rates.
Example: Useful when analyzing monthly payments for different loan amounts.
Formula: =PMT(rate, nper, pv), where:
rate: The interest rate for the loan
nper: The total number of payments for the loan
pv: The present value, or the total amount that a series of future payments is worth now
What does it do? A more flexible alternative to VLOOKUP for searching data in tables.
Example: You can search for a specific value in column A and return data from column B.
Formula: =INDEX(B2:B10, MATCH(A2, A2:A10, 0))
What does it do? Counts the number of characters in a cell.
Example: Use this to check the length of data entries, especially for text fields.
Formula: =LEN(A1)
What does it do? Combines text from multiple cells.
Example: You can merge first names and last names into one cell with a space in between.
Formula: =CONCATENATE(A1, ” “, B1)
What does it do? Converts a vertical range of data to a horizontal one (or vice versa).
Example: Transpose of a column of data into a row to better visualize patterns.
Formula: =TRANSPOSE(A1:A5)
Stop wrestling with complex Excel formulas. ClickUp’s Editable Spreadsheet Template combines familiar grid views with ClickUp Brain’s AI to help you analyze data, generate insights, and automate tasks—no coding needed. Try it for free today!
What does it do? Assigns a rank to each value in a dataset, which is useful for ordered data analysis.
Example: Rank stock prices or customer spending levels from highest to lowest.
Formula: =RANK(A1, A1:A10)
What does it do? Converts numbers to text with formatting.
Example: Use this to format large numbers as currency for presentation purposes.
Formula: =TEXT(A1, “$#,##0.00”)
But its versatility doesn’t stop at data analysis. You can use Excel for reporting. For example, you can summarize large cash flow forecasts to identify trends, patterns, and key insights.
You can also use Excel for project management. For example, you can use features like Gantt charts, tables, and conditional formatting to create project timelines, allocate resources, track task progress, monitor deadlines, and more.
Now, let’s learn how to effectively use ChatGPT to write Excel formulas.
To get started, have both ChatGPT and Excel ready.

When you’re creating financial models, specificity is crucial.
Asking ChatGPT for general formulas might not give you what you need, so be clear with the financial terms you use and provide conditions as needed.
For instance, if you need to calculate the net present value (NPV) of future cash flows, include the discount rate and relevant periods in your request.
Example prompt:
How do I calculate the net present value (NPV) for cash flows in A2 to A7 using a 5% discount rate?
ChatGPT will then generate a formula tailored to your specific needs, like this one:
Generated formula:
=NPV(0.05, A2:A7)

Once ChatGPT gives you a formula, take a moment to review it. Check for the following:
Once you’re satisfied with the formula, it’s time to move it into Excel.
After pasting, hit Enter. Excel will perform the calculation, whether it’s NPV, IRR, or another financial metric.

After you apply your formula, take a look at the results. You’ll want to validate the output by:
If needed, you can adjust the formula by changing cell references or adding additional parameters. For example, you might modify the formula to include only positive cash flows or exclude outliers.
Once you have a working formula, you may want to apply it across multiple rows or columns of data. If you’re analyzing different departments or projects, ChatGPT can generate dynamic formulas that are easily adaptable to your entire financial model.
You can either drag the formula across the relevant cells or ask ChatGPT to craft a specific formula that covers an entire range at once.
Testing is essential, especially in finance. Input different data scenarios to check how well the formula adapts:
If adjustments are necessary, ask ChatGPT for refinements.
For example, if your NPV formula includes negative cash flows that shouldn’t be there, you can prompt: ‘How do I modify the formula to exclude negative cash flows?’
Vague prompts can lead to inaccurate formulas. Always be specific with your requirements. If the formula doesn’t work, revise your prompt for clarity.
Ensure you copy the entire formula correctly without missing any characters. An incomplete formula can result in errors in Excel.
Sometimes, you might need to adjust the ChatGPT prompt to fit your specific data structure. Test thoroughly and iterate as needed.
👀 Bonus: Explore these spreadsheet templates to simplify your workflow and stay organized.
Nested IF statements can be tricky, especially when dealing with multiple conditions. Imagine you have a list of sales data and want to categorize sales performance based on the amount:
ChatGPT prompt: How do I write an Excel formula to categorize sales performance as ‘High’ if the amount is above 1000, ‘Medium’ if between 500 and 1000, and ‘Low’ if below 500?
ChatGPT response: =IF(A1 > 1000, “High”, IF(A1 >= 500, “Medium”, “Low”))
Explanation: Copy this formula and paste it into the target cell in your Excel sheet, replacing A1 with the appropriate cell reference.

Suppose you have sales data and want to create a summary using a pivot table, showing the total sales per region. While Excel has built-in tools for pivot tables, you might need a formulaic approach. Let’s see how:
ChatGPT prompt: How can I write a formula in Excel to summarize total sales per region?
ChatGPT response: =SUMIF(A:A, “Region1”, B:B)
Explanation: This formula sums up the sales in column B where the region in column A matches “Region1.” You can replace “Region1” with other regions or use cell references.

It’s important to validate your data to keep it correct and in order. If you want to restrict the input in a cell to a specific range of values, such as a list of predefined categories (e.g., ‘Approved,’ ‘Pending,’ ‘Rejected’), you can use data validation.
It makes sure that only valid entries from the list are accepted, reducing the chances of errors and maintaining consistency across your data.
ChatGPT prompt: How do I set up data validation in Excel to allow only the values ‘Completed’, ‘Pending’, or ‘On Hold’?
ChatGPT response:
Use the following steps: Select the cell(s), go to Data > Data Validation, choose ‘List’, and enter the values: Completed, Pending, On Hold.
Explanation: Follow the steps provided by ChatGPT to set up data validation in Excel.

Let’s say you want to calculate the number of working days between two dates, excluding weekends and holidays.
ChatGPT prompt: How can I write an Excel formula to calculate the number of working days between two dates in cells A1 and B1, excluding weekends?
ChatGPT response: =NETWORKDAYS(A1, B1)
Explanation: This formula calculates the number of working days between the dates in cells A1 and B1. To exclude holidays, you can add a range of holiday dates as a third parameter.

Imagine you need to combine text and numerical values from different cells into a single cell, formatted nicely. For instance, you want to combine a product name and its price.
ChatGPT prompt: How do I write an Excel formula to combine text from cell A1 and a number from cell B1 with a dollar sign?
ChatGPT response: =A1 & ” costs $” & TEXT(B1, “#,##0.00”)
Explanation: This formula combines the text in cell A1 with the formatted number in cell B1.

Also Read: Best AI Excel Tools for Productivity
While ChatGPT is a handy tool for writing Excel formulas and simplifying complex tasks, it does have limitations. Here are some of them:
Also Read: Top-Notch AI Tools for Data Visualization
📮 ClickUp Insight: 74% of employees use two or more tools just to find the information they need—while jumping between emails, chat, notes, project management tools, and documentation. This constant context-switching wastes time and slows down productivity. As the everything app for work, ClickUp unifies all your work—email, chat, docs, tasks, and notes—into a single, searchable workspace, so everything is exactly where you need it.
Managing your data across two separate tools can quickly get complicated. Constantly switching between platforms often leads to missed information, duplicate entries, or simply a loss of time trying to track everything.
When your data is scattered across different tools, collaboration also suffers, making it harder for teams to stay aligned.
ClickUp eliminates those issues by bringing all your data analysis and management needs into one platform. It offers two powerful features—ClickUp Table View and ClickUp Brain—that can help streamline your data analysis workflow.
Here’s how they can help you.
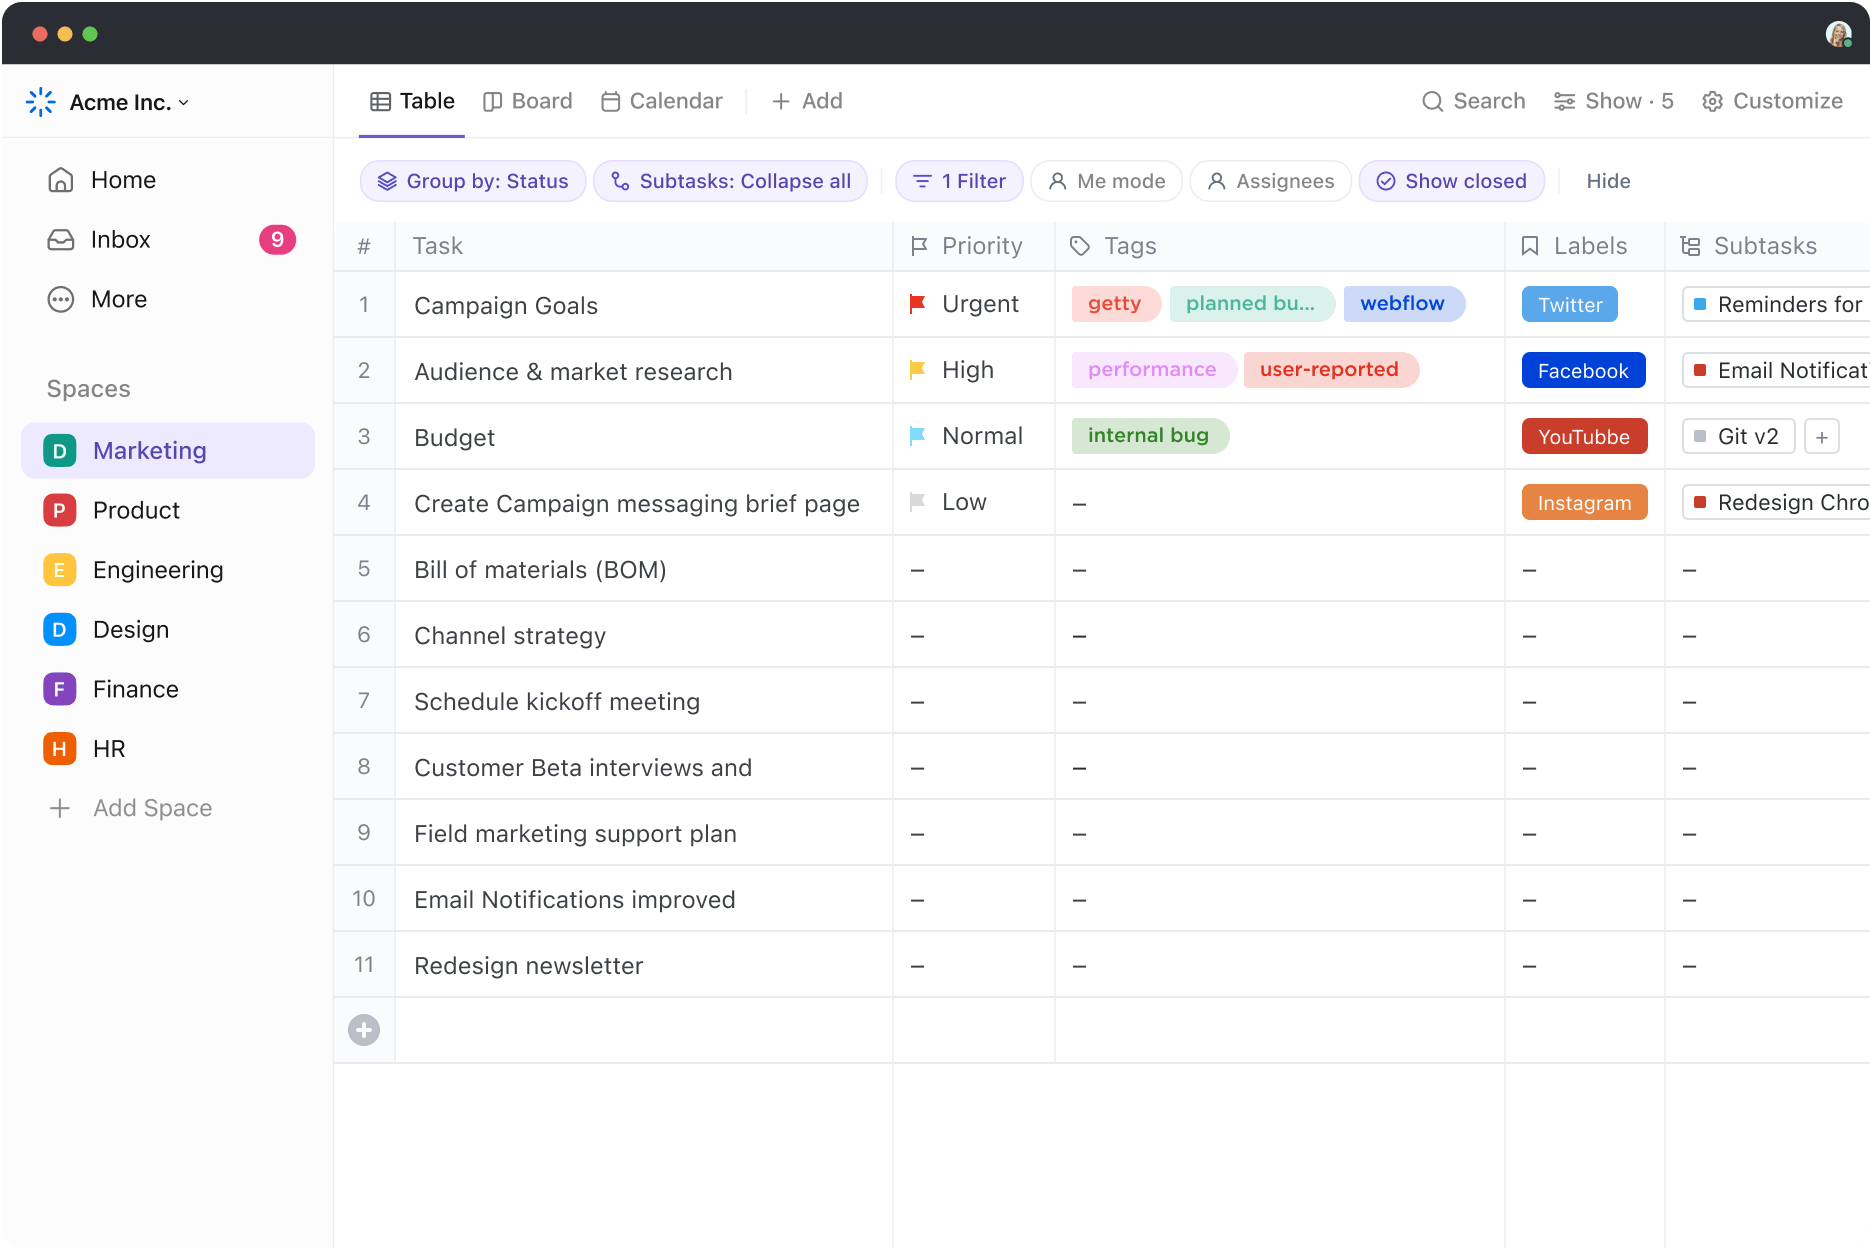
ClickUp Table View brings the familiar feel of a spreadsheet to your project management process, offering an organized and detailed way to handle data.
Unlike a static Excel sheet, Table View supports dynamic data organization. You can create custom fields to track information like task progress, file attachments, or ratings, ensuring flexibility to manage diverse data types across various projects.
That’s just the beginning of its customization capabilities. You can add, rearrange, and resize columns to focus on the most relevant information, enabling you to manage your data in a way that directly aligns with your project’s requirements.
It also works as a great Excel alternative when working with any kind of data.
One of its standout features is bulk editing.
Unlike Excel, where each cell might need individual modification, Table View allows you to select multiple tasks and make changes simultaneously. This can include assigning team members, adding tags, or archiving tasks through the Bulk Action Toolbar.

With its advanced sorting and filtering options, you can group tasks by various criteria such as Status, Priority, or Due Date. This level of control is similar to Excel’s filtering capabilities but integrated directly into your project management workflow.
Additionally, Table View allows data export in CSV or Excel formats, offering you the flexibility to conduct further analysis or reporting outside ClickUp when needed.

Also Read: Best AI Tools for Accounting & Finance
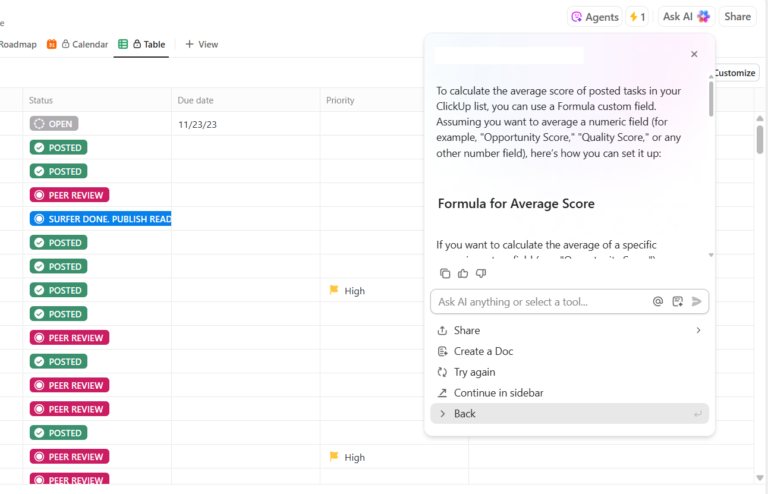
ClickUp Brain takes your data management to the next level with its AI capabilities.
Think of it as your personal data assistant. It can generate complex Excel formulas based on natural language inputs, eliminating the need for manual formula creation.
For example, if you need to calculate average sales or set up conditional formatting, simply describe your requirements. And ClickUp Brain will provide the appropriate formula. Brain can tailor these formulas to your specific project or task needs, providing more precise and relevant solutions than a generic formula generator.

It also stores formulas for easy reuse, ensuring consistency across projects. This makes it simpler to onboard new team members or follow standard project guidelines.
ClickUp Brain goes beyond just formula generation. It also makes it easy to automate your spreadsheet management workflows with its collection of over 100 ClickUp Automations. You can also instantly build new automations using its AI Automation Builder with simple trigger and action inputs, all without requiring any technical knowledge.

👀 Bonus: Learn how to automate Excel to align with your project needs better.
Managing data doesn’t have to feel like a constant struggle with endless clicks and complex formulas.
ClickUp’s Table View and Brain combine the familiar structure of spreadsheets with innovative AI, simplifying how you handle data. Whether you’re organizing tasks or generating Excel formulas, ClickUp makes sure the process is smooth and intuitive.
With ClickUp, you also get a dynamic, all-in-one platform that streamlines task management, automates data analysis, and frees up your time for more important things.
Ready to make the switch?
Sign up for ClickUp today and start working smarter, not harder.
Yes, ChatGPT can handle a wide range of Excel formulas, including nested IF statements, VLOOKUPs, and other commonly used functions. However, it may struggle with more complicated formulas that involve multiple layers of logic or highly customized requirements.
If the formula generated by ChatGPT isn’t working as expected, start by checking for syntax errors, such as missing parentheses or incorrect cell references. Make sure the formula aligns with your specific data structure. If you’re still encountering issues, try rephrasing your query to ChatGPT with more detail.
ChatGPT can assist with basic to moderately complex data analysis tasks, such as generating intricate formulas for calculations, summarizing data sets, and even creating pivot table formulas. However, it may not be ideal for highly advanced data analysis that requires a deep understanding of statistical methods or complex modeling.

Pavitra M
Max 12min read

Praburam Srinivasan
Max 11min read
Pavitra M
Max 10min read

© 2026 ClickUp