


Still downloading templates?
There’s an easier way. Try a free AI Agent in ClickUp that actually does the work for you—set up in minutes, save hours every week.
Sorry, there were no results found for “”
Sorry, there were no results found for “”
Sorry, there were no results found for “”

You can’t improve what you don’t measure. Higher website traffic, and better engagement on social might look good on paper, but do they actually translate into revenue?
Without the right demand generation metrics, it’s easy to chase numbers that don’t move the needle.
So, which metrics actually matter?
In this blog post, we’ll break down the KPIs (key performance indicators) that give you real insight into your demand generation strategies to track what works and tweak what doesn’t.
Demand generation metrics are the quantitative indicators that measure the effectiveness of marketing efforts in generating leads, conversions, and revenue.
These metrics track performance across the entire demand generation process, from the first interaction to the final conversion, giving businesses a clear view of what’s working and what isn’t.
Businesses that focus on these metrics don’t rely on guesswork. They use data to refine their approach, eliminate wasted effort, and double down on what works.
Demand generation metrics provide a clear picture of marketing performance, helping teams optimize campaigns, improve targeting, and ensure every resource contributes to revenue growth rate.
📮 ClickUp Insight: Low-performing teams are 4 times more likely to juggle 15+ tools, while high-performing teams maintain efficiency by limiting their toolkit to 9 or fewer platforms. But how about using one platform?
As the everything app for work, ClickUp brings your tasks, projects, docs, wikis, chat, and calls under a single platform, complete with AI-powered workflows. Ready to work smarter? ClickUp works for every team, makes work visible, and allows you to focus on what matters while AI handles the rest.
Measuring demand generation ensures that marketing efforts drive measurable growth. A strong data-driven approach highlights what works and where improvements are needed.
Here are the key metrics that should stay on every marketer’s radar:
MQLs represent potential customers who have shown interest in a product or service based on engagement levels. These leads meet specific criteria that indicate they are ready for further nurturing.
Actions such as downloading a whitepaper, signing up for a webinar, or engaging with high-intent content often categorize a lead as an MQL.
💡 Pro Tip: Regularly review MQL criteria and adjust scoring to ensure focus remains on the right prospects. Leverage AI-powered predictive analytics to enhance accuracy in MQL identification.
SQLs are those leads that have progressed beyond the MQL stage and are considered ready for direct sales engagement. These have been vetted by both marketing and sales teams and demonstrate a strong intent to purchase.
Understanding the transition from MQL to SQL is crucial, as ineffective handoffs between teams can create friction and result in lost opportunities.
💡 Pro Tip: Compare the ratio of SQLs to MQLs to identify friction points in the qualification process. Implement lead scoring models and automated workflows to optimize this transition.
CPL calculates the cost of generating each lead. This metric reflects the efficiency of lead generation efforts and provides insights into budget allocation. A high CPL may indicate inefficiencies in targeting, messaging, or ad spend distribution.
To reduce CPL without compromising lead quality, businesses must experiment with different acquisition channels, optimize landing pages, and leverage high-performing content.
💡 Pro Tip: Regularly test different creative or targeting approaches to lower CPL without sacrificing lead quality. Use audience segmentation and intent-based marketing to refine targeting.
CPA is an important paid search KPI that measures the total cost required to acquire a paying customer. A lower CPA indicates greater marketing efficiency and profitability.
This metric depends on factors such as conversion rate optimization, integrated marketing strategy, and sales funnel effectiveness. Businesses that continuously optimize their ad creatives, audience segmentation, and retargeting strategies often achieve lower CPAs.
💡 Pro Tip: Instead of a one-off A/B test, set up continuous ‘rotation experiments’ where multiple creative variants cycle in and out. This ongoing micro-optimization refines ad creative and reveals nuanced audience preferences that help drive down CPA.
CLV estimates the total revenue a business can expect from a customer over their entire relationship. A higher CLV justifies higher acquisition costs and supports long-term growth strategies. Businesses that focus on retention, upselling, and personalized customer experiences tend to maximize CLV.
Understanding average customer lifetime value helps businesses benchmark performance and set realistic revenue goals. Offering loyalty programs, personalized recommendations, and proactive customer support enhances this metric.
💡 Pro Tip: Integrate real-time, AI-driven upsell triggers into the purchase process. If a customer nears a reward threshold, prompt them with a relevant add-on and small incentive. This boosts order value, purchase frequency, and CLV.
ROI quantifies the profitability of marketing campaigns. It assesses the effectiveness of campaigns by comparing revenue generated to the cost of execution. A positive ROI signifies that campaigns generate more revenue than they cost, making them sustainable and scalable.
Identifying high-performing channels and reallocating budgets accordingly is crucial for maintaining a strong ROI.
💡 Pro Tip: Run rapid ‘memoryless experiments’ that reset customer exposure each time, eliminating historical bias. This quickly identifies high-ROI tactics to scale across campaigns.
This metric determines how long it takes to recover customer acquisition costs. A shorter payback period improves cash flow and reduces financial risk. Businesses that can quickly recoup their investment in customer acquisition gain the flexibility to reinvest in growth and innovation.
Subscription-based models and recurring revenue streams often shorten the payback period.
💡 Pro Tip: Identify high-value customer segments with shorter payback periods and allocate more budget to acquiring them. Leverage data analytics to refine pricing models and optimize promotional strategies.
Conversion rates measure the percentage of leads that take a desired action, such as signing up, making a purchase, or scheduling a demo.
Optimizing conversion rates enhances overall marketing efficiency. Strategies such as A/B testing, improving user experience, and leveraging personalized content contribute to better conversion rates.
💡 Pro Tip: Use behavioral data to segment audiences and personalize messaging. Higher relevance often leads to improved conversion rate metrics. Optimize CTAs and streamline the customer journey for seamless interactions.
This metric tracks the time required for a lead to progress from the first interaction to purchase. A long cycle may indicate friction points that slow down conversions. Reducing this length often involves improving lead nurturing, simplifying decision-making, and streamlining sales processes.
💡 Pro Tip: Identify bottlenecks in the process and streamline demand gen efforts to shorten the cycle length. Utilize marketing automation to maintain consistent engagement and accelerate decision-making.
Brand sentiment analyzes how customers perceive a brand across social media, reviews, and surveys. A positive sentiment correlates with higher trust and engagement, which often translates to increased conversions and customer loyalty. Monitoring sentiment allows businesses to respond proactively to customer concerns and reinforce brand reputation.
💡 Pro Tip: Monitor sentiment in real time and address negative feedback promptly to maintain a strong brand reputation. Engage in active community management and leverage influencer partnerships to enhance positive sentiment.
This metric evaluates how efficiently leads convert into customers. A low ratio may suggest sales follow-ups, lead qualification, or customer journey optimization issues.
Businesses that align marketing and sales efforts, implement targeted nurturing campaigns, and refine audience segmentation often achieve higher conversion efficiency.
💡 Pro Tip: Strengthen lead nurturing strategies by personalizing outreach efforts based on customer behavior and intent signals. Leverage AI-driven insights to predict conversion likelihood and tailor engagement accordingly.
Tracking demand generation goes beyond basic metrics. A deeper analysis of activations, conversions, and revenue contribution helps refine strategies for sustainable growth. These additional key metrics provide a comprehensive picture of performance.
Signups indicate initial interest, but activations measure actual engagement. A lead that signs up but never interacts further holds little value.
Activations track how many users complete meaningful actions, such as setting up an account or using a core feature. A strong activation rate suggests an effective onboarding process and a product that resonates with users.
🔍 Did You Know? In 2011, Coca-Cola launched the ‘Share a Coke’ campaign in Australia, replacing its iconic logo with 150 of the country’s most popular names on their bottles. This personalized marketing strategy led to a 7% increase in sales among young adults in Australia.
Marketing channels do not perform equally. Some drive high-intent leads, while others attract casual browsers.
Close rate per channel reveals which sources convert best, helping allocate budgets more effectively. A lower close rate may indicate a disconnect between audience expectations and the sales approach.
This metric measures how much of the sales pipeline originates from marketing efforts. A strong marketing sourced pipeline indicates that demand generation campaigns successfully attract high-quality leads.
A weak contribution suggests the need for better targeting, stronger messaging, or improved alignment between marketing and sales teams.
🧠 Fun Fact: 57% of marketers are increasing ABM (account-based marketing) spending, and 54% are investing more in content marketing. With content overload everywhere, targeted, high-value content is now key to standing out!
Average deal size tracks the typical revenue generated per closed deal. Larger deal sizes often result from targeting enterprise clients or successfully upselling additional services. Monitoring this metric helps refine pricing strategies and identify opportunities to maximize contract value.
Marketing should drive a measurable impact on revenue. This metric quantifies how much revenue originates from demand generation initiatives. A rising contribution signals strong campaign effectiveness, while a declining share suggests the need for strategic adjustments.
🔍 Did You Know? 83% of marketers say conversions are the top indicator of content marketing success, followed by website traffic (70%) and lead quality (66%). Yet, 72% struggle to track buying intent, making it harder to create the right content at the right time.
Strong demand generation depends on tracking the right metrics and making continuous improvements. Refining these metrics ensures marketing efforts contribute directly to business growth. Here are key strategies to enhance performance.
Every metric should tie back to overarching business goals. Vanity metrics may look impressive but add little value. Prioritize revenue-driven indicators like:
Generating high volumes of leads means little if they lack intent. Filtering out unqualified leads improves efficiency and ensures that sales teams focus on prospects with a higher likelihood of conversion. Nurturing qualified leads through personalized outreach increases conversion rates.
Improve lead quality by:
📖 Also Read: Top Lead Management Software
Markets evolve, customer behaviors shift, and what worked yesterday may not be relevant today. Routinely evaluating performance metrics ensures continued relevance. Rather than reacting to individual fluctuations, focus on long-term trends to sustain success.
Using ROI templates helps track returns effectively, ensuring every effort contributes to measurable growth. Regularly review performance to:
Decisions based on assumptions often lead to wasted resources. Tracking real-time performance, analyzing conversion trends, and using A/B testing provide clarity on what resonates with the audience. Data-backed insights enable:
Additionally, predictive analytics improves forecasting accuracy and refines audience segmentation. You can leverage machine learning models to help identify potential high-value customers before they convert.
Implementing KPI reporting and behavior analysis improves conversion rates and maximizes return on investment.
Content remains a powerful driver of demand generation. Ensuring that content aligns with customer pain points and interests improves engagement.
A mix of thought leadership, case studies, interactive formats, and personalized recommendations keeps prospects engaged throughout their buying journey.
Remember to track content marketing KPIs for effective performance measurement.
A seamless experience improves retention and brand perception. Optimize the customer journey by:
Customers who receive timely, relevant engagement contribute to higher lifetime value.
Marketing should drive measurable pipeline growth. Better pipeline contribution means marketing efforts directly impact revenue growth. OKR templates can help align teams on demand generation goals, ensuring every campaign contributes to pipeline success. Strengthen the link between sales and marketing by:
Evaluating demand generation efforts requires a clear approach to tracking performance. Metrics provide valuable insights, but understanding how to interpret them ensures smarter decision-making. Here’s how to measure success effectively.
Marketing budgets should drive measurable outcomes. Return on marketing investment (ROMI) helps determine how effectively campaigns contribute to revenue. The formula for calculating Return on Marketing Investment (ROMI) is:
ROMI = (Revenue from Marketing – Marketing Costs)/Marketing Costs
A positive ratio indicates that campaigns are delivering value, while a low return signals the need for strategic adjustments.
Click-through rate (CTR) measures engagement, showing how many users take action after seeing an ad, email, or landing page. A low CTR suggests that messaging needs refinement or targeting requires improvement. Higher CTRs indicate strong audience interest and effective campaign execution.
Net Promoter Score (NPS) evaluates customer sentiment. It categorizes customers into promoters, passives, and detractors based on their likelihood to recommend a brand.
A high NPS reflects strong customer satisfaction, leading to increased referrals and organic growth. Tracking shifts in NPS over time reveals the long-term impact of marketing efforts on brand perception.
Data alone holds little value without actionable insights. Analyzing trends across multiple metrics uncovers patterns in customer behavior, campaign performance, and conversion rates.
Comparing results against benchmarks highlights strengths and areas needing improvement. Aligning findings with business goals ensures marketing strategies focus on outcomes that drive revenue and engagement.
Tracking demand generation performance requires more than just basic analytics. Advanced product-led growth software tools help marketing teams go beyond surface-level metrics, offering deeper insights into campaign performance, lead quality, and revenue impact.
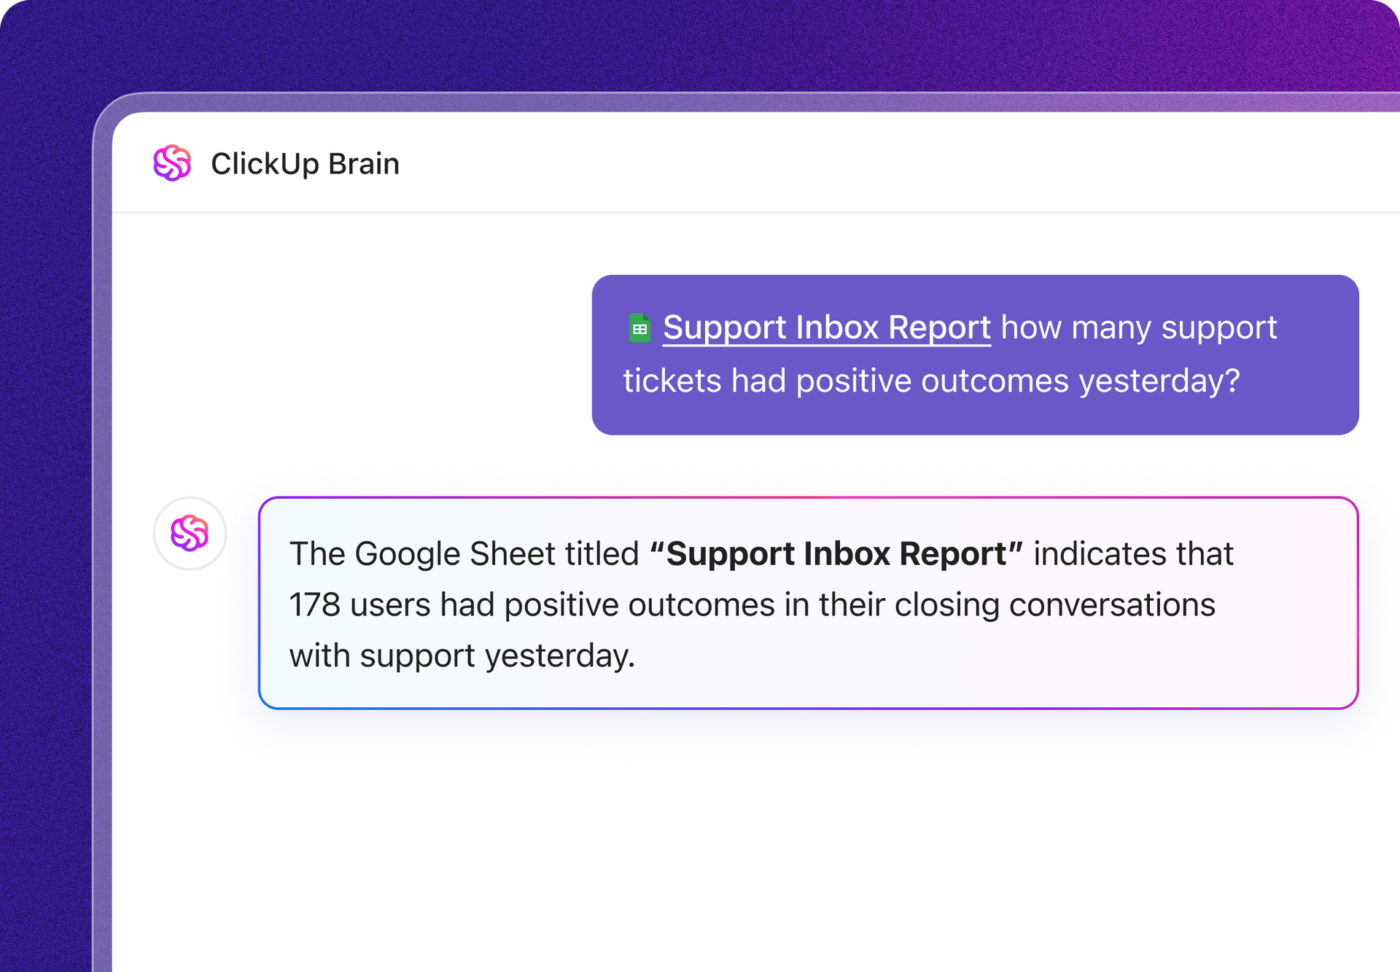
ClickUp is the everything app for work that combines project management, knowledge management, and chat—all powered by AI that helps you work faster and smarter. Its marketing-friendly features make it easy to track KPI metrics, automate workflows, and visualize data in real time.
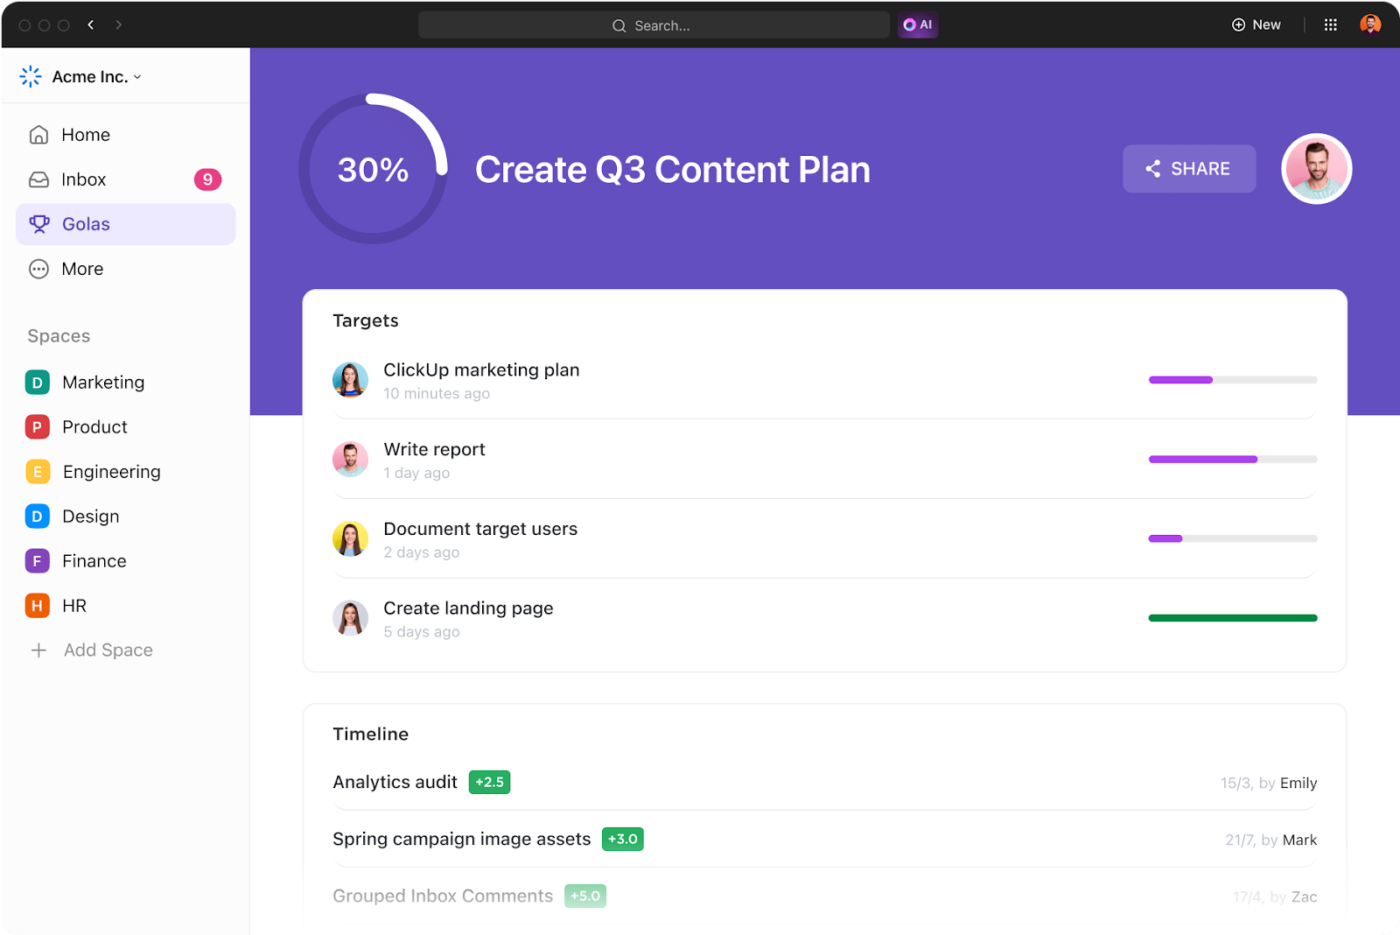
ClickUp Goals lets teams set measurable targets and track progress in one place. Goals link directly to tasks, ensuring that marketing efforts align with overall demand generation objectives.
Suppose a marketing team wants to increase qualified leads by 20% over the next quarter.
Using Goals, they can set a target, break it down into milestones, and track achievements in real time. Each milestone updates automatically as linked tasks progress, eliminating the need for manual tracking.
Plus, goal-setting templates can streamline this process, providing a structured approach to defining and measuring success.
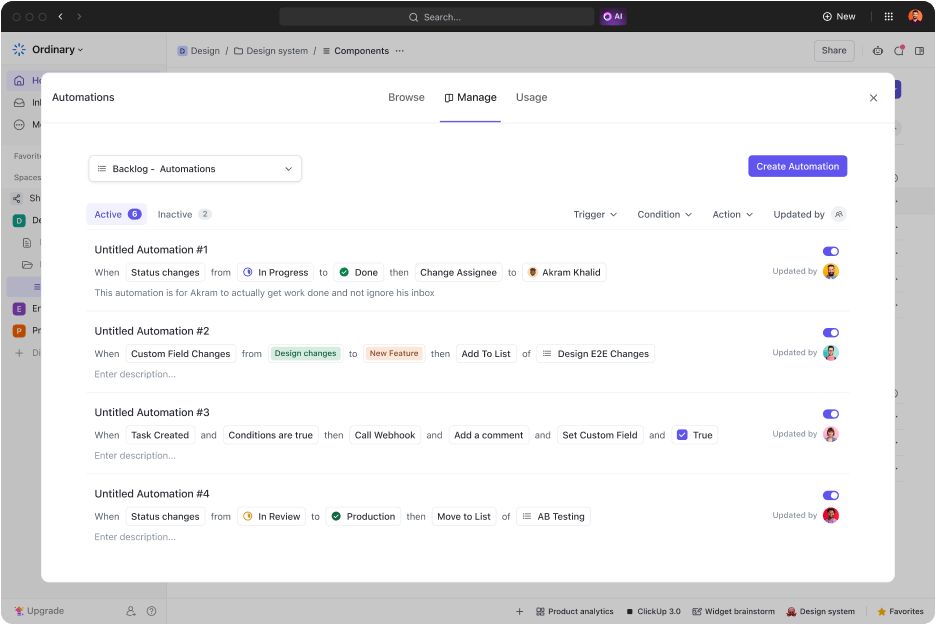
ClickUp Automation removes repetitive tasks, allowing teams to focus on strategy rather than manual updates. Custom rules trigger actions based on predefined conditions, streamlining lead tracking and campaign management.
Let’s say a team runs multiple lead capture forms across different platforms.
Automations can assign leads to specific team members based on source, add them to relevant lists, and update statuses as they move through the funnel. This ensures no potential customer goes unnoticed, improving response times and conversion rates.
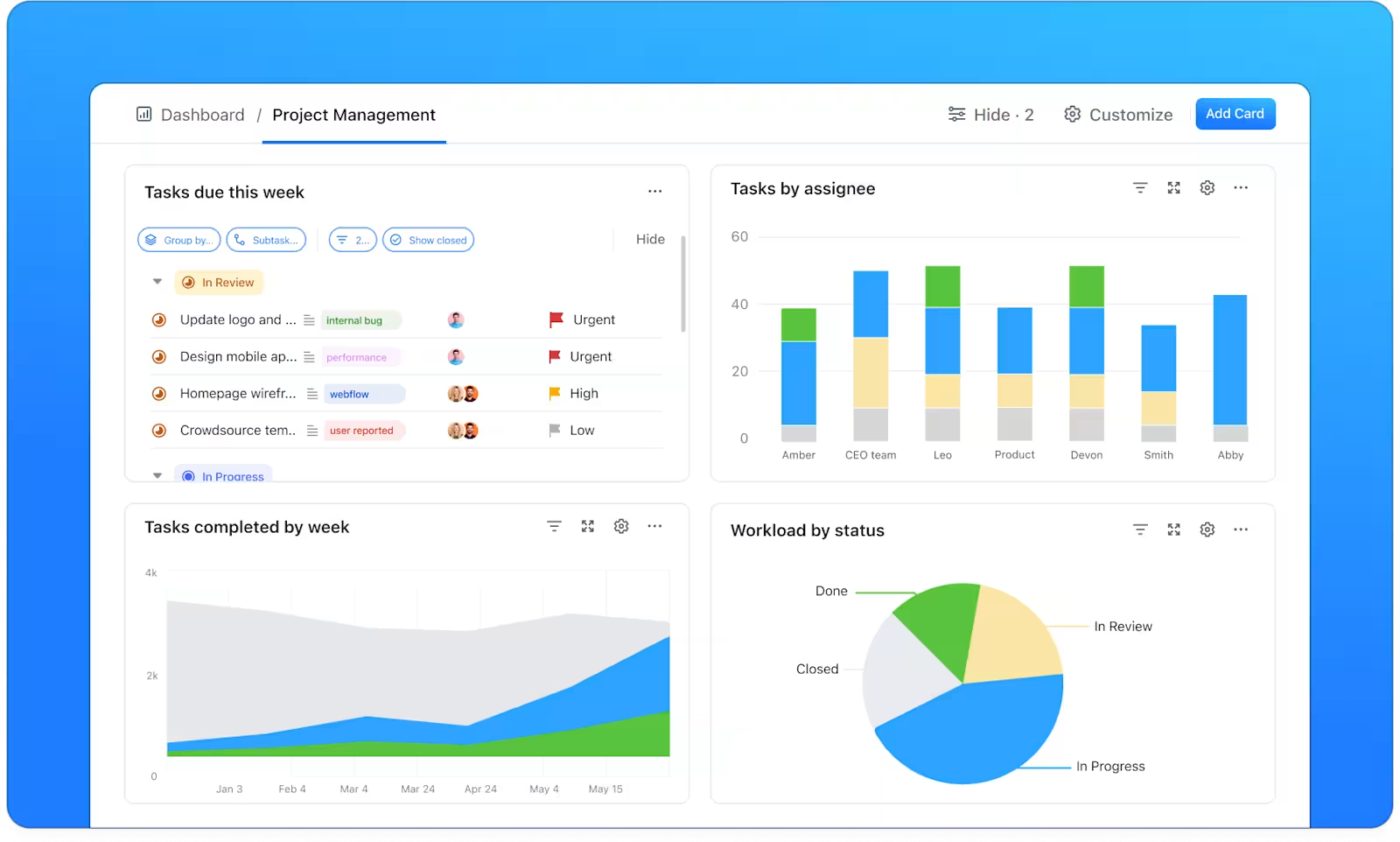
ClickUp Dashboards bring all marketing KPIs into a single view, offering live updates on campaign performance, lead quality, and ad spend.
Customizable cards display data in various formats, from line graphs to bar charts, making it easy to identify trends and adjust strategies accordingly.
For example, a demand generation team tracking CPL and ROAS can create a dashboard showing both metrics side by side. If CPL spikes unexpectedly, the team can quickly investigate underperforming channels and reallocate budget to more effective campaigns.
ClickUp also offers pre-built analytics templates to simplify demand generation tracking.
One such template is the ClickUp KPI Template which provides a structured approach to monitoring key metrics, ensuring teams stay aligned on performance goals.
What sets this template apart is its pre-configured custom views, each designed for different tracking needs:
Demand generation comes with its share of challenges. Tracking metrics, analyzing data, and ensuring accurate performance measurement often become obstacles that affect marketing KPIs. Addressing these challenges improves efficiency and drives better results.
Many businesses struggle with tracking the right metrics. Vanity metrics like website traffic or social media likes may create an illusion of success but fail to reflect real business impact.
Without a clear connection to revenue, these numbers lead to poor decision-making. Standardizing tracking methods and focusing on conversion-related KPIs ensures more reliable insights.
Interpreting data presents another difficulty. Massive datasets often contain incomplete, misleading, or fragmented information. Poor integration between platforms further complicates analysis, making it difficult to draw actionable conclusions.
A centralized analytics dashboard and AI-driven tools help clean, structure, and interpret data effectively.
🤝 Friendly Reminder: Demand generation isn’t just about converting warm leads; it’s also about turning unknown prospects into engaged audiences. Without awareness-building, you’re not just limiting leads—you’re limiting future opportunities.
Accurate performance measurement requires the right framework. Multi-touch attribution models reveal how different touchpoints influence conversions, while real-time analytics provide instant feedback on campaign performance.
Regular audits help maintain tracking accuracy, ensuring that insights remain reliable and actionable.
If you’re serious about your demand generation metrics, tracking the right KPIs isn’t just a nice-to-have—it’s the key to scaling with confidence. No fluff, no guesswork—just clear insights into what’s working and what’s not.
Most teams get lost in spreadsheets and dashboards that look fancy but don’t actually help them make decisions. That’s where ClickUp comes in.
ClickUp Goals help you set and track performance targets, while ClickUp Dashboards bring real-time data into one centralized view. Plus, with ClickUp Automations, you can streamline workflows and eliminate manual tracking so you can focus on what truly moves the needle.
Sign up for ClickUp and start making moves today.

© 2026 ClickUp

There’s an easier way. Try a free AI Agent in ClickUp that actually does the work for you—set up in minutes, save hours every week.