


Still downloading templates?
There’s an easier way. Try a free AI Agent in ClickUp that actually does the work for you—set up in minutes, save hours every week.
Sorry, there were no results found for “”
Sorry, there were no results found for “”
Sorry, there were no results found for “”

Anyone who’s worked in coding knows that software testing and fixing errors takes up a huge chunk of development time (the bugs never seem to end!). In fact, according to a study, poor software quality costs the US economy at least $2.41 trillion.
The solution? Using code coverage tools to test every aspect of the code in any software project. This is especially useful when there have been significant code modifications or reorganizations done. You can also use these tools to fix gaps in your key functionality tests before they cause bugs or failed test runs.
In this article, we’ll dive into the top code coverage tools, how they work, and how they can help you improve test coverage and ensure your code is reliable and production-ready.
Here’s a quick comparison of the best code coverage solutions to help you choose the right fit:
| Tool | Best For | Key Features | Pricing* |
| ClickUp | Workflow routing and team collaboration | AI document creation, contextual assistance, OCR integration, automations, templates | Free plans; customizations for enterprises |
| JaCoCo | Java project code coverage | Line and branch coverage, Eclipse and Maven support, offline instrumentation | Free |
| Cobertura | Legacy Java codebases | Statement and branch coverage, Ant/Apache Maven integration | Free |
| SonarQube | Code quality and continuous inspection | Test coverage visualization, bug detection, code smells, multi-language support | Free; Paid plans starting from $65/month per user |
| Istanbul (nyc) | JavaScript/TypeScript projects | Branch/line/function coverage, integrates with Mocha/Jest, HTML reports | Free |
| OpenClover | Commercial support for Java code coverage | Per-test coverage, historical data, branch/path analysis | Custom pricing |
| NCover | .NET and C# teams needing detailed metrics | Sequence point coverage, trend visualizations, risk hot spots | Paid plans starting from $658/year per user |
| dotCover | JetBrains ecosystem and .NET integration | Continuous testing, snapshot analysis, ReSharper integration | Paid plans starting from $49.6/month per user |
| Codecov | Cloud-based coverage reports across CI tools | Pull request comments, badge support, GitHub/GitLab/Bitbucket integration | Free; Paid plans starting from $5/month per user |
| Gcov | Native C/C++ codebases with GCC | Line-level coverage, gprof integration, simple CLI tool | Free |
| Visual Studio Code Coverage | Integrated .NET coverage for Visual Studio | Part of test explorer, line/block coverage, CI compatibility | Paid plans starting from $499.92/month per user |
| BullseyeCoverage | Embedded systems and C/C++ projects | Condition/path/decision coverage, minimal overhead | Custom pricing |
| Coverage.py | Python codebases | Line and branch coverage, HTML reports, CI integration, test runner support | Free |
Our editorial team follows a transparent, research-backed, and vendor-neutral process, so you can trust that our recommendations are based on real product value.
Here’s a detailed rundown of how we review software at ClickUp.
Discussions around code coverage tools on community platforms like Reddit often start with “I’m looking into code coverage tools, and I’m curious what everyone else is using.”
As you dive deeper into the options, it becomes clear just how many systems are available, and it can be overwhelming for first-time users to make a choice. To help you narrow down your choice, the best code editors cover the following bases:
📖 Also Read: Best Large Language Models (LLMs)
Here are 13 top-rated code coverage tools that can improve your testing procedures and guarantee consistent code quality throughout your development process by providing accurate code coverage results.
Software development teams often face challenges in managing test coverage, tracking bug fixes, and conducting code reviews when all their processes are scattered across different tools.
This is where ClickUp’s integrations and AI-enabled features significantly benefit your team by centralizing all your work in one platform, which helps teams move faster.
Here’s how software teams using ClickUp keep their testing and development processes organized:
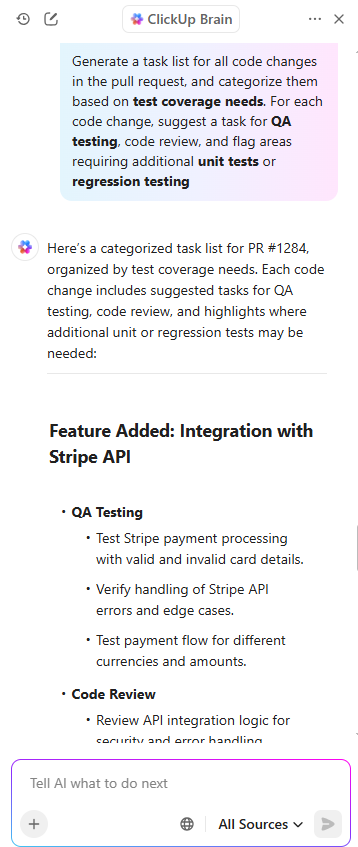
ClickUp Brain takes your QA process to the next level. It can automatically summarize test results, highlight gaps in coverage, and answer questions like “Which areas of our codebase need more testing?”—all in plain language. With AI-powered insights, your team can identify issues more quickly, make informed decisions, and keep your releases on track.
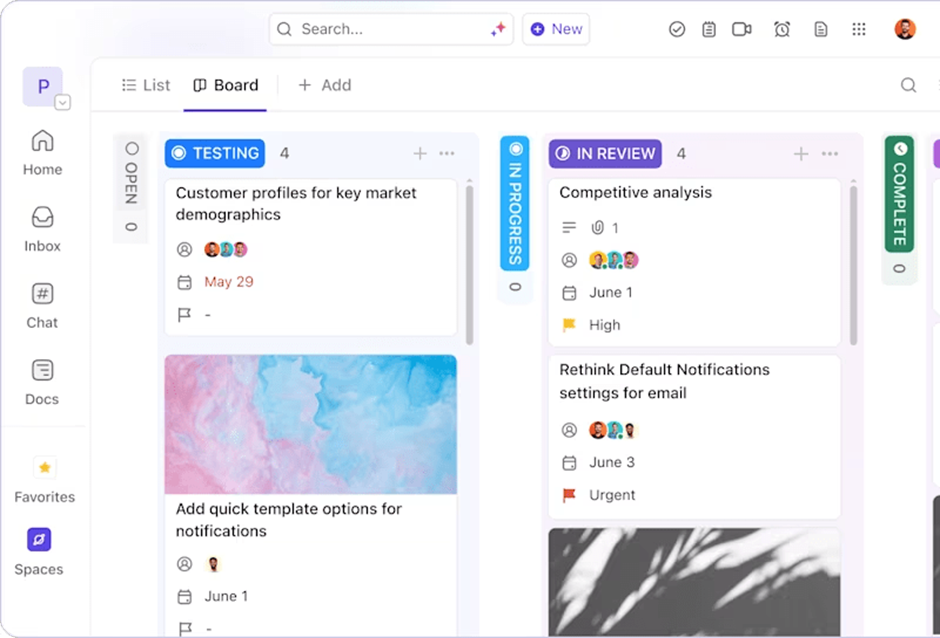
In ClickUp, every piece of work starts as a task.
With ClickUp Tasks, you can create custom workflows that match your team’s process, with statuses like “Ready for QA,” “In Review,” or “Blocked.” Assign tasks to specific team members, set due dates, and attach relevant files or links (like test cases or pull requests).
When a developer finishes a feature, they simply move the task forward, and ClickUp can automatically notify the right reviewers or QA engineers. This means no more “Did you see my message?” or “Who’s testing this?” confusion.
This ensures that everyone remains in sync and allows for the tracking of test coverage at every stage of the process.
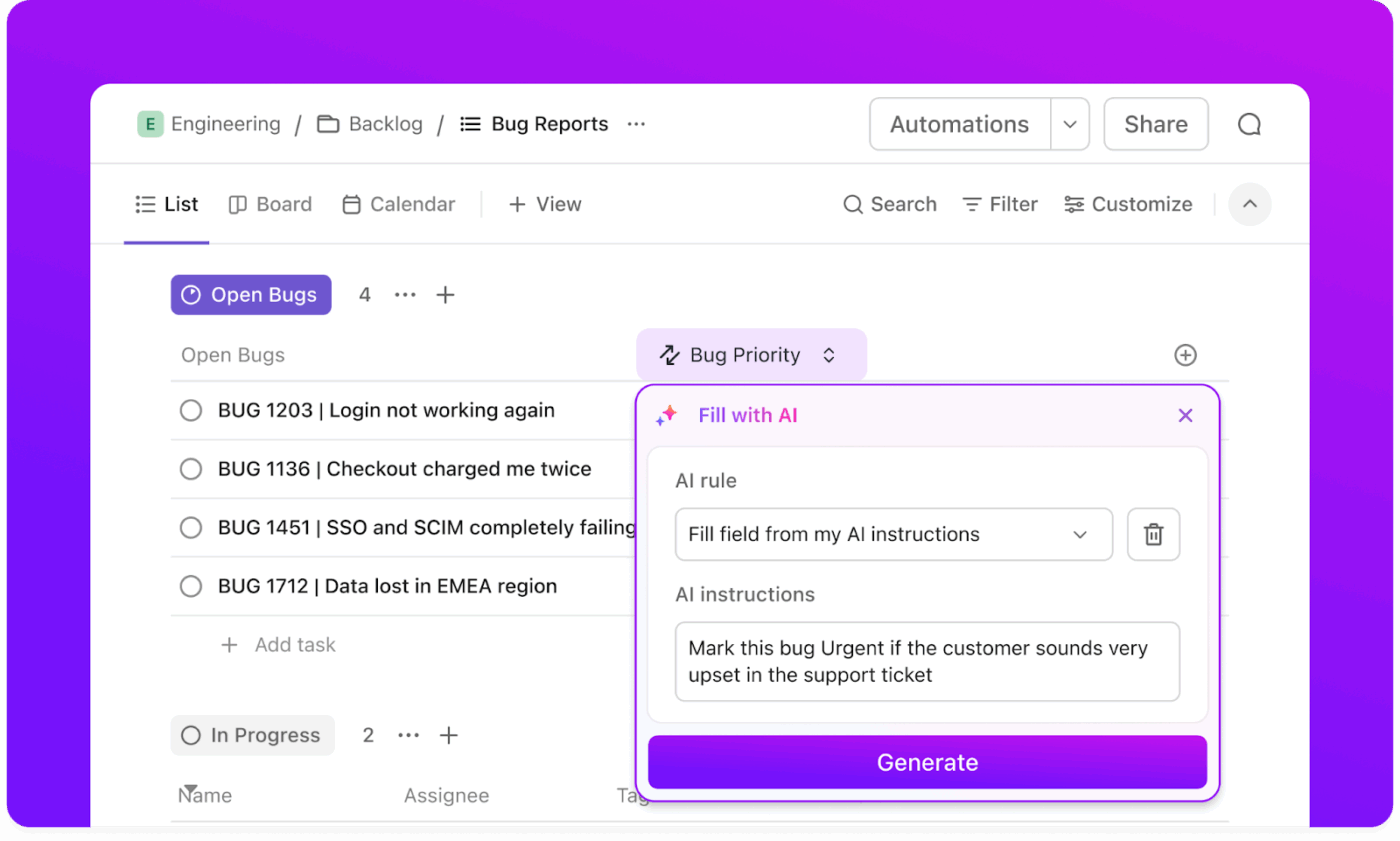
Nobody enjoys manually updating task statuses or chasing people for reviews. ClickUp Automations and AI agents handles the repetitive stuff for you.
For example, when a pull request is merged in GitHub or GitLab, ClickUp can automatically update the related task, assign it to QA, or even trigger a checklist for regression testing.
You can set up automations to remind team members about overdue tests, escalate blockers, or move tasks to the next stage.
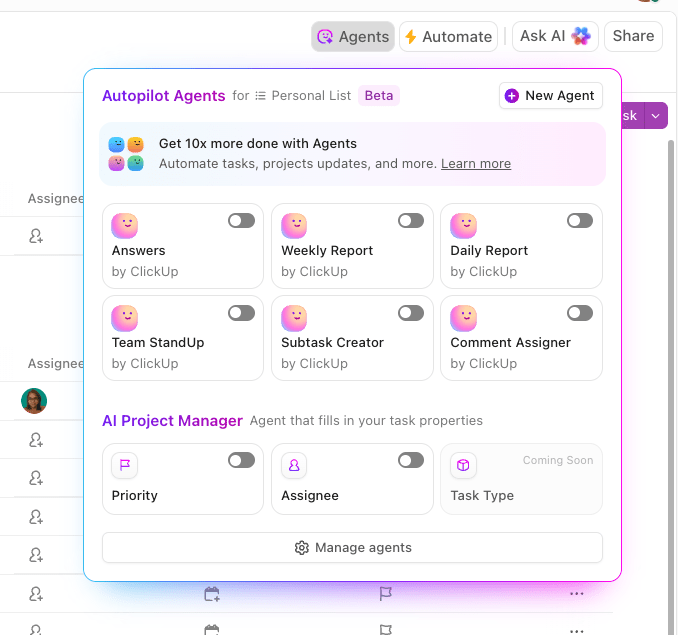
💡 Pro Tip: Use ClickUp AI Agents to supercharge your QA workflow. For example, you can set up an AI platform to automatically analyze your test coverage reports and flag modules with low coverage or even generate summaries of recent QA activity for your daily standup.
ClickUp’s integrations with GitHub and GitLab bring together version control and task management into a unified platform. When you link your pull requests to ClickUp tasks, you can track the status of code reviews and QA sprints in one place.
For example, developers can easily see which test cases are linked to a specific pull request, while QA engineers can directly track progress and updates as tests are run. This integration guarantees alignment among all parties, eliminating the need for constant tool switching.
💡 Pro Tip: You can connect ClickUp with over 1,000 tools like GitHub, GitLab, Jira, and Slack to track commits, code reviews, test cases, and project updates in real time. Manage dev workflows, QA cycles, and team collaboration inside ClickUp without switching between apps.
This G2 review shared:
The ease in how you can document the work step by step by adding images, links, programming code, is versatile (with ClickUp).
📖 Also Read: Free Bug Report Templates & Forms for Bug Tracking
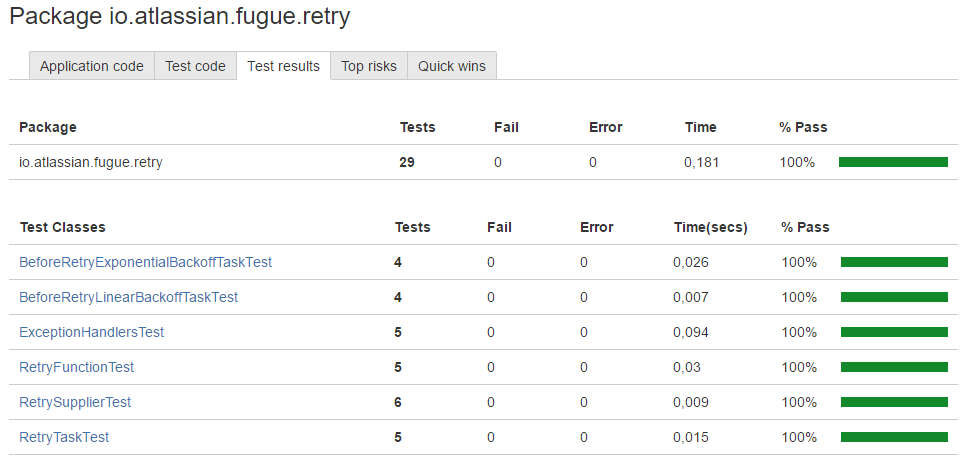
In Java development, ensuring that your code is thoroughly tested can be a major challenge. Despite the abundance of testing tools, determining if all aspects of your application have received sufficient testing can be challenging.
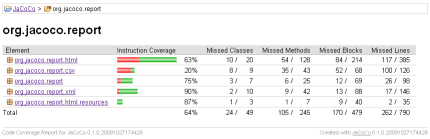
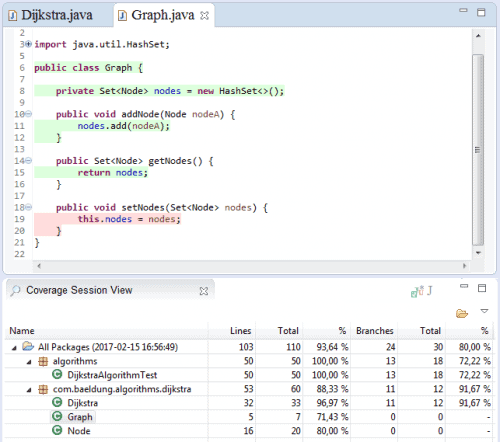
That’s where JaCoCo comes in for Java developers.
This open-source Java code coverage tool simplifies the process of measuring test coverage by offering detailed and reliable insights into how much of your code is tested during the execution of unit tests.
This G2 review noted:
We can verify how many lines of code are executed and how many lines of code are not executed in unit testing. We can make sure our business logic is working as expected.
👀 Fun Fact: The term “bug” to describe a programming error originated from a real-life moth that got stuck in a relay of the Harvard Mark II computer in 1947.
Achieving comprehensive test coverage can be a daunting task.
The challenges are many: managing complex codebases, ensuring that every method and branch is tested, and integrating coverage and AI code tools seamlessly into existing workflows.
Cobertura specifically tackles these pain points by offering a simple, open-source solution that makes code coverage tracking more accessible and efficient. It also supports integrations with major tools and generates reports with a few clicks.
A user says:
Cobertura is the best coverage tool I’ve ever used! It doesn’t miss anything (which is Clover’s problem), and it doesn’t incorrectly mark covered code as uncovered (which is EMMA’s problem). The only remaining problem I have is that one test method is too big, and I can break it up as a workaround. I’m going to push to have this used where I work. This deserves to have an Eclipse plug-in.
📮 ClickUp Insight: Nearly half of all workers have considered using automation but haven’t acted on it yet.
Why? Factors such as overloaded schedules, an abundance of tool options, and a lack of clarity about where to start often hinder the process.
ClickUp helps simplify that first step with easy-to-set-up AI agents and natural language commands. Whether you want to auto-assign tasks or generate project summaries with AI, you can start building smart automations—without a steep learning curve.
💫 Real Results: QubicaAMF reduced its reporting time by 40% using ClickUp’s dynamic dashboards and automated charts, turning hours of manual work into instant insights.
📖 Also Read: 10 Best Code Editors for Developers
Did you know that nearly 63% of applications contain flaws in their first-party code, and 70% have issues with their third-party code?
Addressing these issues early is critical to maintaining high code quality and ensuring that your applications remain secure as they scale.
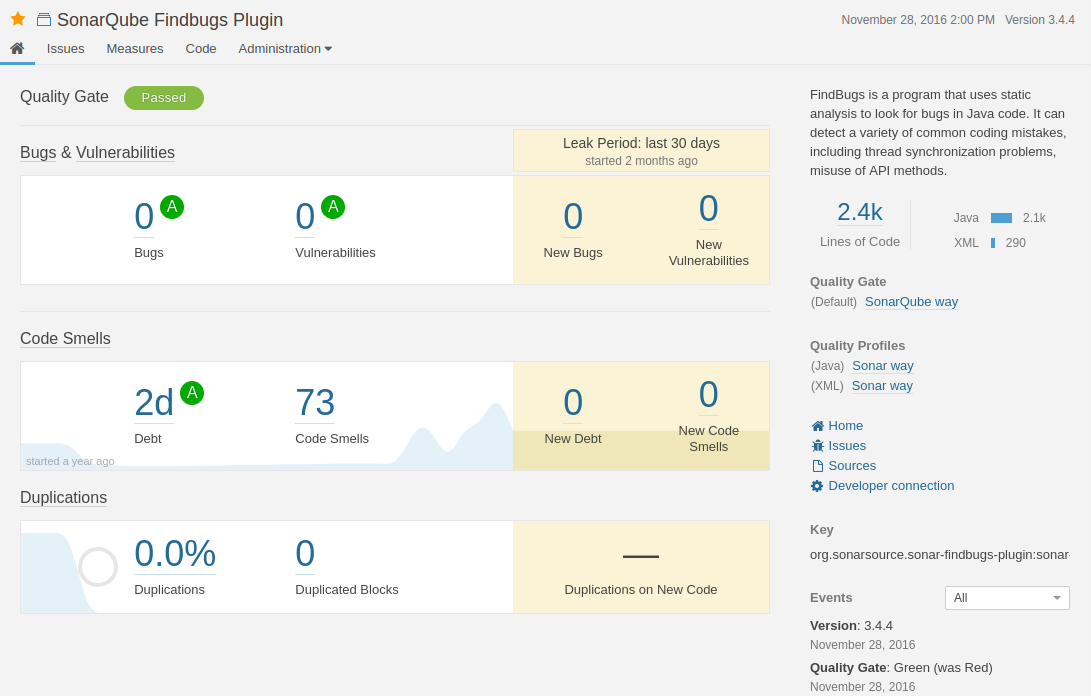
This is where SonarQube shines. It automates code quality and security reviews, integrating seamlessly into your existing CI/CD pipelines and helping teams catch issues early in the development process though integrations and automation support.
This Capterra review highlighted:
SonarQube provides important metrics such as code smells, bugs, vulnerabilities, and code coverage. Easy integration with CI/CD tools.
📖 Also Read: Step Guide on How to Write Documentation for Code
Here’s a visual explainer on how you can prioritize unit testing tasks using ClickUp:
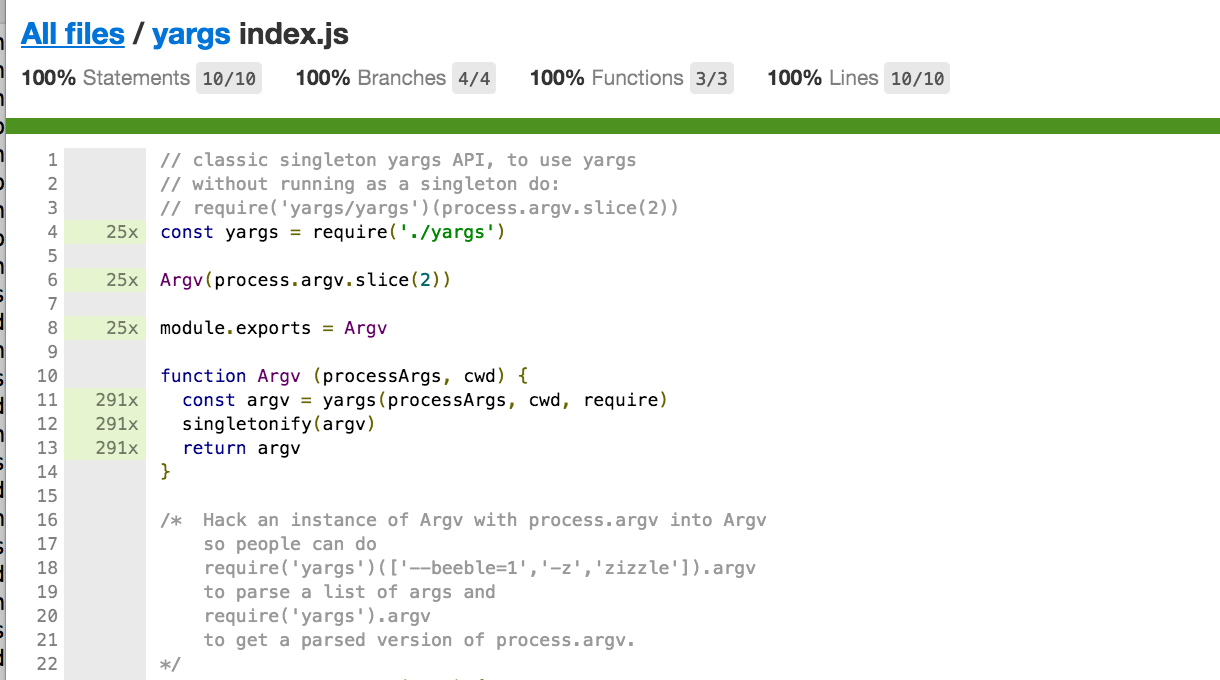
Tracking code coverage in JavaScript and other various programming languages can be tricky. The task of adequately testing every function, branch, and line becomes daunting as applications grow in size. Istanbul presents itself as a solution to this problem.
It’s an open-source solution that simplifies the entire process of tracking code coverage in JavaScript applications. Whether you’re using ES5 or modern ES2015+, Istanbul helps you easily instrument your code and measure how well your unit tests are covering it.
👀 Fun Fact: In the ’60s, remote dev teams would write code on paper and mail it to be punched into machines. You wouldn’t know your code had a typo until a week later.
Not all code is equal, and neither are your tests.
When you’re managing large-scale Java and Groovy projects, one of the biggest challenges developers face is figuring out which areas of the code need the most attention and how to test them efficiently.
OpenClover turns this struggle into an advantage, helping developers balance testing with efficiency. It highlights the riskiest parts of your code, lets you focus only on the most critical tests, and optimizes your testing time like never before.
This Reddit comment noted:
Clover’s code base is about ten times larger than JaCoCo, so it has a really huge list of features.
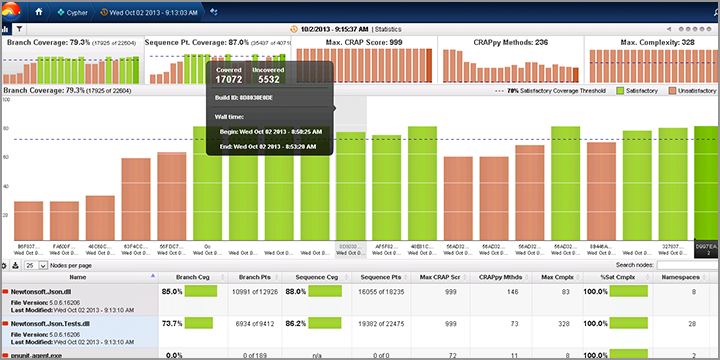
Imagine a large-scale .NET development team working on a complex project with multiple developers handling different modules. Tracking which parts of the application receive sufficient testing becomes increasingly challenging as the codebase grows.
This fragmented approach not only increases the risk of issues in production but also slows down the release cycle.
However, NCover addresses this challenge by providing a unified platform for measuring and managing code coverage across the entire development team.
📖 Also Read: How to Become a Better Programmer
💟 Bonus: Brain MAX is your AI-powered desktop companion that can support your workflow as a code coverage tool. With deep integration across your code repositories, documentation, and project management platforms, Brain MAX can help you track which parts of your codebase are tested and which need more attention.
You can use voice commands or text prompts to ask for code coverage summaries, identify untested files or functions, and generate actionable reports. Brain MAX can also organize feedback, link coverage data to specific tasks or pull requests, and suggest next steps for improving test coverage.
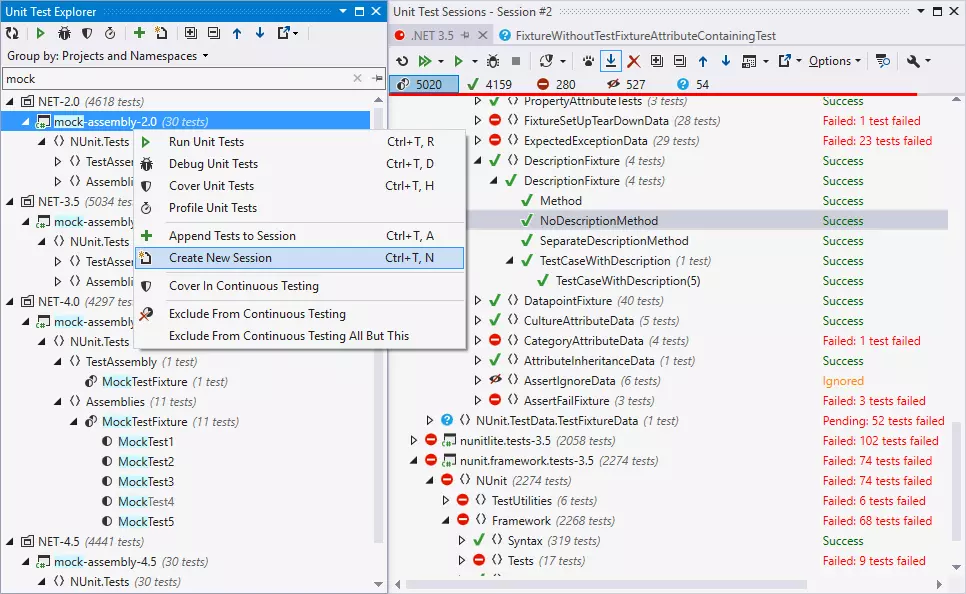
Maintaining high-quality code during the development of .NET applications can be an ongoing challenge. Making sure your code satisfies standards can frequently become a laborious task, involving everything from tracking code coverage to running unit tests.
This is where dotCover steps in. By integrating seamlessly with Visual Studio and JetBrains Rider, dotCover brings clarity to your testing and coverage processes.
This G2 review featured:
DotCover is shown all parts of the code were called during the session and which parts were not reached. its also shows the possible memory leaks in the code that’s why I like all feature of DotCover it’s very helpful and easy to use.
📖 Also Read: How to Use AI in Software Development
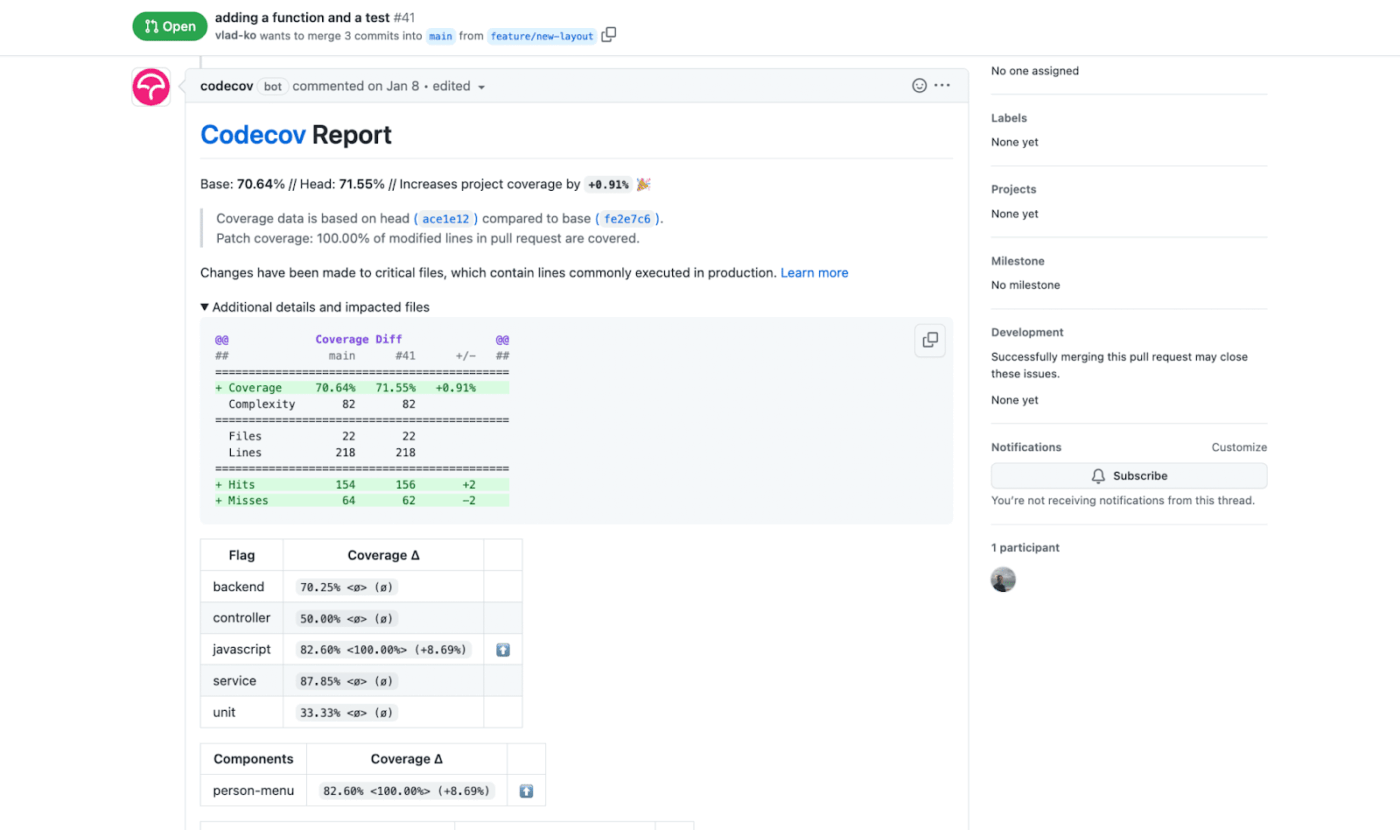
Ever spend way too much time debugging code only to find out a simple test failed? Or, even worse, realized that a critical part of your code was never even tested in the first place? We’ve all been there.
The tricky part is knowing where your code is vulnerable. That’s where Codecov can help. It enables you to uncover the problem areas with better clarity so you can act fast and stop bugs before they hit production.
This G2 review noted:
It generates good quality reports and provides me with the detailed result of the code coverage in the tests I am performing, which helps me optimize the code for the areas not covered in tests too.
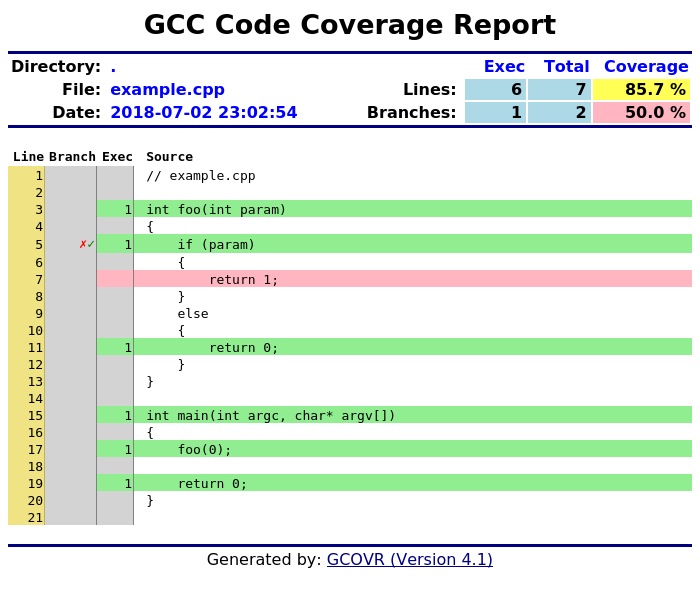
Developers working with GCC often struggle to find lightweight tools that offer accurate, line-level coverage for C and C++ programs.
Gcov solves this with native support for GCC, giving developers precise insights into how frequently each line of code executes.
When paired with gprof, it also helps identify high-computation “hot spots,” making it a solid option for performance tuning and improving test completeness.
📖 Also Read: Best App Development Software Tools
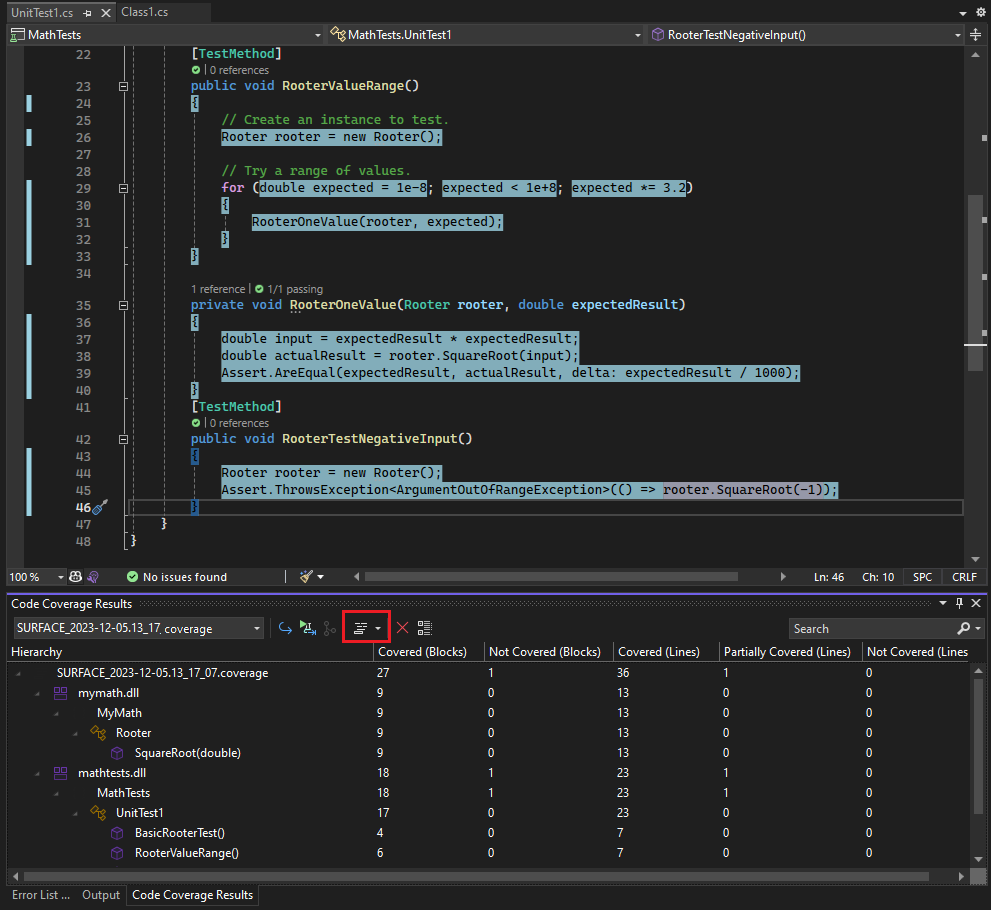
When working in .NET or C++, knowing which parts of your application have been tested—and which haven’t—is critical for release confidence. Many teams use external tools for this, but if you’re already building inside Visual Studio, its built-in Code Coverage tool is a natural fit.
Visual Studio Code Coverage helps developers identify untested branches, monitor test effectiveness, and prevent regressions early, without ever leaving the IDE.
The tool’s tight integration with MSTest and the Test Explorer makes it incredibly convenient for teams working in Microsoft-heavy environments.
This Capterra review captured:
I have enjoyed using VS Code immensely. I now use it as my primary code editor for web development, Python scripting, and certain data science work.
📖 Also Read: Unlocking the Power of ClickUp AI for Software Teams
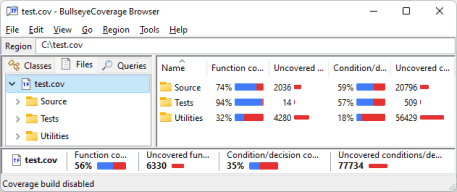
Even after a full round of unit tests, developers working on embedded systems or regulated software often can’t answer the real question: which logic paths are still untested?
BullseyeCoverage is purpose-built to address that. It goes beyond basic line or branch coverage by offering condition/decision coverage. From aerospace and medical systems to automotive and industrial controls, BullseyeCoverage supports teams with detailed metrics and multiple integrations to popular tools.
A user says:
Bullseye is a very nice tool to measure code coverage for C/C++. We usually recommend it to our customers because it does a good job for an affordable price. One of the remarkable things is that it doesn’t measure “statement coverage”. Instead, it focuses on “decision coverage”.
📖 Also Read: Best Software Development Tools
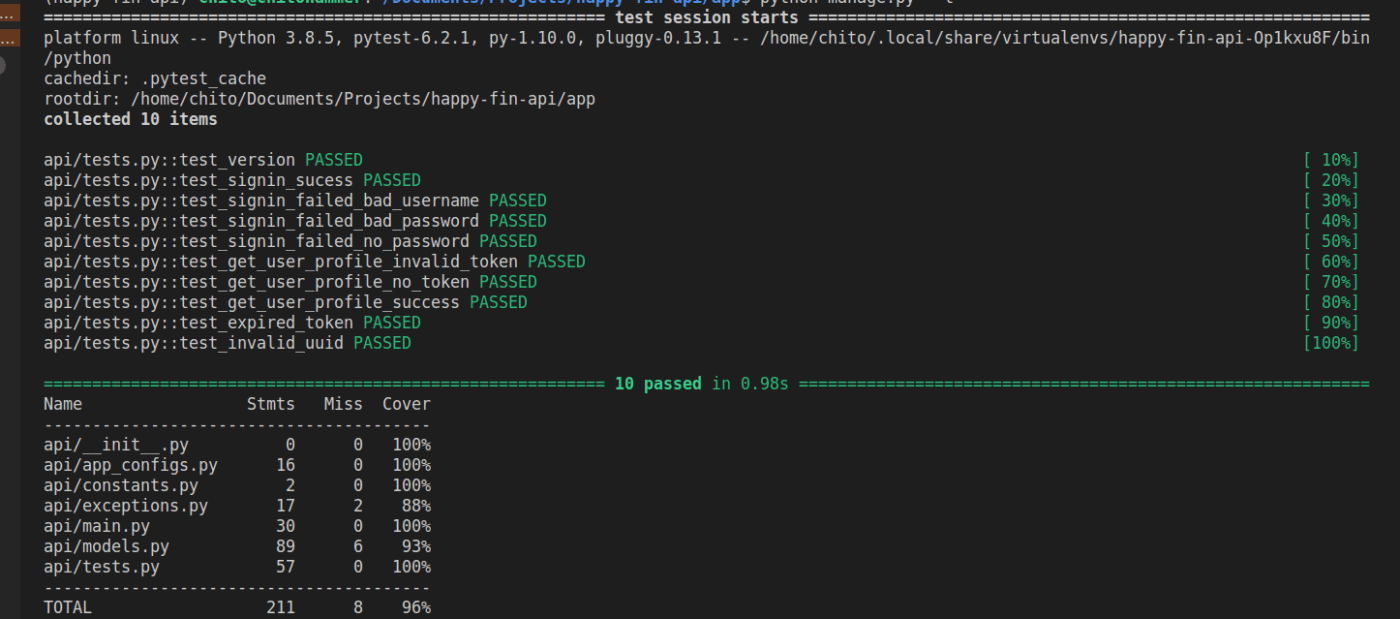
Developers often assume that running a test suite means the job’s done, but what about the lines you didn’t touch?
Coverage.py helps close that gap. Tailored for Python projects, it shows you exactly what’s being tested and what’s not, right down to individual lines.
For teams working in CI/CD, Coverage.py integrates cleanly into pipelines and even provides JSON and XML outputs for tooling or dashboards.
Here are 3 additional code and test coverage tools that align with the ones we’ve already discussed, each offering specific advantages depending on language, workflow, or reporting needs:
📖 Also Read: Free Software Development Plan Templates to Use
Running tests is one thing. Knowing what those tests actually cover and their coverage results is another thing. That’s where code coverage analysis tools come in.
They show you what’s been tested, what’s missing in your code blocks and collected data, and where to focus next.
Most tools help you measure coverage. But ClickUp helps you act on it.
Instead of bouncing between source codes, generated reports, spreadsheets, and task managers, you can assign reviewers, update QA status, and link coverage insights directly to your dev workflow—in a single interface.
If you’re tired of patching together a process that should’ve been built in from the start, sign up for ClickUp now!
A code coverage tool is a software utility that measures the percentage of your source code executed during testing. Popular examples include JaCoCo for Java, Istanbul for JavaScript, and Coverage.py for Python. These tools help developers identify untested parts of their codebase and improve test effectiveness.
SonarQube is not a code coverage tool itself. Instead, it integrates with external code coverage tools to import and display coverage data alongside its static code analysis results. This provides a comprehensive overview of code quality and test coverage in one place.
To check code coverage, select a tool compatible with your programming language, integrate it into your build or testing process, and generate coverage reports. These reports show which parts of your code have been tested and which have not, allowing you to improve your test suite as needed.

© 2026 ClickUp

There’s an easier way. Try a free AI Agent in ClickUp that actually does the work for you—set up in minutes, save hours every week.