monday.com Gantt Chart Featured Image

How to Create a Gantt Chart in monday.com

Start using ClickUp today

  • Manage all your work in one place
  • Collaborate with your team
  • Use ClickUp for FREE—forever

You’ve got a project meeting in ten minutes, but your report is a tangled mess. Deadlines loom, and you can’t quite remember which tasks rely on others to be completed first. 

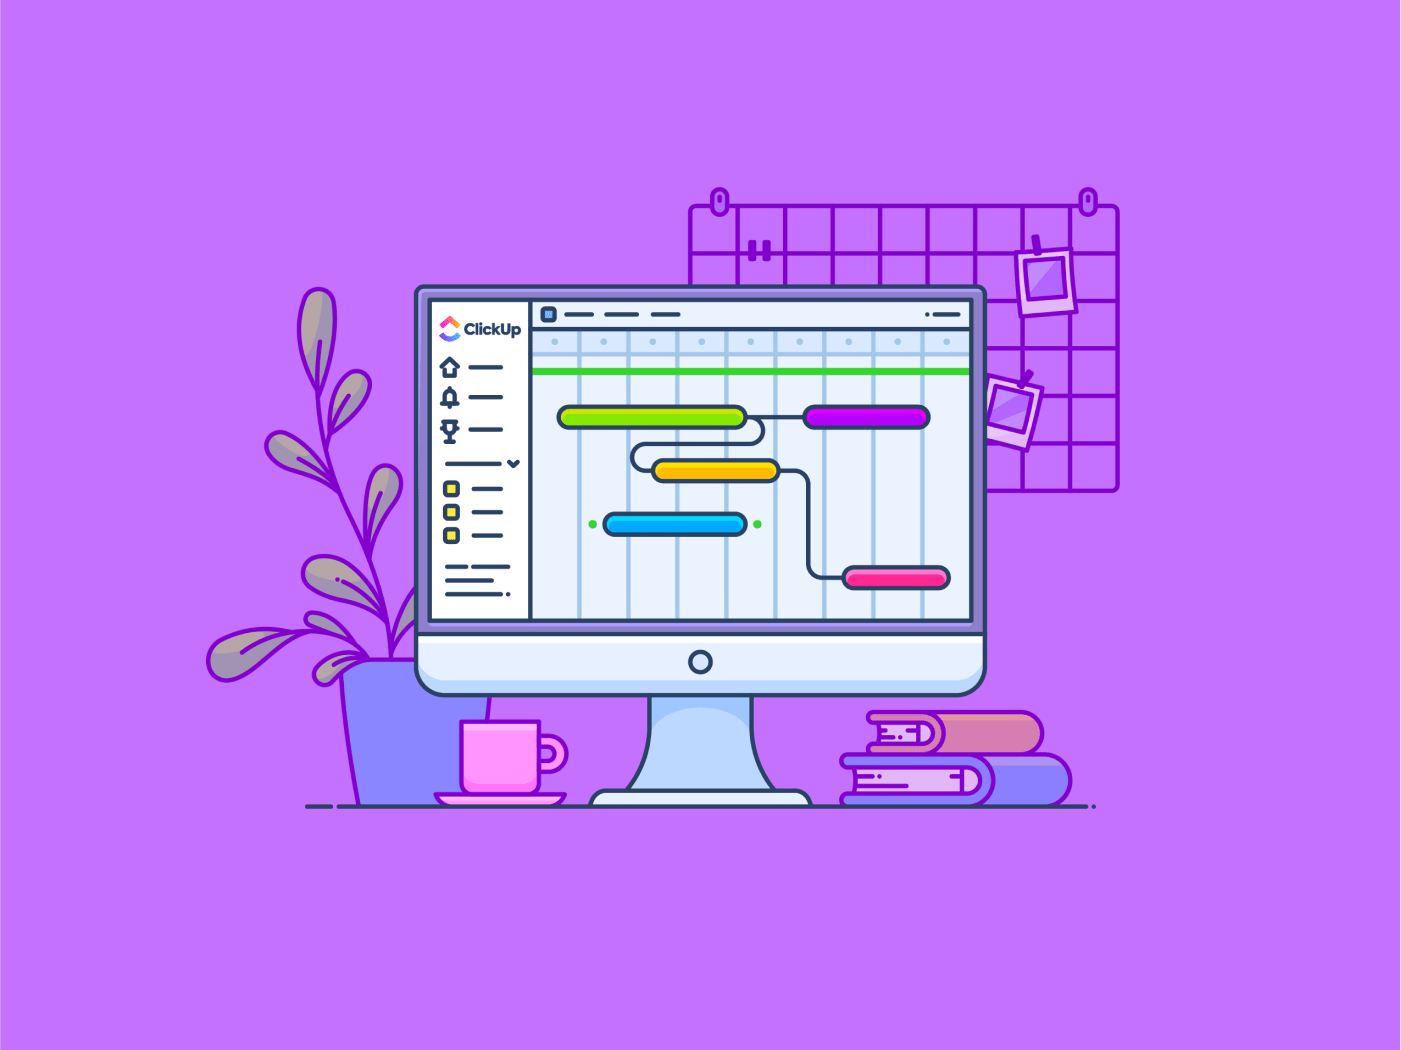
All you need to get out of that mess is a Gantt chart! Gantt Charts are powerful visualization tools that clarify timelines, roadblocks, and project potential.

The popular work management platform monday.com simplifies and speeds up the process of creating Gantt charts. These bar charts depict project schedules, giving project managers a clear picture of task durations, dependencies, and the overall project timelines. 

Let’s understand how. 

Summarize this article with AI ClickUp Brain not only saves you precious time by instantly summarizing articles, it also leverages AI to connect your tasks, docs, people, and more, streamlining your workflow like never before.
ClickUp Brain
Avatar of person using AI Summarize this article for me please

Creating a Gantt Chart in Monday.com

You don’t need to build a Gantt chart from scratch on monday.com. Instead, you can use its views to visualize your tasks in a Gantt format. 

Here’s how to create a simple Gantt chart on monday.com:

Step 1: Set up your board

The first step is to create a board specifically for your project. Click the ‘+’ button in the top right corner of the sidebar and choose ‘Gantt chart’ from the options. Give your board a descriptive name—something that reflects the project at hand—and click ‘Create Board.’

Step 2: Add columns

For monday.com to translate your project tasks into a Gantt chart, it needs specific information. Ensure your board has at least the following columns:

  • Task name: Clearly define each task involved in your project
  • Timeline: This column dictates the duration of each task, typically represented in days or weeks
  • Start date (optional): If you have pre-determined start dates for specific tasks, include them in a dedicated column

💡Pro Tip: To gain further insights into your project, enhance your Gantt chart by adding columns such as ‘Status,’ ‘Assignee,’ or ‘Priority. ‘

Step 3: Enable the Gantt view

Navigate to the ‘Board View’ menu located at the top of your board. From the dropdown menu, select ‘Gantt.’

Once done, the monday.com board will display your tasks as a visually appealing Gantt chart. Each task name appears as a bar on the timeline, with its length representing the designated duration in the ‘Timeline’ column.

Step 4: Fine-tune

monday.com offers some customization options to optimize your Gantt chart:

  • Group by: Organize your tasks by grouping them according to project phases, teams, or other relevant categories
  • Color by: Assign colors based on task status, priority, or any other column for visual clarity
  • Baseline: Set a baseline to track progress against your initial project timeline
  • Milestones: Highlight key project milestones for easy reference

This level of visual organization simplifies project monitoring and communication within your team. Team members can easily view their assigned tasks and their relative position in the overall project timeline.

💡Pro Tip: Drag and drop tasks along the timeline to adjust their scheduling. Use the ‘+’ button next to each taskbar to create subtasks, ideal for breaking down complex tasks into manageable steps.

Summarize this article with AI ClickUp Brain not only saves you precious time by instantly summarizing articles, it also leverages AI to connect your tasks, docs, people, and more, streamlining your workflow like never before.
ClickUp Brain
Avatar of person using AI Summarize this article for me please

Limitations of Creating Gantt Charts in monday.com

While monday.com offers a user-friendly experience for building Gantt charts, it’s important to acknowledge a few limitations:

  • Limited customization: The Gantt chart view in monday.com presents an essential visual representation of your project schedule. Customization options are limited compared to dedicated Gantt chart software
  • Basic resource management functionality: monday.com doesn’t offer dedicated functionalities for managing team resources, such as assigning tasks based on individual workloads or skill sets
  • Restricted reporting: The reporting capabilities geared toward a monday.com Gantt chart are somewhat restricted. The tool lacks portfolio reporting or the ability to view multiple projects on a single timeline effectively. This can be a significant drawback for teams managing multiple projects simultaneously, as they may need to switch between boards to get a complete overview
  • Not a free Gantt Chart software: While monday.com provides a free plan with basic features, accessing Gantt charts and advanced features requires upgrading to a paid subscription plan
  • Complexity for large projects: A monday.com Gantt chart may become cumbersome and less visually clear for highly complex projects with numerous tasks and dependencies
  • Lack of integration: monday.com’s Gantt charts do not seamlessly link to timesheets, real-time dashboards, or other project views. This lack of integration can hinder the ability to generate detailed reports that encompass various aspects of project performance and resource allocation
Summarize this article with AI ClickUp Brain not only saves you precious time by instantly summarizing articles, it also leverages AI to connect your tasks, docs, people, and more, streamlining your workflow like never before.
ClickUp Brain
Avatar of person using AI Summarize this article for me please

Create Gantt Charts with ClickUp

If the limitations of monday.com’s Gantt charts pose a challenge to your project management needs, consider exploring more comprehensive project management software like ClickUp.

ClickUp is a highly customizable productivity platform designed to enhance processes, optimize resources, and foster team collaboration. It uniquely integrates work across various applications into a single, dynamic interface, and weekly updates aim to improve user experience.

The platform’s user-friendly design and adaptability enable it to grow alongside businesses, making it suitable for various applications. ClickUp’s comprehensive approach to work management distinguishes it from competitors, featuring a robust suite of built-in tools, including:

  • Organizational hierarchy: A structured system to manage teams, projects, tasks, and subtasks effectively
  • Customizable work views: Over 15 ClickUp Views to tailor task management according to your workflows
  • Collaborative ClickUp Docs: Tools for real-time document creation, editing, and sharing
  • ClickUp Whiteboards: A visual, freehand canvas for brainstorming and collaborative planning that links to your documents and tasks within ClickUp

ClickUp’s key features address many of monday.com’s limitations related to Gantt charts. Here’s how:

  • Extensive customization: ClickUp offers a high degree of customization for Gantt charts, allowing you to adjust gridlines, bar colors, and column visibility. This enables the creation of tailored visualizations that best suit your project requirements
  • Resource management: It excels in resource management. You can assign multiple tasks to specific team members and view their workloads visually within the Gantt chart. This ensures efficient project execution by preventing resource overload and ensuring risk management
  • Advanced reporting: ClickUp’s robust reporting functionality extends to Gantt charts. Generate detailed reports that analyze project progress, identify roadblocks, and track project performance over time
  • Free plan with Gantt charts: Unlike monday.com, ClickUp offers Gantt chart functionalities even in its free plan, making it a cost-effective option for smaller teams
  • Handling complexity: ClickUp allows users to create and visualize task dependencies and milestones directly and clearly within the Gantt chart. This is useful for handling complex projects with numerous interdependent tasks. The platform’s zooming and filtering capabilities allow you to focus on specific project segments while maintaining a comprehensive overview
  • Extensive integration: ClickUp includes collaboration tools such as comments, mentions, and file attachments, which you can use even within the Gantt chart view. This facilitates communication among team members, ensuring that everyone is aligned and informed about project updates and changes. Users can switch between different views, such as List, Board, and Gantt, within the same project. This flexibility allows teams to analyze project details from multiple perspectives, ensuring that all aspects of project management are covered and easily accessible
Summarize this article with AI ClickUp Brain not only saves you precious time by instantly summarizing articles, it also leverages AI to connect your tasks, docs, people, and more, streamlining your workflow like never before.
ClickUp Brain
Avatar of person using AI Summarize this article for me please

How to Create a Gantt Chart with ClickUp

ClickUp’s Gantt Charts 
Visualize and manage any project with ClickUp’s Gantt Charts 

There are several ways to create robust Gantt charts with ClickUp. Let’s start with ClickUp’s Gantt Chart View:

Step 1: Define the project

ClickUp offers various tools to help you consolidate and organize all project-related information. For instance, you can use ClickUp Goals to articulate your objectives and set measurable targets for tracking progress. Additionally, organizing your goals into folders can enhance convenience and facilitate easier monitoring.

ClickUp Goals
Set objectives and organize goals in folders with ClickUp Goals

During this phase,

  • Clearly outline the project’s goals, deliverables, and overall timeline
  • Identify the key tasks required to complete the project
  • Determine the amount of time needed to complete each task

Step 2: Create tasks

ClickUp Tasks
Add Tasks to your ClickUp List

Create a new list or folder in ClickUp. This will serve as the container for your project tasks. Input all the tasks you identified in step 1. Then, assign due dates for each task to establish a preliminary timeline. You can also add other pertinent task details using ClickUp’s Custom Fields.

ClickUp Gantt Charts
Set due dates and dependencies easily on ClickUp Gantt Charts

Step 3: Create the Gantt chart view

ClickUp Gantt Charts
Visually track task progress in real-time on ClickUp Gantt Charts

Navigate to your list or folder. Go to the project container where your tasks are located. Then, click the ‘+ View’ button and select ‘Gantt.’  You can rename the view, make it private, or pin it for easy access. 

Step 4: Visualize and adjust

The Gantt chart will display your tasks as horizontal bars, with the length representing duration and position indicating start and end dates. Create Dependencies between tasks to show which tasks must be completed before others can start. To do so:

  • Hover over a task
  • Click and drag the node
  • Drop the line on another task to link tasks and create the Dependency
Task Dependencies within ClickUp’s Gantt charts
Add Task Dependencies within ClickUp’s Gantt charts by drawing a connecting line between related tasks

To delete the Dependency, simply click the connection between tasks and press Delete.

💡Pro Tip: When the Reschedule dependencies option is enabled in the Gantt view Layout options, dragging a task with Dependencies will automatically reschedule all subsequent tasks in the chain. 

After that:

  • Add milestones to mark important project checkpoints
  • Drag and drop task bars to change start and end dates as needed
  • Identify the critical path, which is the sequence of tasks with no slack time

Step 5: Customize and refine

Customize and refine your Gantt Charts
Customize and refine your Gantt Charts easily on ClickUp

Click on a taskbar to view and edit task details, including assignees, priority, and custom fields. Once that’s done, you can:

  • Adjust the time scale to view your project’s progress in different levels of detail
  • Filter tasks by assignee, status, or other criteria
  • Use color coding to categorize tasks or highlight important information

Additional tips:

  • Use dependencies to ensure tasks are completed in the correct order
  • Set clear milestones to track progress and celebrate achievements
  • Pay close attention to tasks on the critical path to avoid delays
  • Keep your Gantt chart up-to-date by adjusting task durations and dependencies as needed

Another way to create Gantt Charts with ClickUp is by using the ClickUp Simple Gantt Template. It is designed to simplify the creation and management of Gantt charts, making project timelines and dependencies more manageable. 

Simplify Gantt Chart creation with the pre-built ClickUp Simple Gantt Template

Here are some benefits you’ll get from using  this Gantt chart template:

  • Access a straightforward, intuitive interface to quickly set up and visualize your project timeline
  • Easily adjust task durations and dependencies with a drag-and-drop feature, allowing for quick modifications to the project plan
  • Create and manage task dependencies, ensuring that all project milestones are clearly defined and linked
  • Identify key milestones and critical paths to ensure your project stays on track. This helps in prioritizing tasks that are essential for the project’s success
  • Visualize the progress of each task directly on the Gantt chart, getting a clear picture of the overall project status at a glance
  • The template supports multiple views, allowing you to switch between different levels of detail as needed. This flexibility helps cater to various stakeholders’ needs

Quick tips:

  • Start by outlining the project’s objectives and setting clear milestones. This will help in breaking down the project into manageable tasks and phases
  • Make full use of the task dependency feature to map out the sequence of tasks. This ensures that team members are aware of which tasks are prerequisites for others, aiding in smoother project execution
  • Keep the Gantt chart up to date with the latest progress on tasks. This real-time tracking helps in identifying potential delays and allows for timely adjustments
  • Use the drag-and-drop functionality to adjust timelines as needed. This is especially useful when there are changes in project scope or unexpected delays
  • Focus on the critical paths to ensure that key tasks are completed on time. This helps in avoiding bottlenecks that could derail the project
  • Use the customizable views to create presentations for different stakeholders. This helps in effectively communicating project status and timelines
  • Integrate the Gantt chart with other ClickUp tools to manage all aspects of your project in one place. For example, linking tasks from the Gantt chart to your calendar can help in better scheduling and time management

Add a Gantt view to an existing ClickUp Project

To add a Gantt chart to an existing ClickUp project, follow these steps:

  1. Log into your ClickUp workspace and navigate to the folder or list where you want to add the Gantt chart
  2. Click on the +View button located at the top of the screen. This will open a dropdown menu with various view options
  3. From the list of available views, select Gantt. You can choose to pin this view for easy access in the future or restrict third-party access if necessary
  4. Once the Gantt chart is created, you can customize it by adding tasks, adjusting timelines, and setting dependencies. You can also change the color schemes and time units to better fit your project needs
Summarize this article with AI ClickUp Brain not only saves you precious time by instantly summarizing articles, it also leverages AI to connect your tasks, docs, people, and more, streamlining your workflow like never before.
ClickUp Brain
Avatar of person using AI Summarize this article for me please

An Easier Way to Create and Manage Gantt Charts

While monday.com offers a basic Gantt chart functionality, ClickUp emerges as a more powerful and versatile tool for creating Gantt charts for project management. With its extensive customization options, robust resource management, and advanced reporting capabilities, ClickUp allows you to create clear, informative, and actionable Gantt charts.

Using Gantt charts’ visual power and ClickUp’s comprehensive features, you’ll gain a competitive edge in managing your projects efficiently and effectively.

Ready to experience the difference? Try ClickUp today and use the full potential of your project management endeavors!

Questions? Comments? Visit our Help Center for support.

Sign up for FREE and start using ClickUp in seconds!
Please enter valid email address