Top SaaS Metrics to Track and Improve Growth

Sorry, there were no results found for “”
Sorry, there were no results found for “”
Sorry, there were no results found for “”
How do you define success?
In the world of modern businesses, especially in technology, success is a complex idea to wrap our heads around. Becoming a unicorn—i,e., getting $1 billion in valuation—is seen as success. Yet, fewer than 1% of these unicorns generate $1B in revenue or cash.
Traditionally, profitability was a marker of success, but, today, startups take on losses in pursuit of market disruption or dramatic growth. With evolving business models and new investment structures, the idea of growth and success is redefined.
In this world, the metrics you choose serve as your North Star and the goal you rally toward. In this blog post, we discuss some of the top SaaS metrics you can use to guide your journey to success.
Software as a Service (SaaS) metrics are key performance indicators (KPIs) for organizations that build and sell cloud-based software.
Unlike traditional KPIs, SaaS metrics are designed based on the needs, business models, and growth of subscription-based businesses. They are important to:
Measure performance: Mapping milestones across various dimensions, such as revenue, profitability, customer satisfaction, product development, etc.
Monitor business health: Using metrics like operating cash flow, burn rate, cash conversion cycle, etc. to monitor their ability to pay their dues and manage investments. For metrics that show a clear picture of your long-term success, a Sales Win Rate Calculator can be a useful tool.
Guide strategy: Validating market acceptance and defining product roadmap accordingly.
For instance, if the churn rate is high, it likely means that the product isn’t delivering on its promise, which demands a change in marketing strategy or product features.
Steer toward growth: Understanding the current state of the business to steer sales, marketing, product, and customer success teams toward common goals.
In essence, SaaS metrics play a powerful role in navigating the organization’s journey to success. Here are some of the tried-and-tested SaaS metrics to choose from.
Before you choose a metric, understand your business goal. An early-stage startup might set the primary goal to be customer acquisition and average revenue per customer. On the other hand, an organization preparing for an IPO or a sale might have targets around cost efficiency, recurring revenue, or customer lifetime value.
Below are important SaaS metrics that organizations commonly use. Choose what’s right for you based on the type of product, business model, cost, stage of your growth, etc.
The primary goal of any business is to make money. Monthly recurring revenue (MRR) helps track exactly that. It measures the sales/cash generated by the business on a monthly basis.
MRR is calculated by multiplying the number of users by how much they pay per month on average. Depending on the payment plans you offer, you might want to calculate annual recurring revenue (ARR) instead.
MRR = Number of active accounts x Revenue / subscription per account
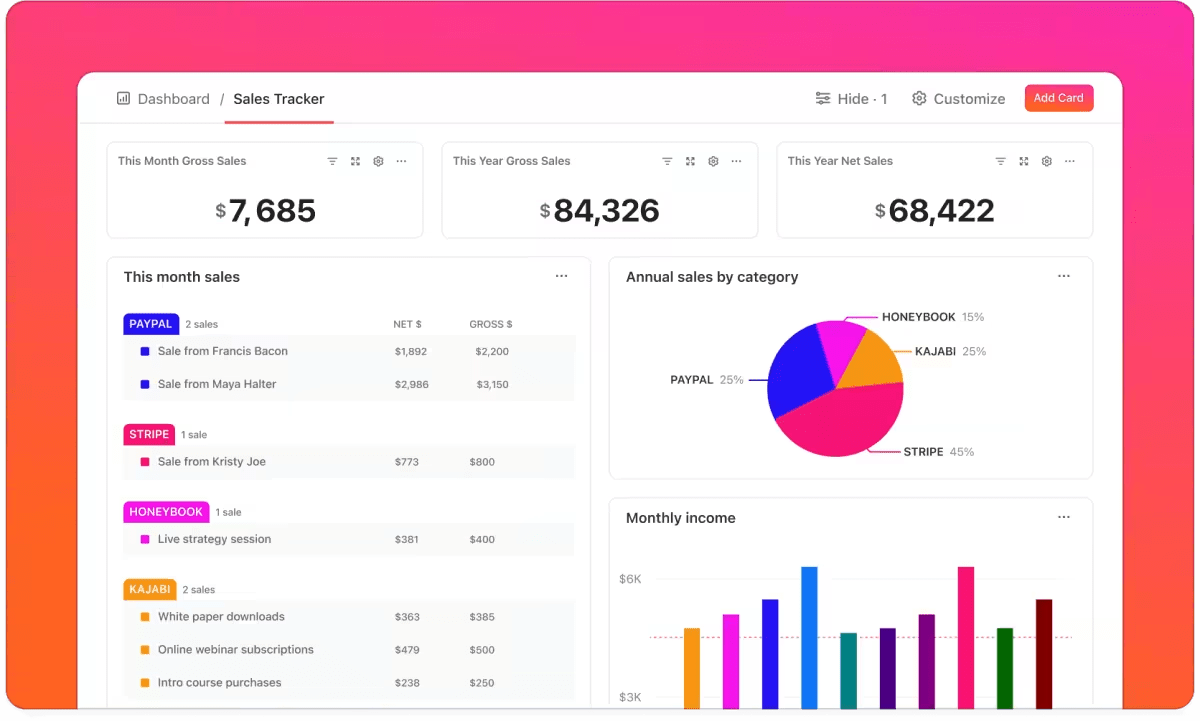
The SaaS model relies on acquiring a customer once and earning revenue from them over the long term. So, MRR is the primary indicator of a SaaS company’s financial stability.
If an organization can generate MRR consistently, it is deemed successful and investable. MRR on an upward trajectory represents organizational growth.
Over time, this trajectory helps forecast revenue accurately and plan investments, headcount, marketing budgets, etc. effectively.
The simplest way to increase MRR is to acquire more customers. However, if you have a usage-based pricing model, you can also leverage customer success initiatives to help expand product usage to boost MRR.
Average Revenue Per User (ARPU) or, in some cases, Average Revenue Per Account (ARPA) is what each customer/account pays the SaaS business on average.
ARPU = Total revenue / Number of users
You can calculate ARPA for any time period. Most businesses do it monthly to align with MRR.
ARPA can be differently meaningful based on your business model. Here’s how it looks for various kinds of SaaS businesses.
Subscription model: For a typical user-based subscription business, ARPU would be consistent and, therefore not as revealing. For example, if you have a singular $10 subscription plan for all users, your APRA is $10.
Despite its simplicity, this number can still be useful. You might use this data to adjust subscription fees, redesign subscriptions, offer additional tiers, etc.
Enterprise customers: If you’re serving enterprise customers, ARPA is more meaningful than ARPU. For example, for an enterprise with 100 users, each paying an ARPU of $8 per month, your revenue for this account would be $800. Another enterprise with 200 users will generate $1600 in revenue, even though ARPU remains the same.
You can use this metric to strategize your go-to-market approach.
For instance, you might go after enterprise accounts with more users. Or you might focus your account-based marketing (ABM) efforts on increasing share of wallet.
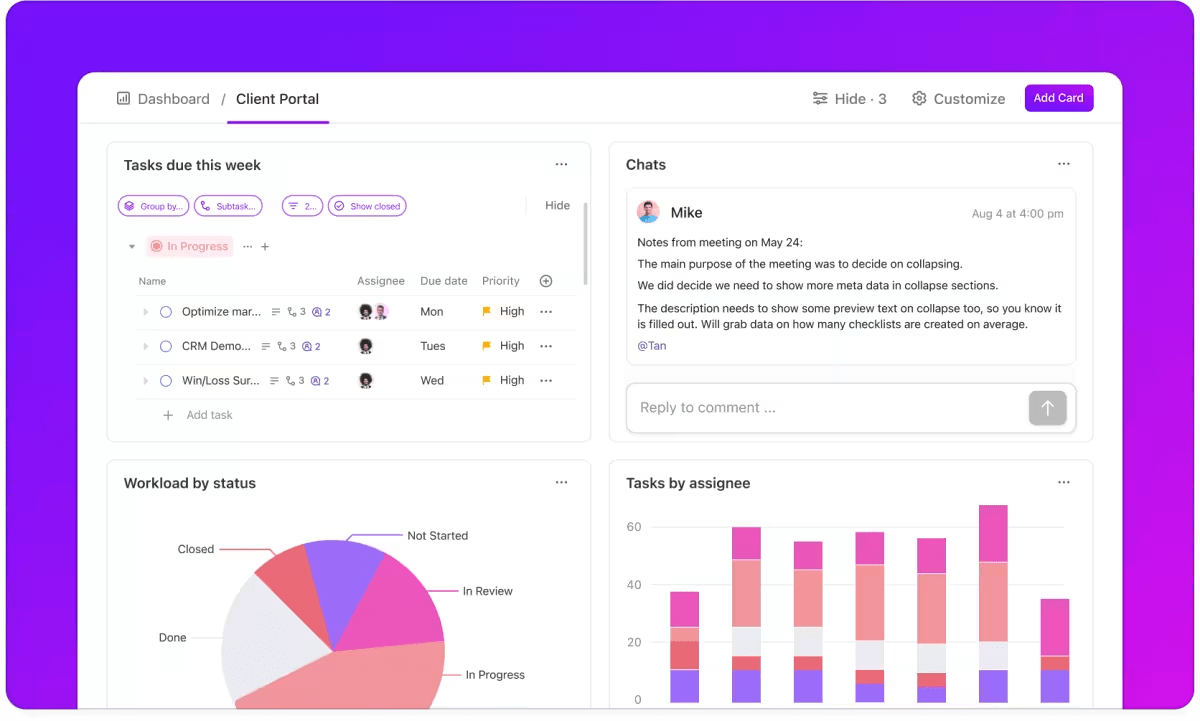
Usage-based pricing: Usage-based pricing is when you charge a fee for each activity instead of a flat subscription. If you’re charging $2 for every event scheduled on the calendar, your ARPU might vary across each user/user type.
The average revenue per user helps you validate your pricing model and build a strategy around increasing user activity on your product.
There are two commonly used ways to increase ARPU:
Customer Lifetime Value (CLTV or LTV) measures revenue generated on the axis of the customer and not time.
CLTV = ARPA x Average customer lifespan
For example, if a customer remains active for five years, with an ARPA of $120 per annum, then CTLV = $120 x 5 = $600.
CLTV is especially meaningful in SaaS for various reasons. Before delving into them, it’s important to understand another related SaaS metric: Customer Acquisition Cost.
Customer Acquisition Cost (CAC) is the amount a business spends to acquire each new customer. This includes all the sales and marketing spends incurred in any given time period.
CAC = Total sales and marketing spend / Number of customers acquired
For example, if you’ve spent $10,000 dollars this year and acquired 1000 new customers, your CAC = $10,000 / 1000 = $10.
CAC is among the largest spends a SaaS business makes other than, perhaps, product development itself. Therefore, it is important to understand the ROI on CAC on a regular basis. This ROI is calculated on three dimensions.
ARPA: If the average revenue per account is more than your CAC, you’re doing well enough.
For instance, if your CAC is $10 and your ARPA is $120, your CAC-to-ARPA ratio is 1.2x, which is good.
CLTV: If your customer lifetime value is in multiples of your CAC, you’re in a great place.
For instance, if your CAC is $10, but your CLTV is $1,200, your CAC-to-CLTV ratio is 120x, which is fantastic!
There is one other reason you should calculate CAC: To understand your payback period.
Payback period is the time it takes a SaaS company to recoup customer acquisition costs. This is akin to a breakeven point, after which all revenue is treated as profit.
Payback period = CAC / ARR
If you spend $10 in CAC and the customer pays a yearly subscription fee of $120, your payback period is 10/120 = 0.083, i.e., one month.
However, organizations often consider gross margins instead of revenue while calculating payback. For instance, of the $120 revenue, if only 50% is gross margins, the payback period is 10/(120*50%), which is two months.
In simple terms, payback period shows if the investment is worth it.
For instance, if it takes 10 years to recoup CAC, the business itself wouldn’t be worthwhile, given the rate at which tech evolves!
A downward trajectory of payback period indicates a successful company, which makes it more investable.
Successful businesses reduce payback period primarily by reducing CAC. After a period of time, say 3-5 years, a brand might have been able to establish brand awareness, visibility, credibility, referral network, etc., which reduces CAC.
For instance, the spends on SEO in the first three years might have long-tail impact for another three years, contributing to lower CAC resulting in shorter payback periods.
On the other hand, over time, you can also strengthen the product, add features, etc. and increase average revenue per customer, resulting in lower payback periods.
There are two kinds of churn: Customer churn and revenue churn. As a SaaS business, it is good to measure both.
Customer churn rate = Number of churned customers in a period / Total customers at the start of the period
Let’s say you had 100 customers to begin with and you have 90 at the end of a year, your customer churn rate = (100-90)/100 = 10%
Revenue churn rate = Revenue lost from churned customers in a period / Total revenue of that period
Revenue churn is a more accurate indicator of your business health as it measures cashflow instead of customer count. This is especially valuable when your ARPA varies significantly.
In the above example, if the 10% of customers you lost contributed to 90% of your revenue, your revenue churn is 90%, even though customer churn is only 10%.
Churn rate is the measure of the loss of customers or revenue. It helps understand:
While some level of churn is inevitable, it is important to reduce it as much as possible. Here are some ways you can do that.
Onboard thoroughly
Often, customers leave because they don’t have the patience to explore your product entirely. So, build a thorough onboarding process to ensure every user is comfortable with all your features, especially those important to them.
Set them up for success
Offer them educational material, such as set-up videos, demos, templates, etc.
Focus on customer success
Engage the customer regularly and ensure you give them everything they need, to be successful.
Listen to feedback
Ask customers what they like and don’t like. Invest in understanding customer behavior—through product analytics—and upgrade plan your roadmap accordingly.
Have a risk strategy
Identify at-risk customers based on their usage, feedback, etc. Proactively reach out to them and prevent churn before it happens.
Refine customer targeting
Sometimes, despite your best efforts, your product might not be the right fit for the customer. This means that they were not the right customer for you in the first place. Prevent this with better customer segmentation and targeting.
Net Retention Rate (NRR)—also known as net revenue retention—is the inverse of churn in the sense that it measures the percentage of users who remain with you at the end of a given period.
NRR = (MRR at the beginning of the period – churn – downgrades + upstages) / MRR at the beginning of the period
Let’s say you had:
Your NRR is (1200-120-80+500) / 1200 =1.25 or 125%.
A positive NRR is an indicator that your business is growing from existing customers. This means you’re expanding revenue without incurring additional CAC.
For example, if your NRR is 125% and you made $10,000 in revenue last year, you’d likely make $12,500 without spending anything on new customer acquisition.
🎯 Fact Check: Studies show that increasing the customer retention rate by 5% can improve profits by as high as 95%!
Companies increase NRR by:
Daily active users (DAU) or monthly active users (MAU) refers to the number of unique users who actively engage with the product.
DAU/MAU = Number of unique new users + number of unique returning users in a given period
In this case, you can define ‘active’ based on what it means to the product. For an email app, it might be just logging in to check the inbox. For a calendar app, this might be logging in or clicking on an existing event or creating a new entry. For a mobile gaming app, it might be game played.
Often, SaaS businesses use a version of this metric to track feature adoption. This way, you can monitor DAU/MAU for a particular feature or module you have newly launched.
DAU is an early indicator of churn. It’s a leading metric that helps forecast whether users are going to renew their subscriptions or not.
For instance, if a user hasn’t logged into their calendar in a month, it’s safe to assume they’re using another tool and would likely churn.
In addition to the several retention-based tactics discussed above, it also helps to use the product itself for this. Thoughtful mobile notifications or personalized email communication like weekly summary of activities or upcoming events can help bring them back to the app regularly.
Customer concentration is the measure of whether you have all your eggs in one basket (or just a handful).
Customer concentration = % of revenue generated by top x % of customers
For example, if you have 10 paying customers and 2 of them contribute to 90% of your revenue, your customer concentration can be stated as:
90% of your revenue comes from 20% of your customers. This is a high-risk situation.
Primarily, businesses calculate customer concentration to understand their risks. When revenue is distributed more widely among various customers, the chance of them churning all at once is very low.
However, if a major part of your revenue comes from 1-2 customers, their churning can have a major impact. Moreover, they will have disproportionate negotiating power over you, which is detrimental to business success.
You can reduce customer concentration with two approaches.
Expand footprint: widen your sales efforts and onboard more customers to spread out the risks
Lock-in customer: draft longer term contracts with your most valuable customers. Build stability by building deeper relationships and increasing the cost of switching providers.
Cash runway measures how long a startup can survive with its current cash balance and rate of spending. This metric is typically used in early-stage startups without significant revenue or profits.
Cash runway = Cash balance / burn rate
If you’re spending $10,000 a month and have a cash balance of $100,000, you have 10 months before you need to raise capital.
Cash runway is a key measure of how long you’ve got before you get investment or go bust. This helps in various ways.
Most importantly, knowing your cash runway helps approach investors from a position of confidence, presenting an ambitious valuation. For instance, if you’re talking to an investor and you only have a week of runway left, you’ll have little confidence or negotiating power. In such cases, you might end up accepting investment at a much lower valuation than you’re worth.
The simplest way to increase runway is to reduce spending. This can be done by:
Depending on who you ask, there are dozens of KPI examples to measure SaaS success.
Investors might be interested in burn rate, burn multiple—the $ you’re spending to generate net new revenue, rule of 40, etc. Marketing KPIs would be around pipeline metrics, such as lead-to-opportunity conversion rate, sales cycle length, activation rate, etc.
Finance teams might want to see gross margin and net margin. The HR leader would focus on average revenue per employee, average time at the company, employee turnover, etc. Customer experience KPIs revolve around net promoter score, customer satisfaction score, etc.
While all of them offer insights, not all of them are equally important to every type of SaaS business. Begin with the ten business metrics outlined above and build a list of everything else you want to track.
Whatever metrics you choose, here’s how you can track and use them effectively.
No metric is illuminating on its own. In fact, metrics are best understood in comparison. This could be industry benchmarks or past performance.
For instance, Venture Capitalist David Sacks suggests that “The startup that generates $1M million in ARR by burning $2M is more impressive than one that does it by burning $5M.” This can be treated as industry benchmarks.
On the other hand, if you’ve been consistently reducing CAC by 10% year-on-year, it shows your marketing and sales efforts are paying off. This is evaluating metrics based on past performance.
For both of these methods, you need the right KPI software to track and use SaaS metrics. Here’s how you can do that.
There are dozens of metrics you can track—from monitoring the big picture to zooming into the granular details. However, tracking too many would lead to more confusion than insight.
So, choose the top 5-7 metrics that mean the most to you. If you’re an early-stage startup, focus on lead generation, conversions, and CAC. Within your first year, if you track customer lifetime value, you might not get the complete picture because you wouldn’t have data about enough customers going through the entire lifecycle.
If you’re in growth stage, measure MRR, ARPU, and cash runway. At this stage, you’ll still be optimizing your sales and marketing strategy. So, looking too keenly into funnel metrics or compliance might slow you down.
As a mature startup, think about CLTV, expansion revenue, and granular funnel metrics. By now, if you’re still struggling to calculate CAC, you’re in big trouble.
Consider your business model, goals, investor expectations, growth stage and choose metrics that are right for you.
Tracking, monitoring, and reporting SaaS metrics needs special attention, especially because of the scattered nature of data you need. Let’s take the calculation of customer acquisition cost, for example.
To calculate a simple metric like CAC, you need a tool that integrates with a dozen sources, including a customer relationship management (CRM) platform. As the complexity of your metrics increases, your SaaS tools become more and more important.
While choosing the SaaS tool for tracking your metrics, consider the following.
Is your metrics management tool also a goal tracking app? Does it allow you to set goals for each metric and track progress against each of them in real time? ClickUp Goals is designed to do exactly this.
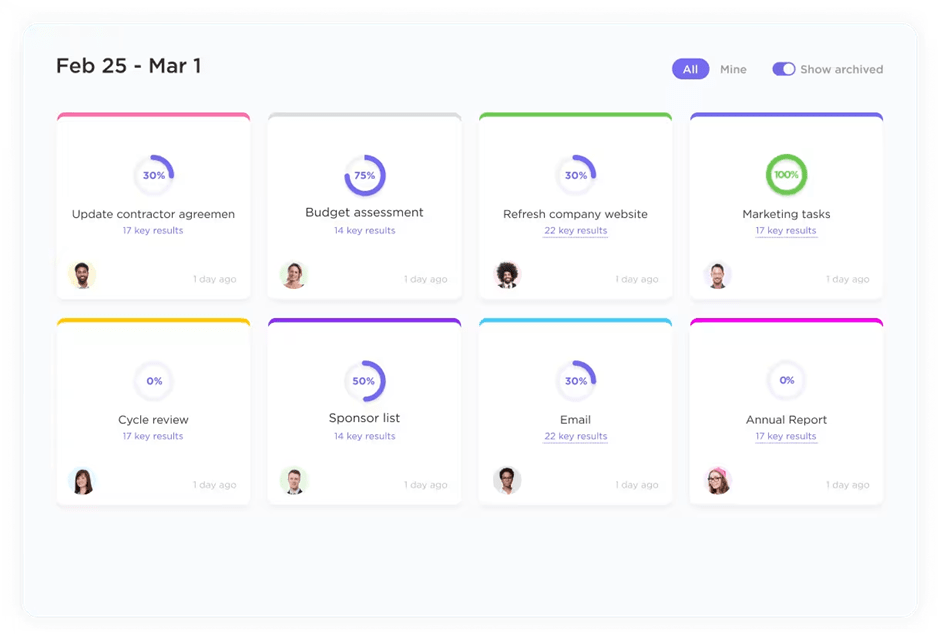
On ClickUp, you can set targets as task completion, numericals, monetary, or true/false statements and track in real time.
For instance, if you’re tracking customer concentration, you can set a goal to track whether the top 20% of customers are generating less than 60% of revenue. You can also choose to set an alert to the head of sales if this target isn’t met.
Don’t know where to start? Here are some goal-setting templates to kickstart your journey.
Manually inputting data into any tool to create a KPI dashboard is a SaaS leader’s biggest nightmare. So, choose a growth hacking tool that integrates effortlessly with a number of other tools.
Going beyond just extracting information from a spreadsheet, it might be able to dynamically import data from various tools, such as HubSpot, Salesforce, Google Forms, Typeform, etc. ClickUp can do all this and more. With ClickUp’s public API, you can also build your own custom integrations as needed.
Startup leaders tend to look at their data every week, if not every day. Going through hundreds of rows and columns isn’t worth the time. What you need are clear and engaging data visualizations.
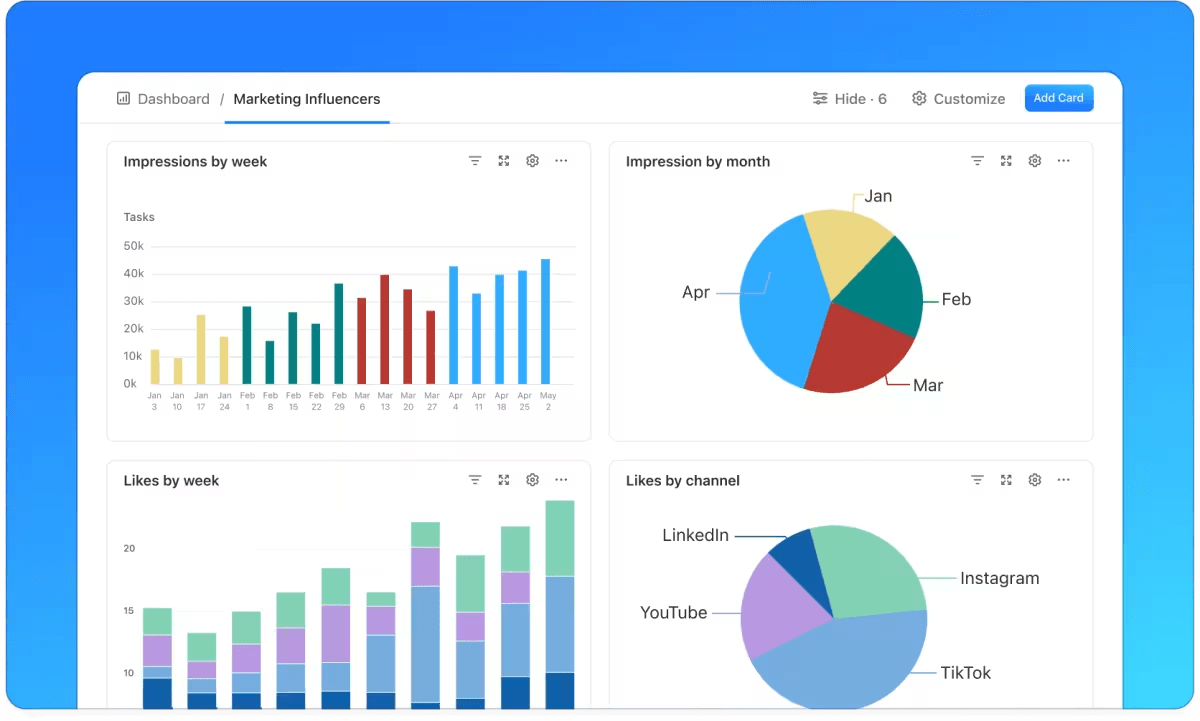
The dynamic, fully customizable ClickUp Dashboards help you get all the relevant insights at a glance. Predesigned widgets help track what matters to you, be it team productivity, budget utilization or sales overviews.
When you use ClickUp as your marketing and sales project management platform, it elevates your insights with 360-degree business context. For example, you can draw connections from cost per lead to CAC all in one place.
A good SaaS tool for performance reporting also needs to get you started quickly. The best way to do this is with pre-designed templates, like on ClickUp.
This KPI template by ClickUp is feature-rich and adaptable with granular customizations. Use it to track key performance indicators and share it with the entire team, enabling clarity, visibility, and focus.
Still setting goals? Try ClickUp’s SMART Goals template.
Typically, SaaS leaders use these metrics to attract external stakeholders, such as investors or customers. They might say, “teams increase efficiency by 3x” in their sales campaigns. Or they might use their high CAC-to-LTV ratio while pitching to investors.
While this is a good use of the metrics, it misses out on an important opportunity: Internal decision-making.
Use the insights from the metrics data to make decisions about product development, pricing, sales, marketing, customer service, etc.
SaaS companies have small teams working toward big things. Often, they might not have the time to dive deep into data and glean insights. What if you could automate that?
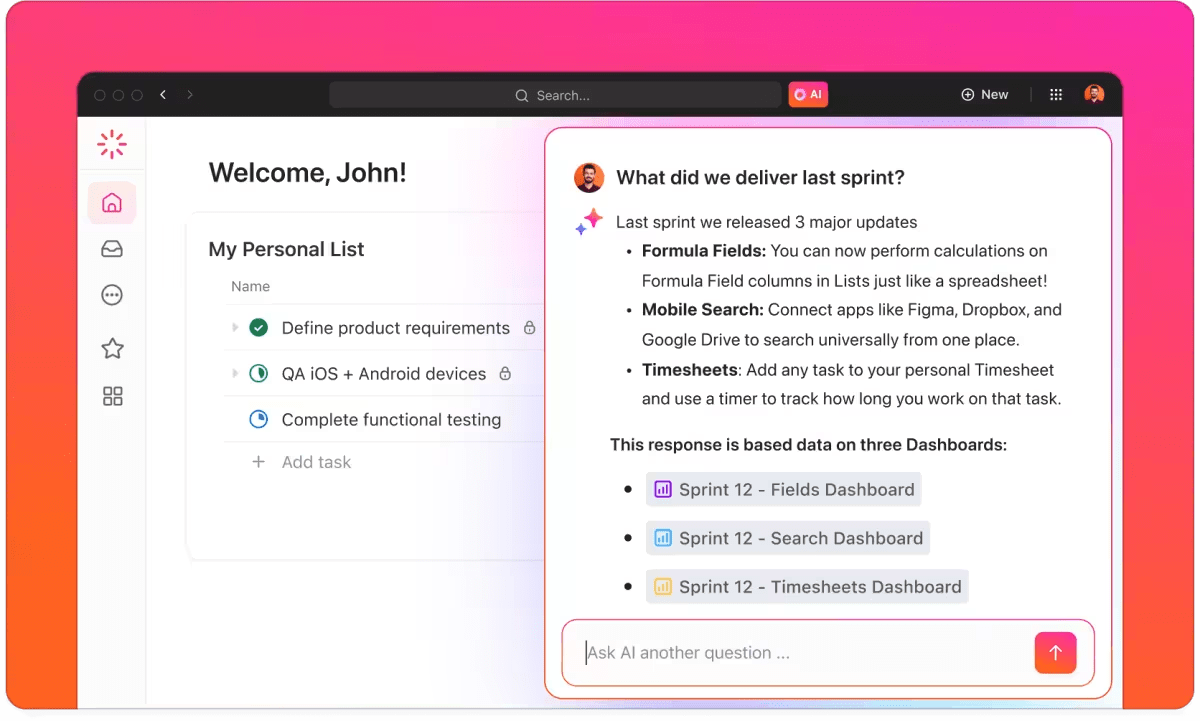
Choose a tool like ClickUp Brain that surfaces insights from any dashboard. Use it to glean insights and brainstorm ideas without distracting colleagues.
Despite your best efforts, not all metrics are meaningful. For example, if your ARPU is $10 because that is your only subscription tier, there is no point in creating a full-page report for it.
To keep your metrics meaningful and actionable, evaluate them regularly. Is your ARR too broad? Consider MRR. Is your ARPU constant but ARPA changing? Track that instead. Is your cash runway a good five years? Think about burn rate.
Set up time to evaluate and optimize your SaaS metrics to serve your needs best.
The journey to setting up and tracking your SaaS metrics will throw challenges at you. Here’s what you might face and how to avoid them.
SaaS, by its very nature, is a disruptive endeavor. SaaS businesses do things that haven’t been tried before, creating new possibilities. Like in anything new, there are mistakes they make along the way. Some of the most common ones are as follows.
Twitter followers, Instagram impressions, size of the email list—these are some common vanity metrics that SaaS businesses track because they’re easy. Sometimes, this creates a certain hype for the brand, even if it doesn’t reflect on business performance.
Avoid being swayed by vanity metrics. Focus on business goals. Derive relevant metrics from your objectives.
Data is powerful. It can reveal information that’s otherwise hidden away. Being data-driven is an effective way to make decisions. However, data is better at showing what than why. Your report might say that the sales in APAC are falling, but it can’t explain why.
Instead of blindly upping the sales effort in that region, trust the people on ground to understand the reasons. Place importance on qualitative insights and listen to theories. Circle back and use the data to validate these assumptions.
The apocryphal Henry Ford quote, “If I had asked people what they wanted, they would have said faster horses,” might not be authentic, but it’s widely used and hotly contested. Maverick entrepreneurs often believe that customers don’t know what they want. This is patently untrue.
Customers might not know how to create products that solve their problems, but they most certainly understand their problems best. So, ignoring customer feedback, especially in the highly competitive SaaS marketplace is a huge mistake.
Regularly seek feedback from customers.
Despite the high activity and rapid evolution, building a SaaS company is a marathon, not a sprint. Business leaders and investors run for years before achieving considerable revenue and profits.
During this run, it is easy to get swayed and derailed—especially when one gets tired and hopeless. Metrics play a key role in keeping you running and on track. Good SaaS metrics validate that the marathon is indeed worth running.
To be effective, SaaS metrics need to be accurate, up-to-date, relevant, and visual. ClickUp can help with precisely that.
With deep integrations, real-time updates, customizations, and pre-designed templates, ClickUp offers everything you need to track as part of your growth marketing strategies. The powerful project management features are the icing on the cake.What are you waiting for? On your mark, get set, and try ClickUp for free today.
© 2026 ClickUp