Using Product Analytics Data to Boost Customer Success and Marketing Strategies

Sorry, there were no results found for “”
Sorry, there were no results found for “”
Sorry, there were no results found for “”
You’ve just launched a new product and are super confident that users will love it. But a few weeks go by, and you notice it didn’t generate the buzz you expected. This is often what a product manager’s nightmares are all about!
Every product requires huge capital and resource investments, so its failure is a major setback—both in terms of finances and reputation.
Thankfully, you can easily avoid such losses by taking advantage of product analytics, analyzing user engagement, and identifying areas of improvement before it’s too late. Then, all you have to do is give the features or marketing strategies a makeover and reintroduce the product to dazzle your users and increase customer satisfaction.
In this article, we’ll reveal how to leverage product analytics to shape your customer success plans and initial marketing efforts. As a bonus, we’ll also introduce you to a top-notch product analytics solution that helps you monitor and analyze user interactions, identify trends, and improve your product strategy confidently. 😊
Product analytics is the process of examining how many users engage with your product or service and how often—the idea is to understand and monitor user behavior to generate actionable insights, which are then used to improve user experience and, by extension, product performance.
For example, imagine you’ve launched a media streaming platform. You’ll use product analytics to shed light on the most and least popular features, identify the titles generating heavy traction, and pinpoint features and titles your platform may be lacking. Based on these insights drawn from behavioral data, you’ll optimize your platform to offer a better customer experience.
Don’t confuse product analytics with data analytics, though.
Product analytics is super specific and focuses only on analyzing data related to a particular product or service to optimize its performance and ensure it aligns with customer needs.
Data analytics is a broader concept rooted in data science that goes beyond product usage. A data analyst deals with different datasets—can be from any source—and uncovers patterns and draws conclusions that support informed decision-making.
Product managers can confirm—some people get lucky and deliver a quality product that just clicks despite all odds. 🍀
However, you don’t want to rely on a stroke of luck or a hunch, not when you can use product analytics to get quantitative data on your product’s user engagement and market performance.
This approach to analytics is superior because it lets you evaluate your product from your users’ perspective and fix whatever needs to be fixed without overcomplicated procedures like the market funnel analysis or interpretation of raw product data.
Let’s go over five tangible benefits of product analytics:
Product analytics examines the current user engagement and product usage to identify trends, which you can leverage to adjust your marketing efforts and maximize product acceptance.
This is especially essential for industries like agile software development and products under the Internet of Things (IoT) umbrella, where responding to customer needs promptly makes a huge difference in terms of product popularity.
The best product analytics tools provide insight into the most valuable customers who spend more than average customers. You can use this usage data to figure out how to retain those customers and increase customer lifetime value, i.e., the total profit you can expect from a customer over their entire user journey.
By examining user behavior with a product analytics solution or by tracking a particular feature’s user engagement, you can create personalized experiences and win customer loyalty.
Understanding what your customers want helps you beat your competition and stand out as the market leader.
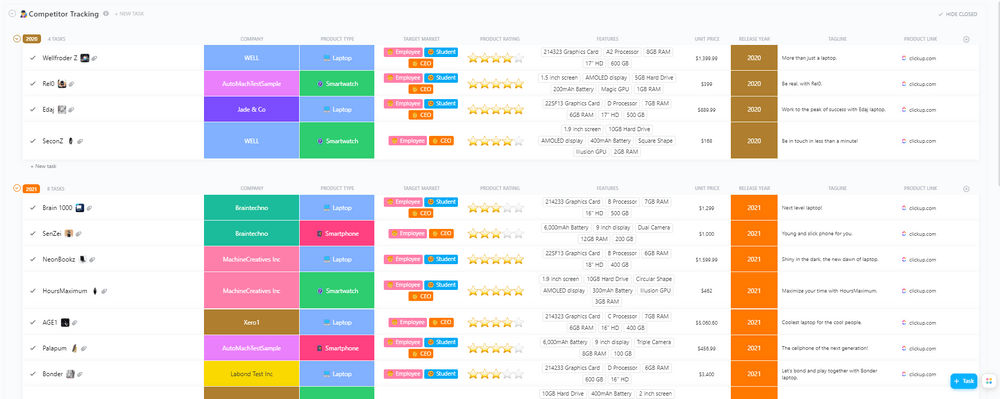
Tip: Use the ClickUp Competitor Tracking Template to keep tabs on the products, features, and marketing efforts of your top competitors, and use the data to shape your positioning strategy.
Product analytics tools help you keep an eye on key metrics that set the ground for smarter decisions for short-term profitability and long-term market penetration goals.
There are a bunch of product analytics metrics that product managers can track, but that doesn’t mean they should.
First off, analyzing everything isn’t the most economical option as making sense of trends and discoveries across multiple measurement tools would take ages. That’s why the best strategy is to observe a few key product analytics KPIs that:
Not sure where to start? Check out the common categories of product analytics performance indicators and metrics:
Reveals how your customers got to your product (i.e., through which channel), how they’re using it, what features they like the best or the least, and if there’s an X factor that keeps them hooked to your product.
These insights into the user journey help you optimize your product and marketing channels to keep new and existing customers engaged.
Returning, loyal customers are a huge win for your company and a clear sign that you’re doing something right. With customer retention analysis, you can measure how many users return to your business and how often. Based on the results, you can pinpoint inefficiencies and develop strategies for improved user retention across touchpoints.
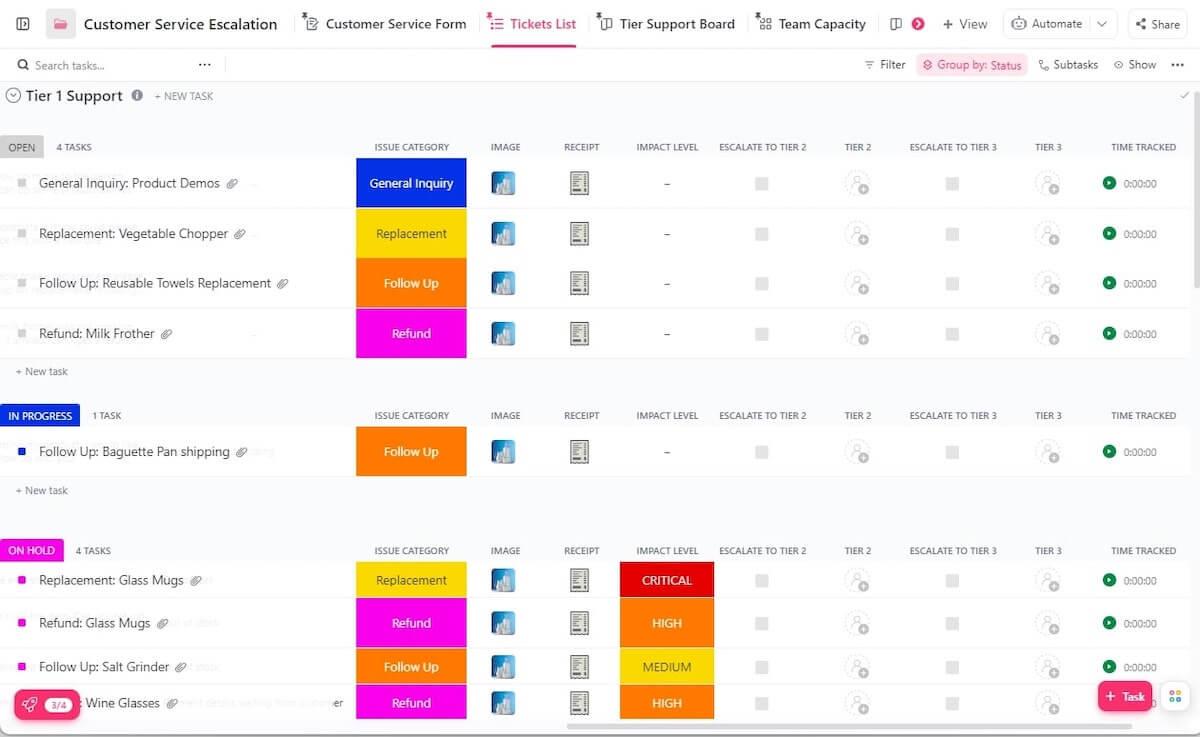
Must-try template: One of the tried-and-tested ways to retain customers is to listen to their issues and provide quality customer service. That’s precisely why you should use the free ClickUp Customer Service Escalation Template to identify urgent customer issues, identify escalation flows, and maintain consistent customer service across channels. 💯
Churn analysis tells you how many customers have stopped purchasing your physical or digital products or subscription services within a specific time frame, either monthly, annual, or quarterly. This product analytics KPI sheds light on potential disengagement or dissatisfaction points and helps you implement strategies to prevent the loss of customers.
Indicates how much money your customers are expected to spend on your products over time. This is one of the key metrics to track as it pinpoints high-value customers that directly boost your revenue.💲
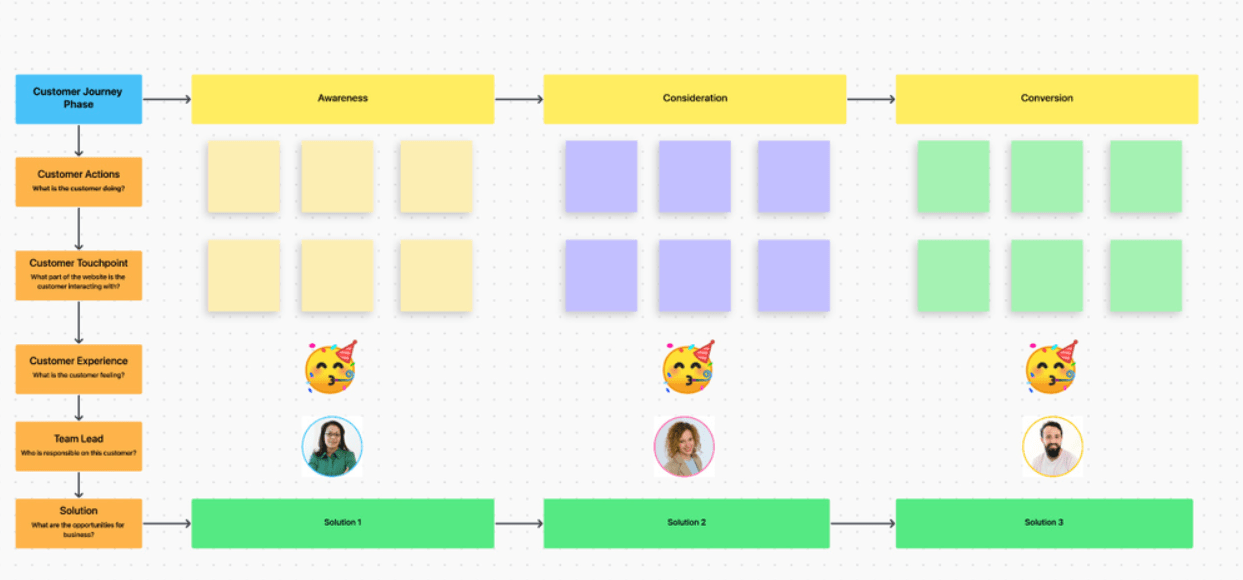
Need a quick map to visualize the lifetime touchpoints of different customer profiles? The ClickUp Customer Journey Map Template can help you design products and services aligned with your customers’ needs at various touchpoints.
This set of metrics shows how many people have used your product or service in the past month. Tracking monthly fluctuations can help you spot patterns and adjust your product strategy accordingly.
Try the ClickUp Sales Monthly Report Template for tracking user actions and product performance closely. This template has built-in metrics for tracking revenue and profit and loss, which makes it easier to stay on top of current market trends.
Web analytics tools, like Google Analytics, can make collecting data and monitoring key product analytics metrics a breeze. With Google Analytics, you can track session duration, bounce rates, and pages per session to gain a clear idea of how users interact with your website.
If you’re collecting product analytics data from multiple sources like web pages, customer relationship management (CRM) systems, and email repositories, you’ll need to learn more about extracting, transforming, and loading (ETL) data. ETL processes help you integrate behavioral data, ensure its consistency and quality, and prepare it for analysis.
Product analytics isn’t the same as marketing analytics.
Marketing analytics focuses on examining the performance of marketing activities to reveal the secret recipe for converting customers. Naturally, marketing KPIs differ from product analytics KPIs, although some serve both purposes.
However, marketing and product analytics share the same goal—improving customer loyalty and experience, so it’s understandable if they intersect in some aspects, such as:
Product analytics examine user behavior and engagement. These findings help you segment the market and understand how to approach each group. Plus, the valuable info on customer behavior can shape the entire marketing strategy and ensure the right users are targeted with the right tactics.
Analyzing product landing pages is important for both product analytics and marketing teams. Metrics like average time on page, bounce rates, and conversions can reveal whether users have successfully adopted a product and if certain product features and the landing page need tweaking.
One way to examine customer behavior and preferences is to conduct A/B testing, where you compare two versions of the same product to see which one performs better. The product manager uses this knowledge to determine the right direction for product development. On the other hand, the marketing team can base their campaigns on these results and ensure the marketing strategy represents the product in the best light.
Both marketing and product teams typically compile their analytics data in the same CRM system:
Product analytics puts a magnifying glass on your products and services and uncovers your good and weak practices, all for continuous product improvement and high customer satisfaction. 🔍
But that’s only if you use it right. Here are some tips and tricks that can help you maximize product analytics.
The first agenda on your product analytics to-do list is to define your objectives. 🗒️
They serve as the basis for establishing relevant metrics that keep your product teams on the right track.
Keep in mind that the goals you once defined aren’t set in stone—you can (and should) change them to reflect the latest changes in the market and user behavior. So, make it a habit to revisit them periodically (every month if you’re in a highly competitive industry).
Additionally, bolster your communication practices to ensure that your product teams are on the same page regarding these goals—otherwise, it’s easy to wander off course.
In order to leverage product analytics, you need to set some data governance ground rules. To do that, consider answering questions like:
In other words, you need data governance to define every data-related action and process to ensure security, compliance, reliability, and proper handling.
How well you’ll swim through the product analytics waters largely depends on your product management tool. 🏊
However, using multiple tools for analytics workflows isn’t viable or cost-efficient. If you want to streamline product analytics, define goals, implement data governance, import data, and collaborate and communicate with your team without interruptions, ClickUp is the way to go.
As a first-class product and project management tool available across desktop and mobile apps, ClickUp packs a punch with options that can revolutionize your product development, monitoring, and marketing processes.
The platform’s unique features make it a versatile actor—it can serve as a marketing analytics software, data visualization tool, or even an organizational wizard. 🧙
Let’s see why it should be your go-to product analytics software tool.
We’ve mentioned the importance of setting clear product analytics goals early on—they’re your north star. ⭐
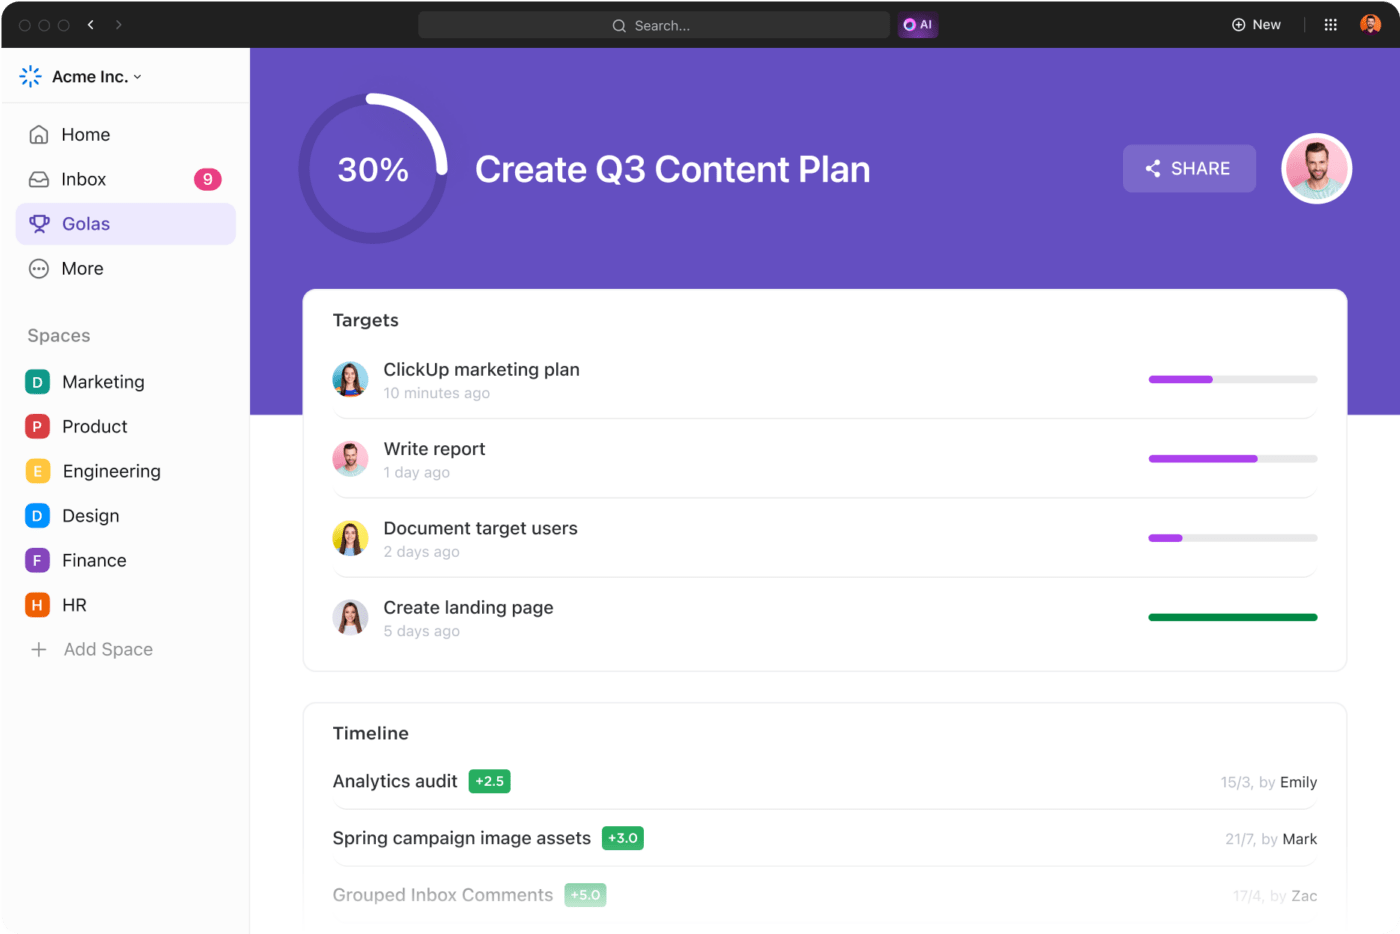
ClickUp has a special feature for defining objectives, and it’s called ClickUp Goals. With it, you can create timelines and set targets for tracking product progress.
Keep your Goals organized with easy-to-use Folders. This comes in handy when you’re managing multiple products as it ensures easy navigation and organization for each offering.
Since ClickUp is collaboration-friendly, you can add your product analytics teams to your Goals in a few clicks and ensure everyone’s on the same page about future tasks. This will help promote cross-functional collaboration without breaking a sweat! Plus, every change happens in real time, so you don’t have to worry about important updates slipping through the cracks.

Want to know how users interact with your physical and digital products or services? All you have to do is ask!
ClickUp Forms is one of 15+ ClickUp views that let you observe your projects or tasks from different perspectives and zoom in on the specifics. In this case, you’re focusing on collecting user feedback through written customer interviews within forms.
ClickUp Forms allows you to gather info from your customers and get accurate and detailed information about user engagement and overall sentiments and attitudes toward your product. Use ClickUp’s field types (located on the left side of the form) to capture responses, like email and ratings, and build the perfect evaluation tool.
ClickUp records the responses and automatically turns them into trackable tasks for your team, streamlining the product analytics process. 🥰

ClickUp has an entire feature set dedicated to product operations and management—the ClickUp Product suite.
One of the features you’ll find in this bundle is ClickUp Docs, an option for creating, organizing, managing, storing, and sharing documents. Here, you can create project plans and schedules, establish data governance rules, and organize feedback in an easily searchable format.

Invite relevant team members to a Doc and work together in real-time. If you come across hiccups or want to save some time and minimize mistakes, take advantage of ClickUp AI, an AI-powered work assistant.
It can summarize texts, brainstorm with you, put together product requirements documentation, and even check your spelling, grammar, and tone! ClickUp AI can also go through your product analytics findings and extract or summarize the most important insights. 💪
Furthermore, you can build detailed product roadmaps and brainstorm with your product teams using ClickUp Whiteboards. These infinite digital canvases give you tools for writing, drawing, leaving comments and notes, adding sticky notes, and creating connections between shapes.
All changes happen in real time, making Whiteboards ideal for hybrid or remote teams. Use Whiteboards to map out the customer journey, visualize user interactions, and create well-etched-out strategies for enhancing customer experience.

Visualize the gathered data with ClickUp Dashboards. Customize them to reflect any business scenario—in this case, you can use Dashboards to visualize feedback, usage patterns, and other actionable insights related to user behavior.
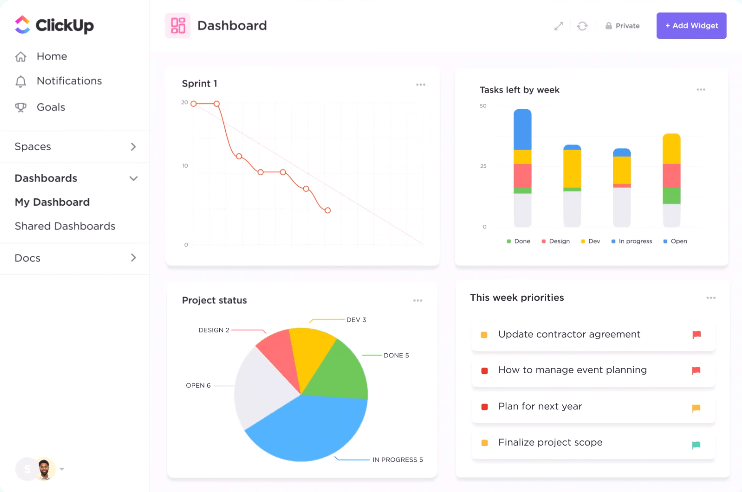
You get 50+ cards, charts, and graphs to choose from and build the perfect Dashboard—once you’re done, you can share it across teams or export it to PDF.
ClickUp features over 1,000 templates for various use cases, from marketing and operations to finance and accounting. Thanks to the impressive selection, product managers can be 100% confident they’ll find more than one template that supports their product analytics workflows.
Our recommendation is to explore the ClickUp product strategy templates. They help you record your product’s vision, identify customers, outline objectives, and define how you’ll create value for your customers.
Our favorite go-to template? The ClickUp Product Strategy Template!
If you’re looking for options that highlight clear communication and save time, check out ClickUp daily report templates. They help you regularly update your team on the work that was completed, set priorities, and plan ahead. Product managers can also benefit from customer journey templates.
It’s easy to get confused between business intelligence and analytics concepts.
Business intelligence focuses on analyzing data that helps organizations take informed next steps. Sounds similar to product analytics, right?
Business intelligence and product analytics share some similarities, but they differ in scope. Business intelligence tools analyze product and customer data on a much bigger scale, often using complex procedures. They reveal info about the entire company’s performance, while product analytics tools focus only on data that could be relevant for optimizing a specific product.
As business intelligence tools are packed with robust features for data integration, analysis, and visualization, you could definitely add them to your product analytics toolbox. Still, everything you need from business intelligence can also be available in quality product analytics software tools.
The product analytics market has been growing steadily. The market grew significantly even during the COVID-19 pandemic, and further research predicts that the global product analytics market will grow to a whopping $16.69 billion in 2028 (it was at just $5.25 billion in 2020!).
Factors like market segmentation, the need for continuous improvement, and competitive markets fuel this expansion and emphasize the importance of product analytics in all spheres.
It’s safe to assume that we’ll see even more AI and machine learning in product analytics tools. Expect even more personalization, especially in terms of offering unique customer experiences.
Just like now, strategic management and smart decision-making will dictate the success of your product analytics efforts and help you optimize resources to maximize results.
Thorough product analytics gives you all the info you need to create a high-value product or service.
ClickUp’s powerful features make it an excellent product analytics tool. Use it to collect and visualize data on user behavior, identify areas of improvement, and come up with strategies that will jumpstart success.
Sign up for ClickUp and start exploring its product analytics superpowers today! 🦸

Praburam Srinivasan
Max 20min read

Arya Dinesh
Max 16min read

Garima Behal
Max 12min read

© 2026 ClickUp


