
Sorry, there were no results found for “”
Sorry, there were no results found for “”
Sorry, there were no results found for “”
There are several ways to ensure a project’s success.
You can establish clear escalation paths when issues arise, set up automated tracking systems for continuous progress updates, and implement regular performance reviews to assess and adjust your project strategy.
The best part? When you focus on these areas, the project achieves the desired quality levels, fulfills important objectives, and exceeds expectations.
That’s the power of Project Quality Management (PQM).
But what does the term mean? What are the benefits it provides? Which strategies and tools come in handy for establishing quality in project management?
We’ll discuss all that and more in this blog post. Let’s get started. 🎢
Project quality management (PQM) refers to the systematic process of planning, managing, and controlling a project’s quality to ensure its deliverables align with the agreed-upon quality standards, are fit for purpose, and meet stakeholder requirements.
Project quality management has three key components:
Let’s understand these project phases better with an example. Imagine a SaaS company is launching a new feature.
As a project manager, the last thing you want to deal with is siloed teams that don’t communicate with each other.
With quality project management resources, you can foster cross-functional discussions and ensure the visibility of all tasks across teams.
This collaboration leads to faster problem-solving and more cohesive project execution—critical for complex tasks, such as product design and event planning, that demand input from all corners to stay on track.
PMI reports that 55% of project managers cite budget overruns as a reason for project failure.
This could happen for several reasons:
Project quality management offers effective budget management control and ensures the project remains financially viable at every stage.
To this end, you can leverage quality management software, which offers predictive analytics, enabling you to make informed adjustments to anticipate cost fluctuations and resource needs.
By continuously monitoring processes and outcomes from start to finish, project quality management ensures that the quality standards are met. This framework allows the project team to spot and fix inefficiencies early, reducing the need for costly rework and delays.
The result? A more reliable product that syncs with your original goals and quality requirements and boosts customer satisfaction.
PQM ensures that projects are delivered on time, within budget, and to the highest quality standards. Minimizing errors and consistently meeting expectations fosters trust and strengthens customer relationships.
Project teams use the quality management plan to clarify roles, responsibilities, and deadlines. It equips you to remove any project ambiguity from the beginning and enables your project management team to focus on what matters, i.e., getting the job done on time.
“Inspection with the aim of finding the bad ones and throwing them out is too late, ineffective, and costly. Quality comes not from inspection but from improvement of the process.”
Managing your project’s quality has several moving parts—from targets to define, resource allocation, tracking progress, and ensuring the costs don’t skyrocket.
This is where ClickUp’s Project Management Platform comes to your rescue. Here’s how it serves as a single source of truth for quality management, regardless of the project’s complexity.

At the start of your project, you’ll typically lock down the scope, budget, and timelines. This is also the time to clarify what ‘quality’ means for your project.
Example: Aim for a defect rate below 2% during product testing or commit to achieving a 99.9% uptime goal for your software application. Whatever the target—ensure it’s specific and tied directly to your project’s success.
To make tracking simple, integrate these targets into ClickUp Goals.
Set and monitor quality benchmarks—whether numerical (e.g., reduce defects by 10%), true/false (e.g., vendor compliance met/not met), or monetary (e.g., stay under a certain budget for rework due to quality issues).

Group your quality objectives into folders, such as ‘Quality Assurance’ or ‘Supplier Compliance,’ on ClickUp and track their status across the project timeline. This ensures your team is focused on quality from the start, with no surprises down the road.
You can also control who accesses Goals, set one or multiple owners, and easily manage ‘view and edit’ permissions from within the platform.
I believe the communication for our larger projects, between teammates has improved. Being able to get direct conversations on a specific task or subtask has helped quality and reduced confusion.
Once your quality goals are set, the next step is building a monitoring system. This is where a solid Quality Management System (QMS) or project quality management plan enters the picture.
Think of it as a roadmap that helps:
When you’re setting the quality management plan, you want to gather feedback from your team members and the leadership. ClickUp Forms lets you capture responses in a structured format. They’re easy to set up and customizable for any intake process.
To make your job easier, ClickUp Automations turns form responses into tasks that plug directly into your workflows.
Further, ClickUp’s Gantt Chart View visualizes your project timeline. From cascading views to lightning-fast sorting and filtering, it simplifies organizing project jobs. With a single click, you can create tasks, add dependencies, and reschedule your work.

💡Pro Tip: Plus, you don’t have to chase down status updates manually. The Critical Path feature identifies tasks impacting your deadline, and Slack Time highlights tasks with flexible schedules. You’re notified of every progress status within the platform with trigger alerts.
Consistency in project quality management is key, too.
By standardizing your quality checks and processes, you avoid misunderstandings and ensure the whole team is on the same page.
Whether it’s step-by-step guidelines for quality control tasks or audit documentation, store everything centrally with ClickUp Docs, so no one has to guess what needs to be done.z
You’re already collecting tons of data on your projects—performance metrics, testing results, and audit findings. Instead of reacting to issues after they occur, why not predict and prevent them?
Predictive quality analytics analyze historical data to help you anticipate where quality issues will likely emerge in your project. For example, maybe a certain phase of the project frequently hits snags, or specific metrics flag recurring defects.
The good news is you don’t need complex algorithms to get started. With ClickUp’s quality control templates, you can streamline your workflows and ensure your project outputs always meet the highest standards.
For instance, with Custom Statuses like ‘Critical Risk’ or ‘Needs Review,’ you can automatically trigger alerts to your team members to act quickly before small issues become major setbacks.
They can log results on ClickUp Docs and push updates via Assign Comments on ClickUp, moving issues through the approval process and keeping everyone in the loop.
ClickUp’s RAG Reporting Template simplifies real-time reporting on project progress based on a Red, Amber, and Green color-coding system. Use it to quickly organize tasks by risk level, visualize progress with clear color coding, and track performance metrics for informed decisions.
➡️ Read More: Take project management automation to another level with ClickUp
Quality management isn’t a ‘set it and forget it’ task, even with the best planning. To ensure lasting success, you must build a culture of continuous feedback and improvement throughout your project’s life cycle.
To implement this, you need a tool that provides live, actionable insights into your project activities. ClickUp Dashboards enable you to visualize all relevant metrics in real time.

ClickUp enables you to choose from 50+ widgets that display key metrics and control charts related to project management, such as Tasks, time tracking, Goals, and sprint performance.
For example, burndown charts and velocity tracking provide a snapshot of your team’s efficiency, while task completion rates show progress toward key milestones.
Want to see if your team is overloaded or underutilized?
ClickUp’s Workload View gives you a clear view of how tasks are distributed across the team. You can make real-time adjustments to task assignments, ensuring resources are utilized effectively.

In addition, create detailed reports on various aspects of your project—like defect rates, adherence to scope, or customer satisfaction—and distribute them to the team from the platform itself for further discussions and analysis.
Lastly, ClickUp Brain, ClickUp’s built-in AI assistant, offers instant answers to questions about your project by searching data across all Dashboards. It minimizes the need for manual data searches, surfacing critical insights quickly and freeing up teams to focus on execution.
Whether you need to check project status, workload balance, or quality metrics, the built-in AI project and knowledge manager provides instant feedback to help you monitor project performance.

💡Pro Tip: When your project ends, use post-mortem templates to document whether the deliverables were met, identifying the wins and obstacles and reflecting on the lessons learned.
Now that we’ve discussed project management tips for defining and maintaining quality, let’s examine the tools and frameworks that can make this job much easier for you.
An affinity diagram is a tool for organizing a large number of ideas, data points, or research findings into natural groups based on their relationships. This method helps make sense of scattered information, revealing patterns and insights that are not immediately obvious.
ClickUp’s Affinity Diagram Template provides a visual structure for clustering ideas, mapping out tasks, identifying trends, and keeping the project on track.
This Whiteboard template lets you:
Use case: During brainstorming sessions or when trying to solve complex problems.
A matrix diagram is a chart that displays the relationship between two or more sets of elements. It compares different variables—such as time, cost, and resources—and helps understand how they influence one another.
For instance, you can use the ClickUp Impact Effort Matrix Diagram Template to evaluate the value of tasks and their associated efforts, ensuring high-priority projects are tackled efficiently.
The template gives you access to:
Use case: During decision-making when multiple factors impact quality.
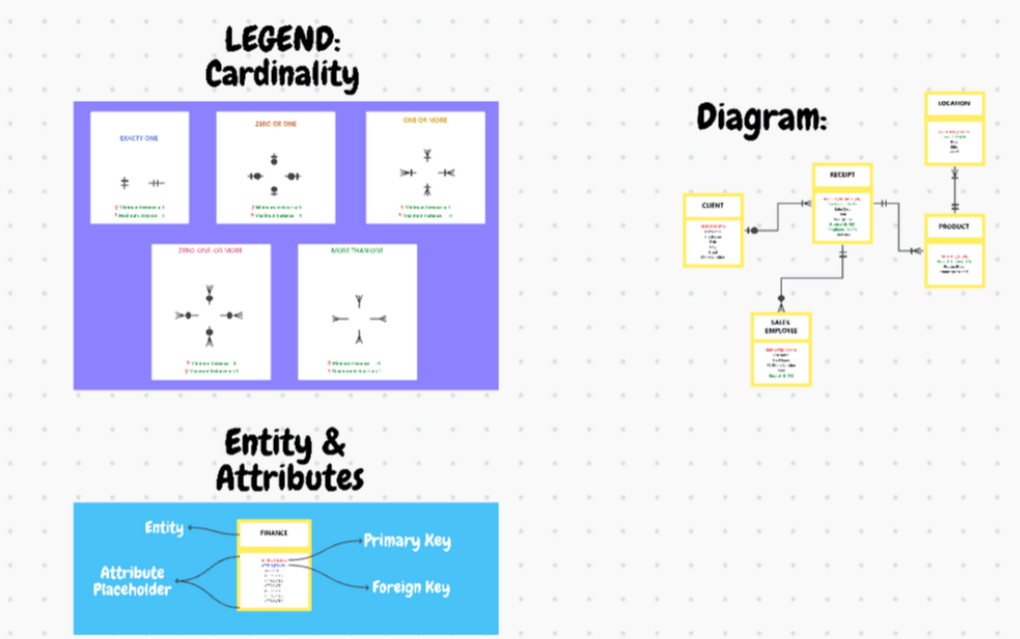
An interrelationship diagram illustrates the cause-and-effect relationships between various elements in a system. It identifies and maps out the most significant influences in a complex situation, such as how various team dynamics influence project outcomes.
The ClickUp Entity Relationship Diagram Template, for example, enables you to trace root causes and manage interdependencies in your project tasks.
You can:
Use case: When problems have multiple causes—to map interactions between causes and uncover the most critical ones.
A control chart is a statistical tool used to track process performance over time. It shows how a process behaves, whether it’s stable, and if any variations occur outside set limits, helping ensure consistency and quality.
A project management chart could be used to monitor production timelines and detect deviations in delivery schedules. However, ClickUp’s Action Plan Template, which also doubles as a control chart, offers a more specialized solution for visualizing process stability, tracking variations, and maintaining control over project quality and outputs.
You can typically:
Use case: In quality control during project execution as it provides visual feedback on whether the processes are stable and functioning as expected.
A prioritization matrix is a structured framework that ranks or prioritizes a set of items, typically tasks, based on certain criteria like importance or urgency.
Whether you’re running a large-scale project or just starting out, use ClickUp’s Prioritization Matrix Template to prioritize customer issues based on severity and time to resolution.
Here’s how it stands out:
Use case: When you’re managing limited resources and need to prioritize the most impactful areas for quality improvement.
A flowchart visually represents a process or workflow, detailing the steps sequentially—to understand how different components are interconnected.
With the ClickUp Flowchart Template, you can easily define every step of your process, highlighting bottlenecks, taking corrective action, and improving efficiency.
Whether you’re a business owner or individual, you’ll find it useful for:
Use case: To outline quality management processes, diagnose inefficiencies, and improve clarity around workflows.
A Pareto chart is a bar graph that highlights the most significant factors contributing to a problem or effect, following the Pareto Principle (80% of problems come from 20% of causes).
For example, you could use a Pareto chart to identify which customer complaints are causing the most dissatisfaction and fix them quickly.
Use case: During root cause analysis, the Pareto Chart helps identify the primary cause of defects.
A cause-and-effect diagram, or fishbone diagram, is a tool for identifying the root causes of a problem. It categorizes potential causes into major groups (like people, methods, and materials) and shows how they might contribute to the issue.
The ClickUp Fishbone Diagram Template lets you systematically analyze problems, ensuring all potential causes are explored and addressed.
You can:
Use case: To explore the contributing factors and identify why a project consistently runs behind schedule. This is helpful in construction projects, where supplier delays and resource shortages can adversely affect the bottom line.
Benchmarking involves comparing your project’s performance, processes, or metrics to industry standards or competitors.
You can use the ClickUp Benchmark Analysis Template to define service delivery times or patient satisfaction metrics against those of top-performing hospitals to enhance quality.
Use this template to:
Use case: To identify gaps, set performance goals, and implement improvements. For instance, you might benchmark your team’s productivity against industry leaders to determine areas that need fixing.
A quality audit formally reviews your project processes, procedures, and outputs to ensure they meet defined quality standards.
Use case: In project management for IT projects, a quality audit might review software build practices to identify issues like coding inefficiencies, non-compliance with security standards, and missed documentation.
Managing quality isn’t linear; it often involves balancing several project constraints.
You may need a PQM software at the time of:
🎯 Setting clear project quality standards and defining acceptance criteria for deliverables
🎯 Monitoring ongoing processes to ensure adherence to quality standards and identify issues early
🎯 Verifying that deliverables meet the defined quality benchmarks before final approval
🎯 Conducting audits or reviews to assess overall project quality and document lessons learned
High-quality projects are cost-effective, meet customer demands, and help you get more business in the long run. This doesn’t happen overnight or by accident.
A robust project management software like ClickUp helps lay the blueprint for project quality management.
With real-time updates, resource management functionalities, and performance insights, ClickUp supports all aspects of quality control in project management.
So what are you waiting for? Sign up for ClickUp for free and find out how quality in project management increases efficiency.

Praburam Srinivasan
Max 24min read

Jeremy Galante
Max 21min read

Manasi Nair
Max 18min read

© 2026 ClickUp