


Still downloading templates?
There’s an easier way. Try a free AI Agent in ClickUp that actually does the work for you—set up in minutes, save hours every week.
Sorry, there were no results found for “”
Sorry, there were no results found for “”
Sorry, there were no results found for “”
Research consistently shows that companies with granular visibility into their financial performance make better strategic decisions. And yet, most finance teams still waste hours each month rebuilding the same margin calculations in disconnected spreadsheets.
This guide walks you through 10 margin analysis templates—from break-even calculators to competitive pricing frameworks—so you can stop reacting to profit erosion and start making faster, data-backed decisions that protect your bottom line.
| Template Name | Download Link | Ideal for | Best features |
| Product Pricing Template by ClickUp | Get free template | Product managers, e-commerce teams, and anyone launching new products | Calculates optimal pricing using production costs, competitor pricing, and target margins; tracks cost components (materials, labor, etc.) with Custom Fields; ClickUp Brain can analyze historical pricing and suggest margin-optimized price points |
| Break-even Analysis Template by ClickUp | Get free template | Startups, new product launches, and finance teams evaluating project viability | Calculates exact break-even revenue/volume for fixed and variable costs; auto-updating break-even charts when assumptions change; connect to Dashboards to monitor progress toward break-even targets across products |
| Cost Analysis Template by ClickUp | Get free template | Operations teams, procurement managers, and CFOs leading cost-reduction initiatives | Breaks down costs by category (direct/indirect, fixed/variable); separates controllable vs non-controllable costs for focused optimization; Automations can flag categories that exceed preset thresholds |
| Production Cost Analysis Template by ClickUp | Get free template | Manufacturing teams, production managers, and operations leaders | Unit-level cost tracking (materials, labor, overhead) that rolls up into margin views; connect production cost data to inventory and sales tasks for end-to-end margin visibility |
| Competitive Analysis Pricing Template by ClickUp | Get free template | Marketing teams, product strategists, and business development managers | Combines competitor pricing intel with your own cost structure; side-by-side Views comparing your margins vs estimated competitor margins; ClickUp Brain can summarize competitor pricing trends from Docs to surface margin opportunities |
| Price List Template by ClickUp | Get free template | Sales teams, account managers, and finance departments | Central “single source of truth” for pricing, costs, and margins; version history plus approval workflows for authorized price changes; filtered views to limit margin visibility while sharing final prices broadly |
| Financial Analysis Report Template by ClickUp | Get free template | Finance teams, analysts, and executives needing structured financial reporting | Framework for margin trends, profitability ratios, and period-over-period comparisons; pre-built sections for liquidity, efficiency, leverage ratios; dynamic reports in Docs that can pull real-time data from connected Dashboards |
| Cost-benefit Analysis Template by ClickUp | Get free template | Project managers and executives evaluating new initiatives or operational changes | Built-in ROI and payback period calculations; supports structured cost-benefit comparisons; connect analysis to project tasks to track whether projected benefits and margins materialize |
| Profit Margin Template (CFI) | Download template | Finance professionals and analysts who prefer working in Excel | Excel-based gross/operating/net margin calculations with industry-standard formulas; includes explanations of margin types and use cases; good for one-off analysis (but lacks collaboration/automation for teams) |
| Contribution Margin Calculator (Coefficient) | Download template | Teams in Google Workspace needing quick contribution margin calculations | Instant online calculator for quick checks; downloadable Google Sheets template for deeper analysis; useful for unit economics (but limited for historical trends and complex multi-product tracking) |
When your CFO asks for margin data by product line during a quarterly review, the last thing you want is to discover three different spreadsheets with three different answers—each ‘updated’ by a different team member last month.
A margin analysis template is a pre-built framework that solves this. It’s designed to calculate and track the difference between your revenue and costs, giving you a clear picture of profitability across products, services, or entire business units.
It standardizes your calculations, centralizes your data, and gives you a repeatable workflow for tracking profitability—whether you’re focused on gross margin, contribution margin, or net profit margin.
These templates are essential for finance teams, business owners, and operations managers who need to understand profitability without the spreadsheet headache. They standardize your calculations, centralize your data, and create a repeatable workflow for tracking key metrics.
A good template typically includes:
While many teams start with a profit margin calculator in Excel, this approach often creates version control nightmares and data silos. Using a template within a connected workspace ensures everyone is working from the same numbers, giving you reliable insights when you need them most.
📮ClickUp Insight: 44% of our survey respondents use spreadsheets to manage their projects and tasks. But spreadsheets were never designed for evolving workflows.
As your projects grow more complex, keeping statuses, timelines, and assignments up to date becomes a manual, time-consuming task.
A converged AI Platform like ClickUp solves this problem with purpose-built Views like List, Table, Calendar, and Gantt. That means, you get to visualize tasks in a way that makes sense for you and your team.
Set up trigger-based Automations to update fields and statuses as work moves forward, and suddenly, manual updates become a thing of the past.
🎥 Are you using the right tools to get over the repetitive data entry your work naturally requires? This video shows you what to look for.
Below, we’ve organized 10 analysis templates by use case—from quick profit calculations to comprehensive financial analysis—so you can jump directly to what fits your needs.
Setting a price without knowing if it’s profitable is a huge risk. ClickUp’s Product Pricing Template helps you avoid that by calculating optimal pricing based on production costs, competitor pricing, and your target profit margins. It ensures your pricing strategy is driven by data, not guesswork.
🚀 Ideal for: Product managers, e-commerce teams, and anyone launching new products
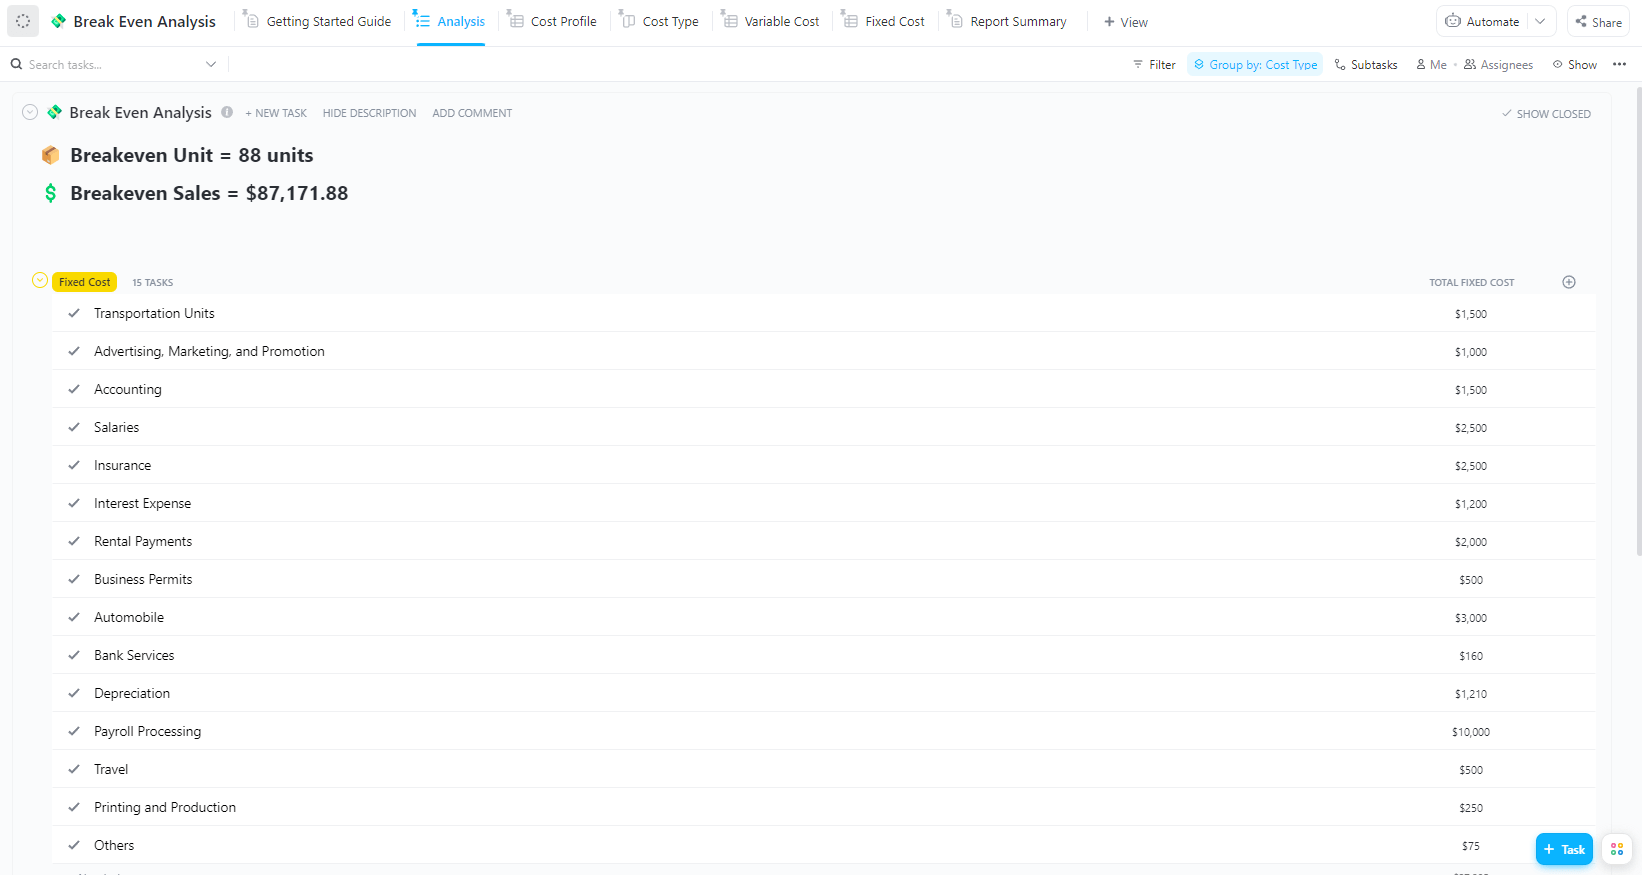
Wondering if a new product or project is financially viable? The ClickUp’s Break-Even Analysis Template calculates the exact sales volume or revenue needed to cover all your fixed and variable costs. It shows you the precise point where you stop losing money and start turning a profit.
🚀 Ideal for: Startups, new product launches, and finance teams evaluating project viability
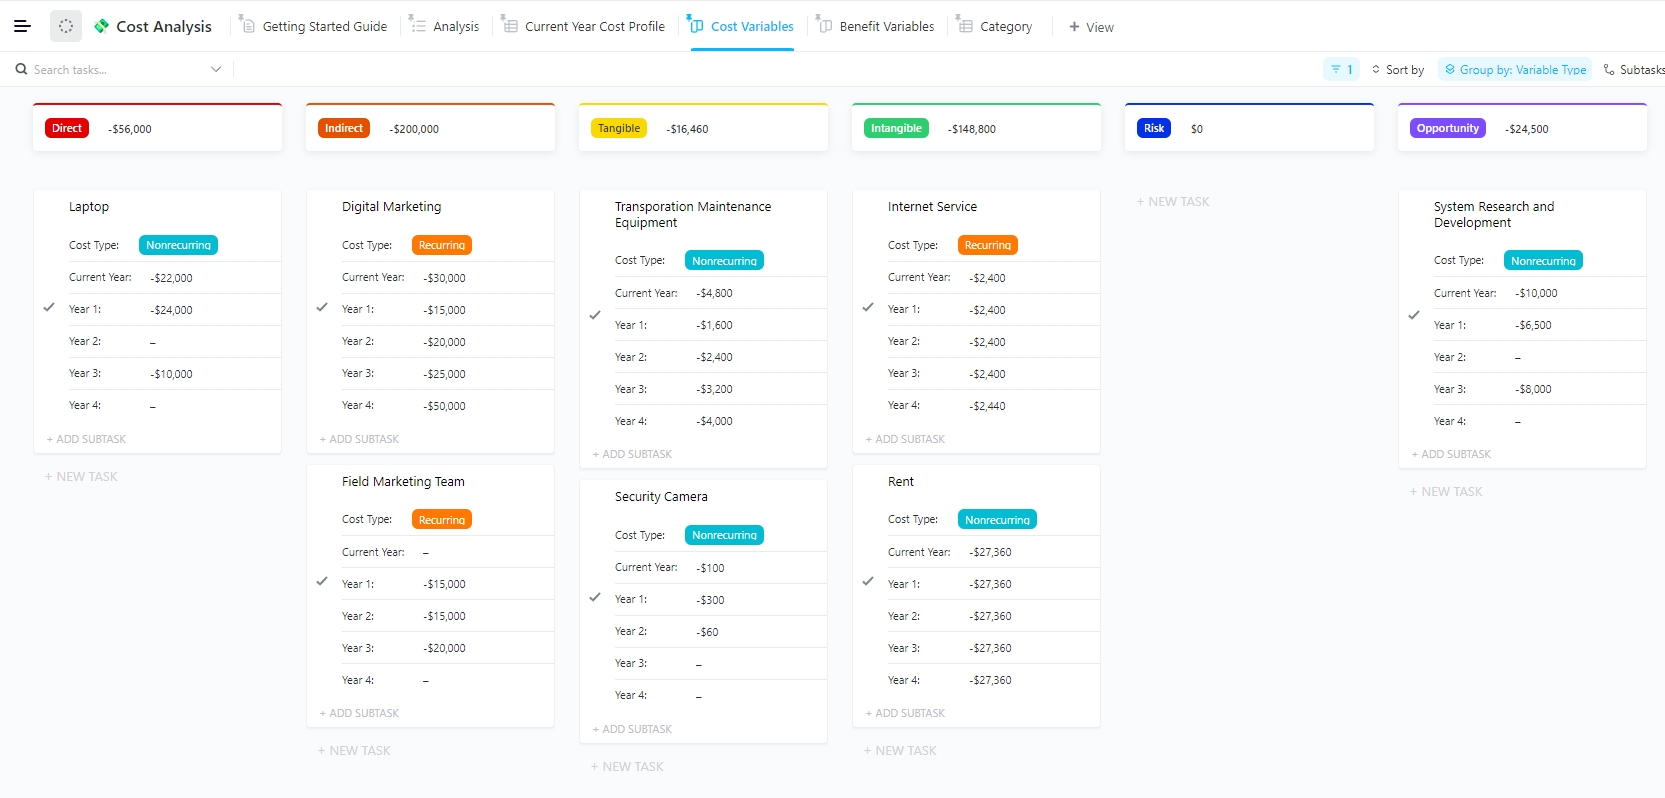
Your margins are shrinking, but you can’t figure out why. ClickUp’s Cost Analysis Template helps you diagnose the problem by breaking down all your cost categories—direct, indirect, fixed, and variable—to identify exactly where money is going.
🚀 Ideal for: Operations teams, procurement managers, and CFOs leading cost-reduction initiatives
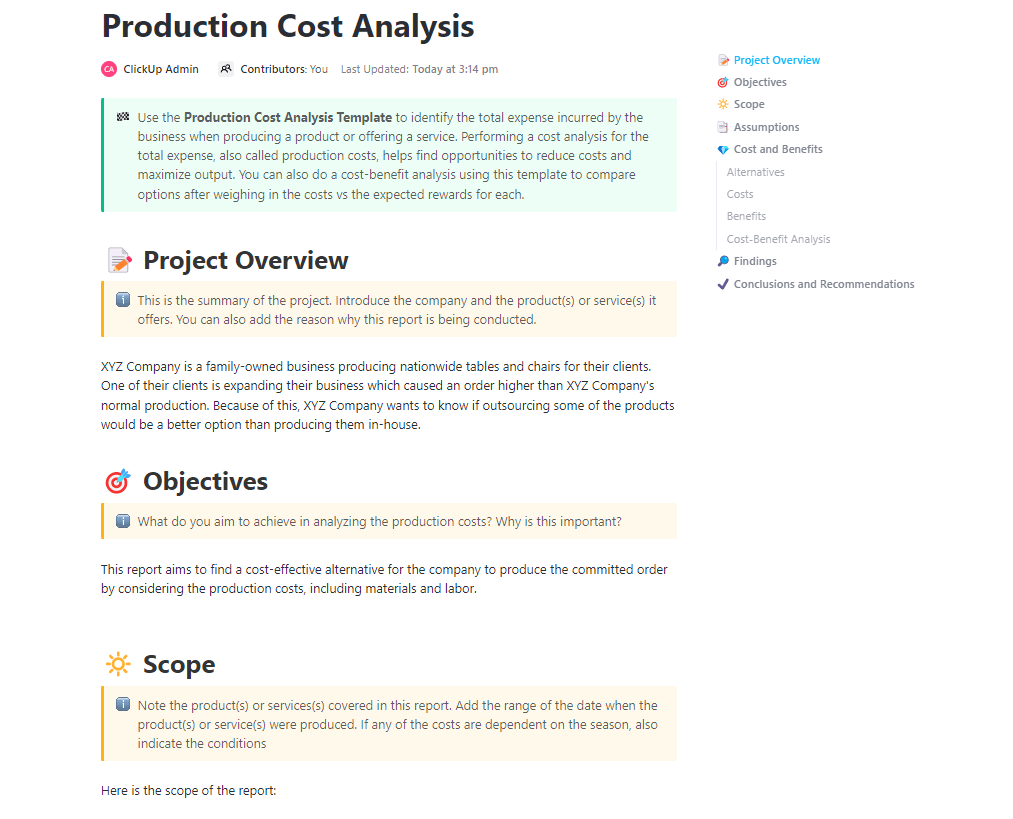
ClickUp’s Production Cost Analysis Template gives you granular visibility of production costs by tracking them at the unit level, including materials, labor, and overhead. This allows you to calculate precise margins for each product you make.
🚀 Ideal for: Manufacturing teams, production managers, and operations leaders
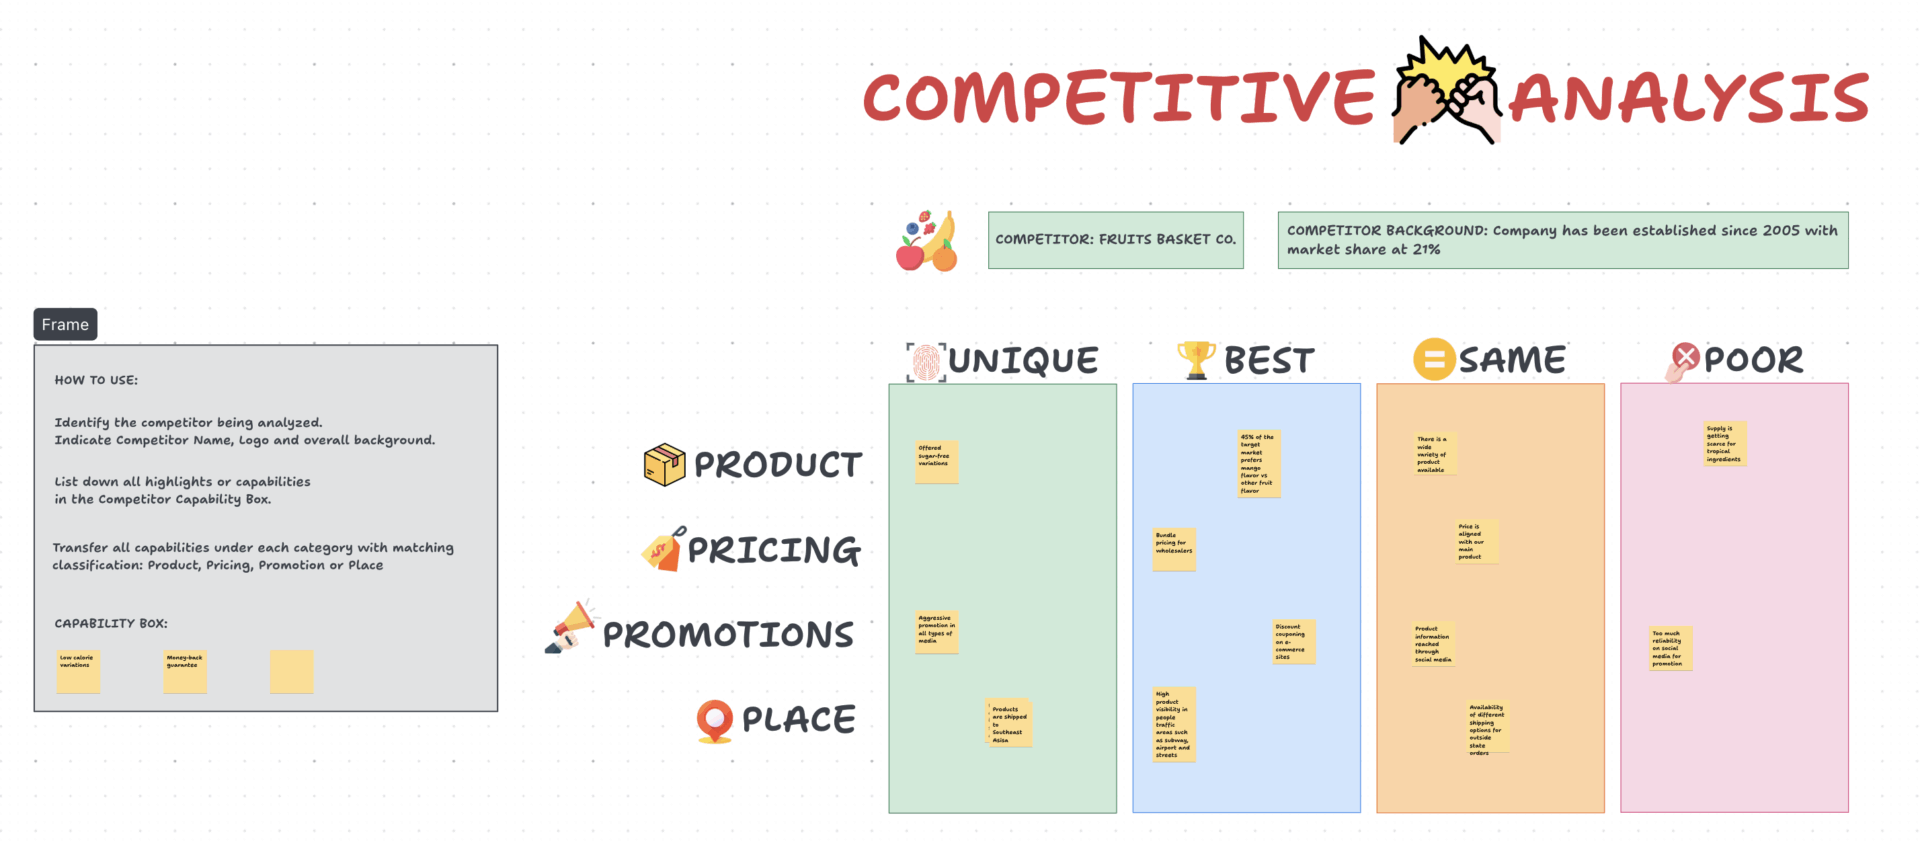
Pricing in a vacuum is a recipe for failure. ClickUp’s Competitive Analysis Pricing Template helps you price competitively without sacrificing profitability by combining competitor pricing intelligence with your own cost structure. You can use it to easily identify pricing opportunities and margin gaps in the market.
🚀 Ideal for: Marketing teams, product strategists, and business development managers
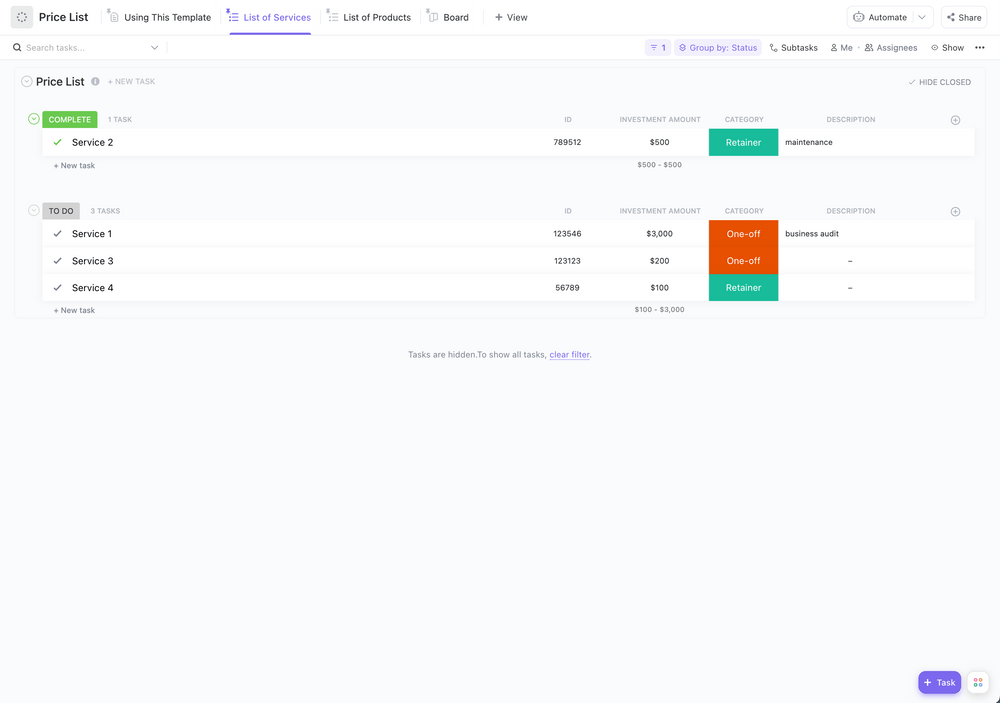
Tired of the “which spreadsheet has the current prices?” chaos? ClickUp’s Price List Template centralizes all your product and service pricing, along with associated costs and margins, into one organized and reliable view. It becomes the single source of truth for pricing across your entire organization.
🚀 Ideal for: Sales teams, account managers, and finance departments
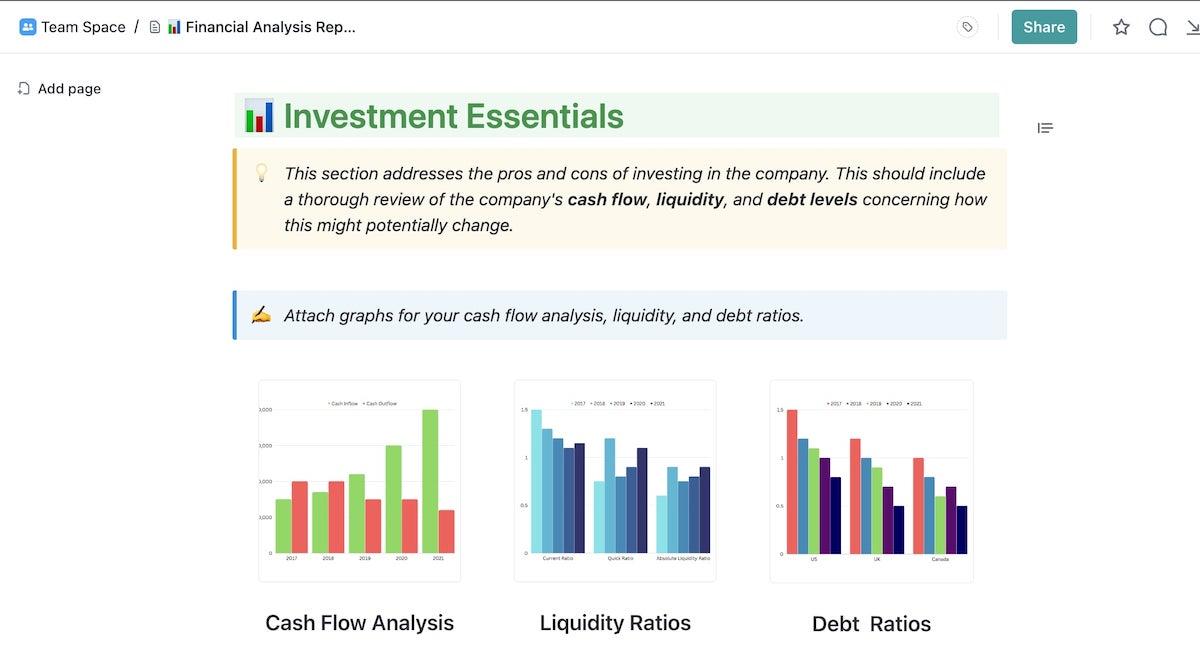
Basic margin calculations are good, but executives need the full story. This ClickUp’s Financial Analysis Report Template provides a comprehensive framework for analyzing your company’s financial performance, including margin trends, profitability ratios, and period-over-period comparisons.
🚀 Ideal for: Finance teams, analysts, and executives who need structured financial reporting
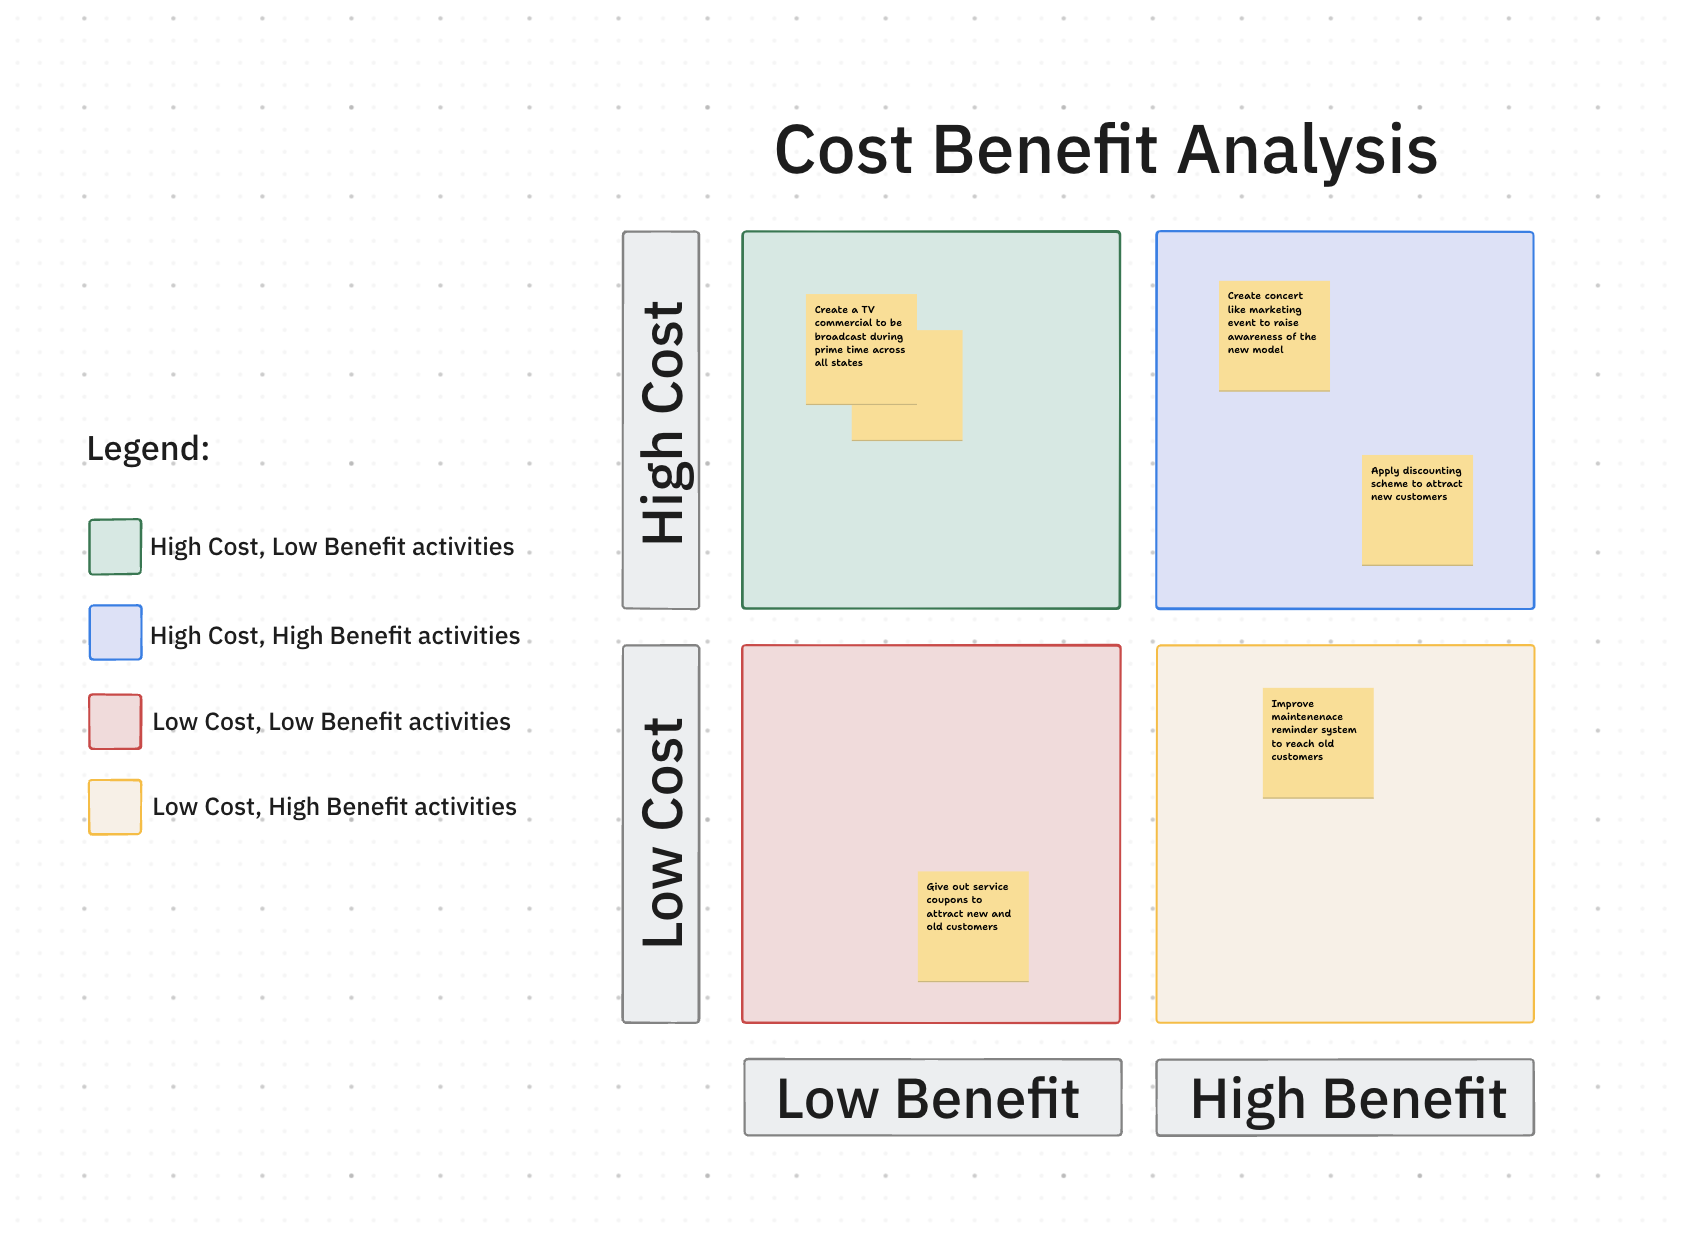
Every new project or investment is a bet. The Cost Benefit Analysis Template by ClickUp helps you make smarter bets by performing a cost-benefit analysis that weighs the costs of a decision against its expected benefits. It includes built-in calculations for ROI and payback period to determine if the margin on an investment makes financial sense.
🚀 Ideal for: Project managers and executives evaluating new initiatives or operational changes
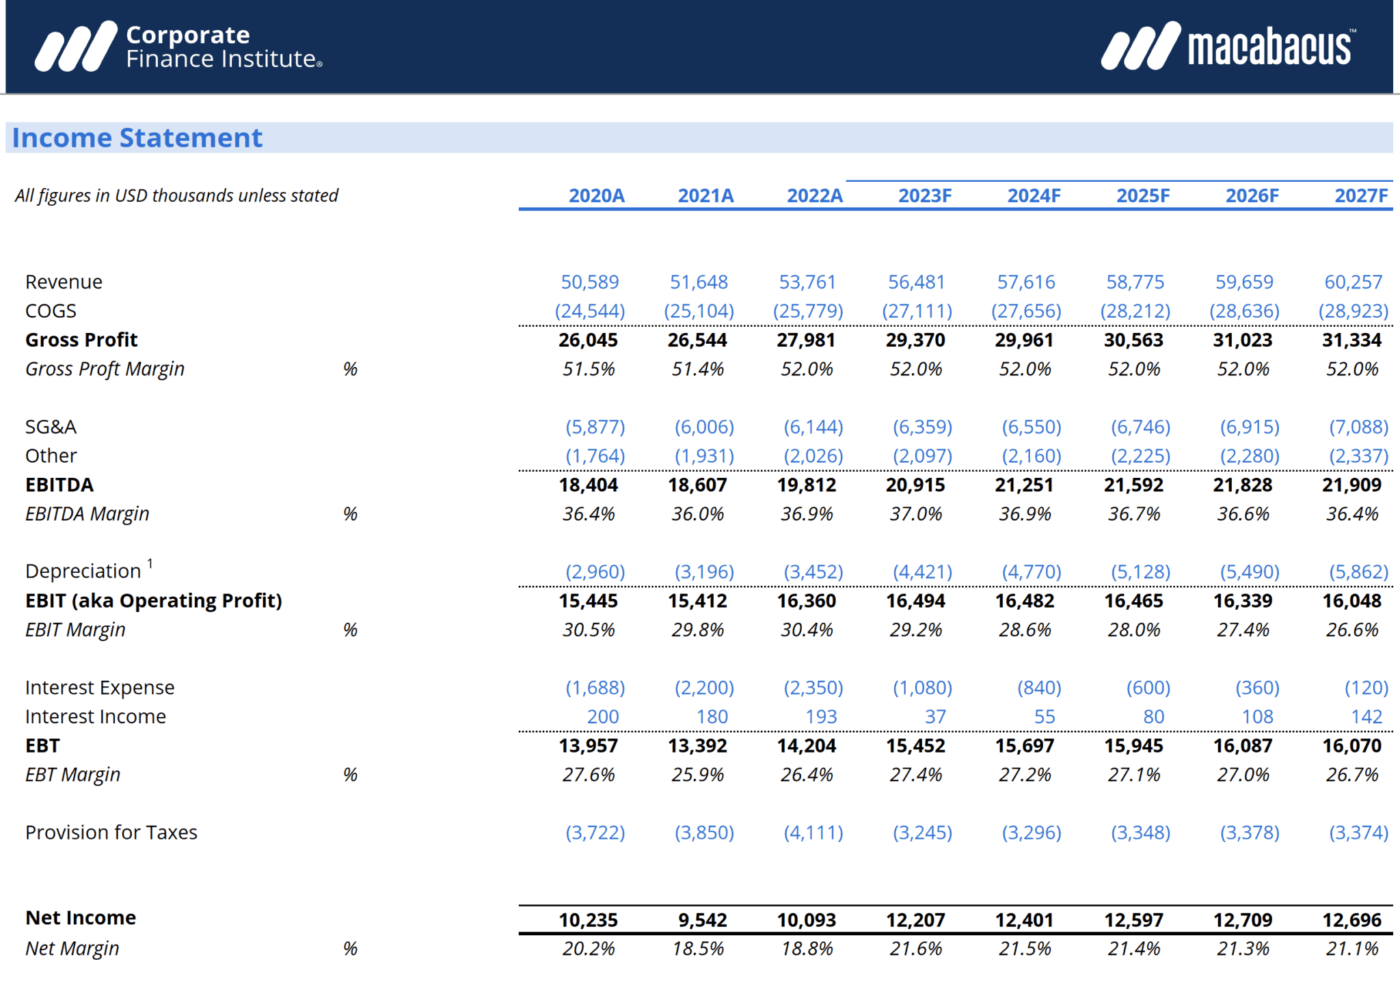
Corporate Finance Institute (CFI) offers a robust, Excel-based Profit Margin Template for calculating gross, operating, and net profit margins using industry-standard formulas. It’s a great starting point for finance professionals who live in spreadsheets.
🚀 Ideal for: Finance professionals and analysts who prefer working in Excel
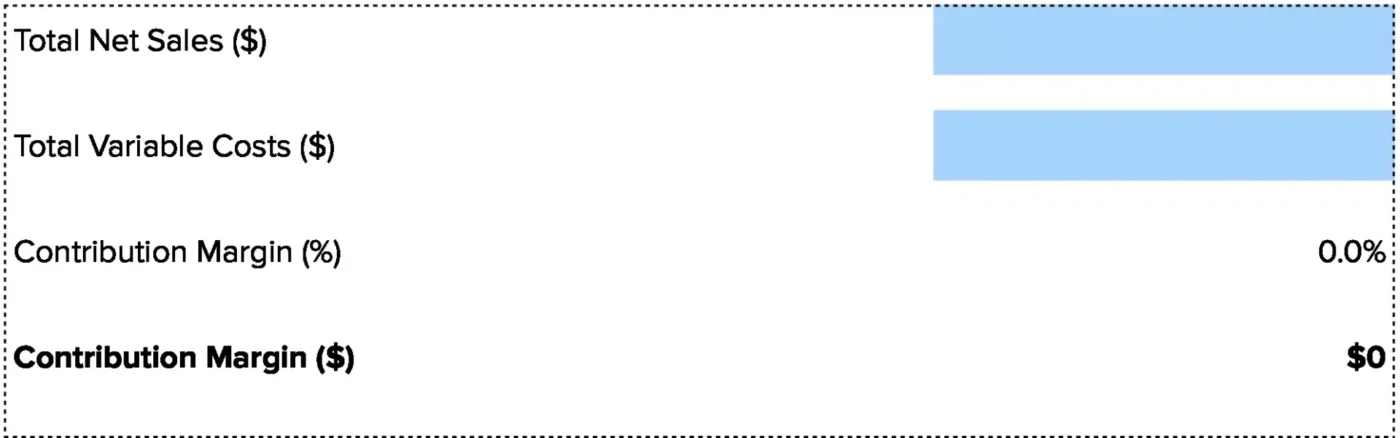
The Contribution Margin Calculator by Coefficient offers a quick online calculator and a downloadable Google Sheets template for calculating contribution margin. It helps you understand how much each unit sold contributes to covering your fixed costs and generating profit.
🚀 Ideal for: Teams already working in Google Workspace who need a quick way to calculate contribution margin
📮ClickUp Insight: 74% of employees use two or more tools just to find the information they need—while jumping between emails, chat, notes, project management tools, and documentation. This constant context-switching wastes time and slows down productivity. As the everything app for work, ClickUp unifies all your work—email, chat, docs, tasks, and notes—into a single, searchable workspace, so everything is exactly where you need it.
You see high revenue numbers and assume the business is healthy, but you have a nagging feeling you don’t know how to measure project profitability accurately—a problem shared by most businesses, as only 38% of companies use cost-to-profitability analytics.
Margin analysis templates provide the ground truth, moving you from guessing to knowing. They give you the clarity needed to make smart, data-driven decisions that protect your bottom line.
When you stop treating margin analysis as a separate, isolated task and integrate it into your daily work, you eliminate the context sprawl—the fragmentation that forces teams to waste hours searching for information across disconnected apps—that plagues so many businesses.
💟 Bonus: Use the Super Agent Builder in ClickUp to build yourself a Financial Reporting Analyst Super Agent that turns your ClickUp work data into consistent, decision-ready reports without you manually compiling updates.
Super Agents are ClickUp’s AI-powered teammates designed to save time, boost productivity, and adapt to your Workspace with intelligence and human-like interactions. These self-learning ambient Agents have the complete context of your Workspace, allowing them to efficiently and securely perform multi-step workflows around the clock.
Here’s how a Financial Reporting Analyst Super Agent can help:
Learn how to build your first Super Agent today
Even after you’ve found a template, the fear of entering data incorrectly and getting misleading results can be paralyzing, leaving the template to gather digital dust. Following a clear decision-making process makes it manageable and ensures your analysis is accurate.
Before you begin, make sure you have your data ready:
Here’s how to get started:
If your margins look off in a ClickUp template, check the Custom Fields—a common error is entering costs in the wrong category. In spreadsheet templates, verify your cell references are pulling from the correct columns.
💡 Pro Tip: Need quick answers about specific project costs, or a report you know exists but can’t find? Just ask ClickUp Brain MAX. The desktop AI assistant uses advanced AI to search across your ClickUp Workspace and all your connected apps and summarize information, so nothing gets missed.
You can also just speak your instructions, and Talk to Text will turn them into notes or comments.

Margin analysis templates eliminate the burden of manual calculations and standardize how your team measures profitability. By choosing the right template for your goal—whether it’s assessing viability, optimizing costs, or setting prices—you can move from reactive problem-solving to proactive decision-making.
Teams that track margins consistently catch erosion early and make faster, more confident choices that drive profitable growth.
ClickUp helps you centralize your margin analysis and connect profitability tracking to your entire workflow. Get started for free with ClickUp and transform how your team tracks and optimizes profitability.
Gross margin shows your profitability after direct production costs by subtracting the cost of goods sold (COGS) from revenue. Contribution margin reveals how much each unit sold helps cover fixed costs by subtracting all variable costs from revenue.
Most profit calculator Excel templates have this built in, but the formula is (Revenue – Costs) / Revenue. Just enter your revenue and total costs into the designated cells to get your profit margin.
Spreadsheets are fine for one-time calculations, but a project management tool is better for ongoing, collaborative margin tracking—especially since 30% of organizations still rely primarily on spreadsheets for performance modeling. It connects financial data to your operational workflows and can automate alerts when margins change.
Yes, most templates can be duplicated or expanded to track multiple products or business units. In a platform like ClickUp, you can create separate Views filtered by product line that all roll up to a single, aggregate ClickUp Dashboard.

© 2026 ClickUp

There’s an easier way. Try a free AI Agent in ClickUp that actually does the work for you—set up in minutes, save hours every week.