


Still downloading templates?
There’s an easier way. Try a free AI Agent in ClickUp that actually does the work for you—set up in minutes, save hours every week.
Sorry, there were no results found for “”
Sorry, there were no results found for “”
Sorry, there were no results found for “”

When your team plans work across phases, dependencies, and deadlines, Gantt charts go beyond just visualizing work. They are the reason you choose one project management tool over another.
Between ClickUp and Jira, both of which promise Gantt (or at least Gantt-type) functionality, which one fits the way you work?
If you’re considering Jira vs. ClickUp as your project management tool, we’re here to help.
Do you opt for the tool that offers native drag-and-drop timelines, or the one that features Gantt capabilities behind plugins and paid upgrades?
Let’s do a Jira Gantt Chart vs. ClickUp Gantt Chart feature breakdown, so you can make an informed choice.
In 1903, Karol Adamiecki, a Polish engineer, developed a visual project scheduling tool that he called a harmonogram. Although it closely resembled the modern Gantt chart, it wasn’t widely known outside Eastern Europe due to language barriers and limited distribution.
In 1910, Henry L. Gantt, an American mechanical engineer and management consultant, independently created a similar chart to improve efficiency in manufacturing and military projects. His version gained more traction in the U.S. and Western countries, so the format became known as the Gantt chart.
Even today, Gantt charts are an indispensable part of modern project management tools.
With Kanban, Timeline, Scrum, and a dozen other views now available, why does Gantt still hold its ground? And when should you use it?
🧠 Fun Fact: The early use case of Gantt charts was during World War 1. The U.S. military used Gantt charts for the production scheduling of ships and weaponry.
At this time, Gantt charts were known for two features: time across the x-axis and tasks or activities on the y-axis, with horizontal bars showing duration.
Our editorial team follows a transparent, research-backed, and vendor-neutral process, so you can trust that our recommendations are based on real product value.
Here’s a detailed rundown of how we review software at ClickUp.
Between ClickUp vs. Jira, both let you organize and manage projects in a visual way through Gantt Charts and Timelines. They offer core project management features with which you can create custom workflows, track progress, build dependencies, and manage milestones efficiently.
That said, here are the fundamental differences between how these tools offer the Gantt feature to diverse businesses with diverse teams.
Let’s break it down with this overview table:
| Aspect | ClickUp Gantt Chart | Jira Gantt Chart (via Timeline/Advanced Roadmaps) |
| Critical Path Analysis | Automatically calculates and highlights the sequence of tasks that determines the project’s shortest duration | Available through advanced issue linking in Advanced Roadmaps (paid plans), but lacks automatic, true Critical Path calculation. Manual workarounds or a third-party app are needed |
| Slack Time | Automatically calculates and displays the amount of time a task can be delayed without affecting the project completion date | This calculation is generally absent in Jira’s native features |
| Baseline Comparison | Allows you to save a snapshot of the original timeline to compare planned vs. actual progress | Requires manual creation using custom fields or a Marketplace app |
| AI Assistance | Deeply embedded AI for task creation, summaries, and suggestions | Generally available on paid plans. Focuses on summaries, content generation, and smart search across the Atlassian suite (not specifically built into the Gantt-type view) |
| Free Plan Access | Available on the Free Forever plan | Basic Timeline (single project view) is available. Advanced Roadmaps (true multi-project roadmapping) is limited to paid plans |
| Task Dependencies | Simply draw and link tasks visually to create dependencies. Auto-rescheduling is a key feature | Advanced visual dependency creation and management is a core function of Advanced Roadmaps (paid plans). Basic plans rely on issue linking |
| Ideal Use Case | Task and project timeline planning for cross-functional teams who need full visual PM features immediately | Roadmapping and capacity planning for technical teams in agile environments, highly integrated with issue tracking and development workflows |
ClickUp is an everything app for work that consolidates project management, task tracking, team collaboration, and analytics into one unified platform.
Beyond being project management tool that you can scale as you grow, ClickUp offers a converged AI workspace that brings all your workflows together.
It supports various project management methodologies, including Agile workflows, traditional project management, waterfall approaches, and hybrid methodologies. This makes it suitable for any and every project style, and helps you steer away from work sprawl, aka managing several disconnected workflows across scattered tools.
An outstanding feature is that it offers 15+ customizable views (one of which is Gantt Chart View). You can use it to visualize projects in a way that works best for your team.
If you’re looking to add Views to your projects in ClickUp, check out this video.
Let’s now break down the specific features of ClickUp’s Gantt Chart View that give you both a high-level overview and detailed control over your projects.
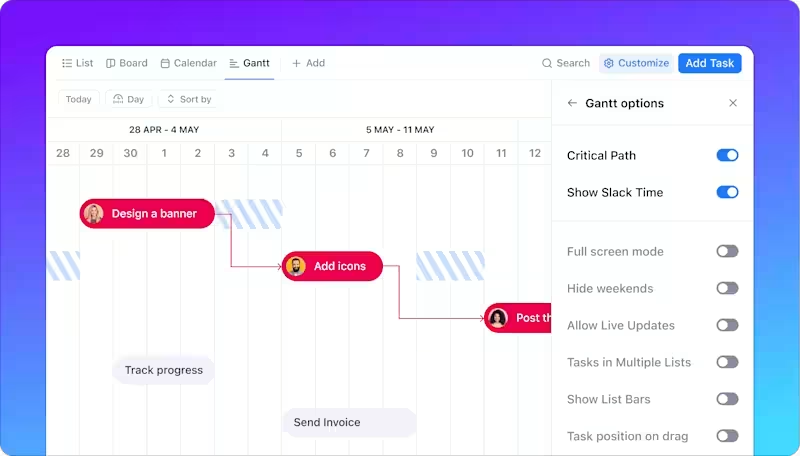
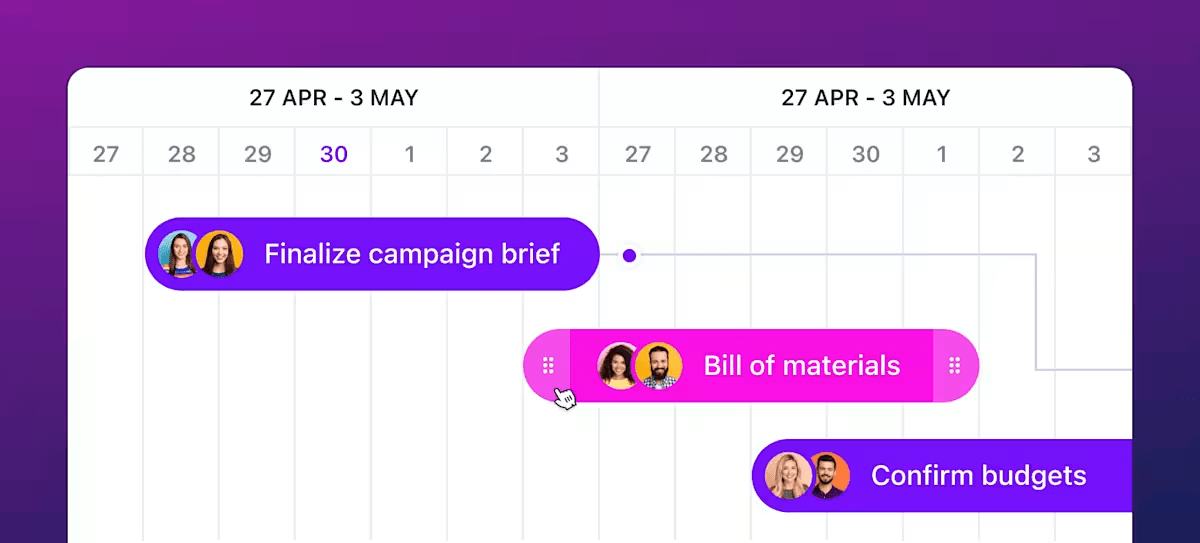
ClickUp allows you to create dependencies between any tasks by simply clicking and drawing a line between them. These dependencies create a clear visual representation of how tasks connect throughout your project timeline.
The platform primarily uses “blocks” and “is blocked by” relationships, ensuring that tasks can’t start until the tasks they depend on are completed.
If you’re looking for Gantt chart examples, think sprint planning, launch timelines, or content pipelines—each task clearly connected to what comes before or after.
Here’s everything you can achieve with dependencies in ClickUp’s Gantt chart view:
👀 Did You Know? Although using a critical path diagram helps you visualize dependencies and corresponding timelines, it is a time-consuming and error-prone task. That’s why most project managers use Gantt chart software to identify the critical path of a task automatically.
📮 ClickUp Insight: 31% of managers prefer visual boards, while others rely on Gantt charts, dashboards, or resource views.
But most tools force you to pick one. If the view doesn’t match the way you think, it just becomes another layer of friction.
With ClickUp, you don’t have to choose. Switch between AI-powered Gantt charts, Kanban Boards, Dashboards, or Workload View in a single click. And with ClickUp AI, you can auto-generate tailored views or summaries based on who’s looking—whether it’s you, an exec, or your designer.
💫 Real Results: CEMEX sped up product launches by 15% and cut communication delays from 24 hours to seconds using ClickUp.
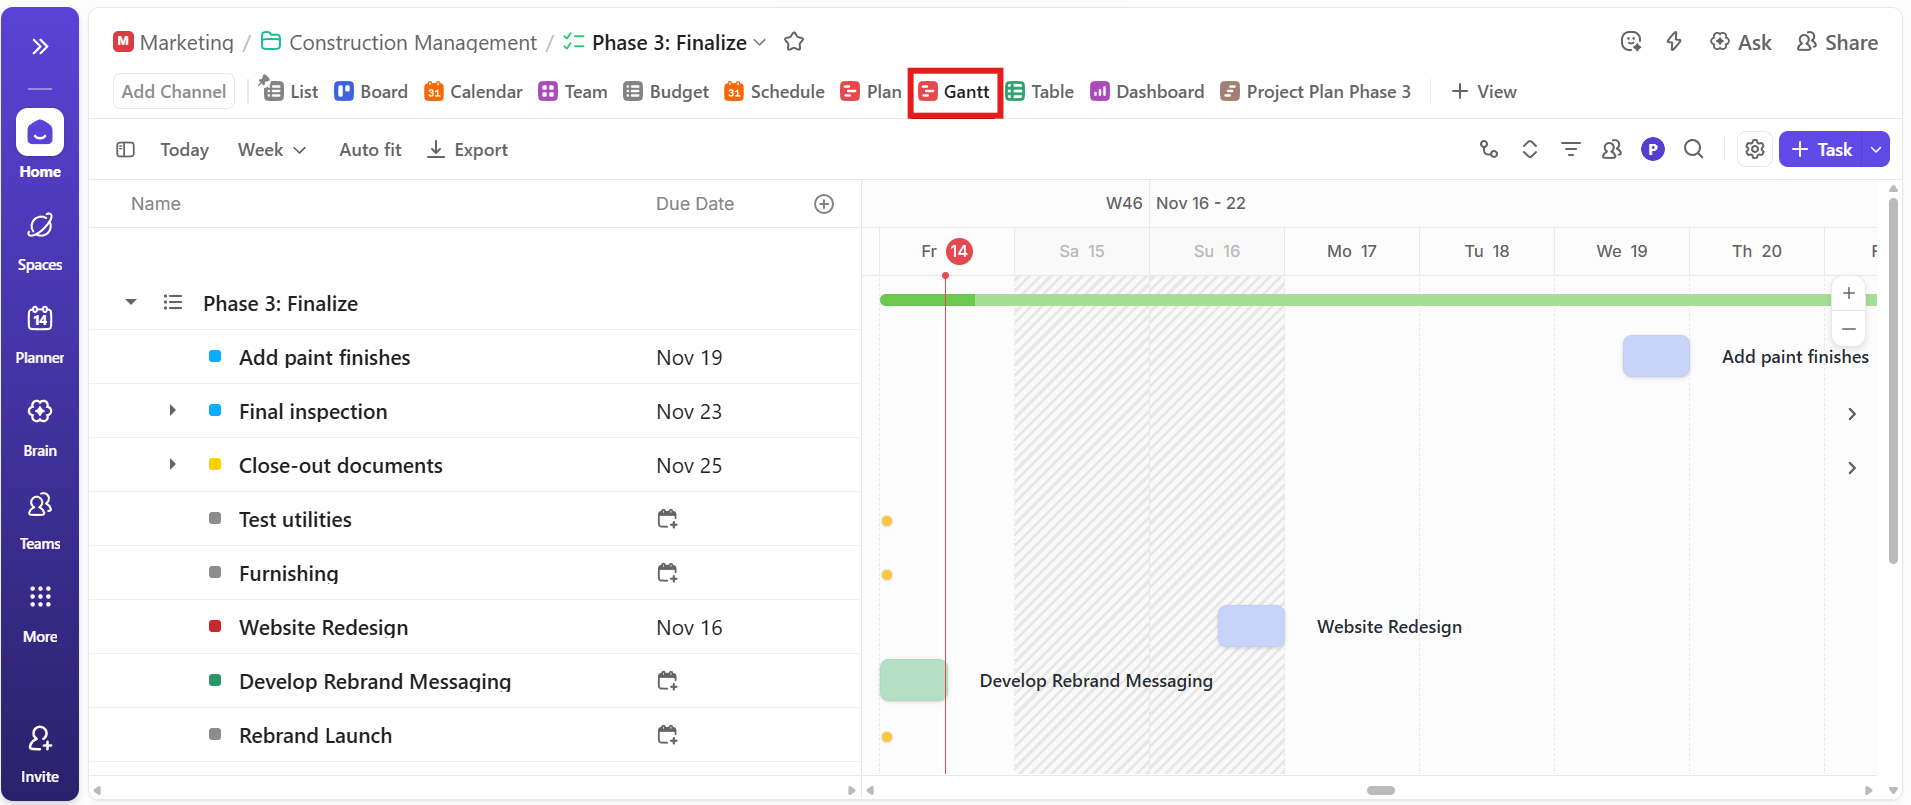
ClickUp’s Gantt View lets you manage task timelines directly on the chart. You can drag task bars to reschedule start or end dates without having to click multiple places. You can also zoom in and out to view your schedule by day, week, month, or quarter, depending on how detailed your planning needs to be.
Each task bar also displays visual progress bars and percentage completion directly on the Gantt chart. These progress indicators update in real-time as team members mark tasks complete or update their status.
For optimized resource allocation, you can turn on Slack Time Calculations to see who has the required bandwidth. Slack time calculation shows the amount of time a task can be delayed without affecting the project’s critical path. For instance, if a design review has 3 days of slack, you know it can be pushed (by up to 3 days) without delaying development.
As a project manager, this feature allows you to prioritize tasks requiring immediate attention and reassign work without overloading team members.
💡 Pro Tip: If your tasks follow repeatable patterns, like approvals, handoffs, or cross-functional steps, using task management templates can save serious time. They give you a pre-built structure for recurring workflows, so you don’t have to manually recreate the same task breakdown every time.
See how ClickUp handles it for an Agile workflow:
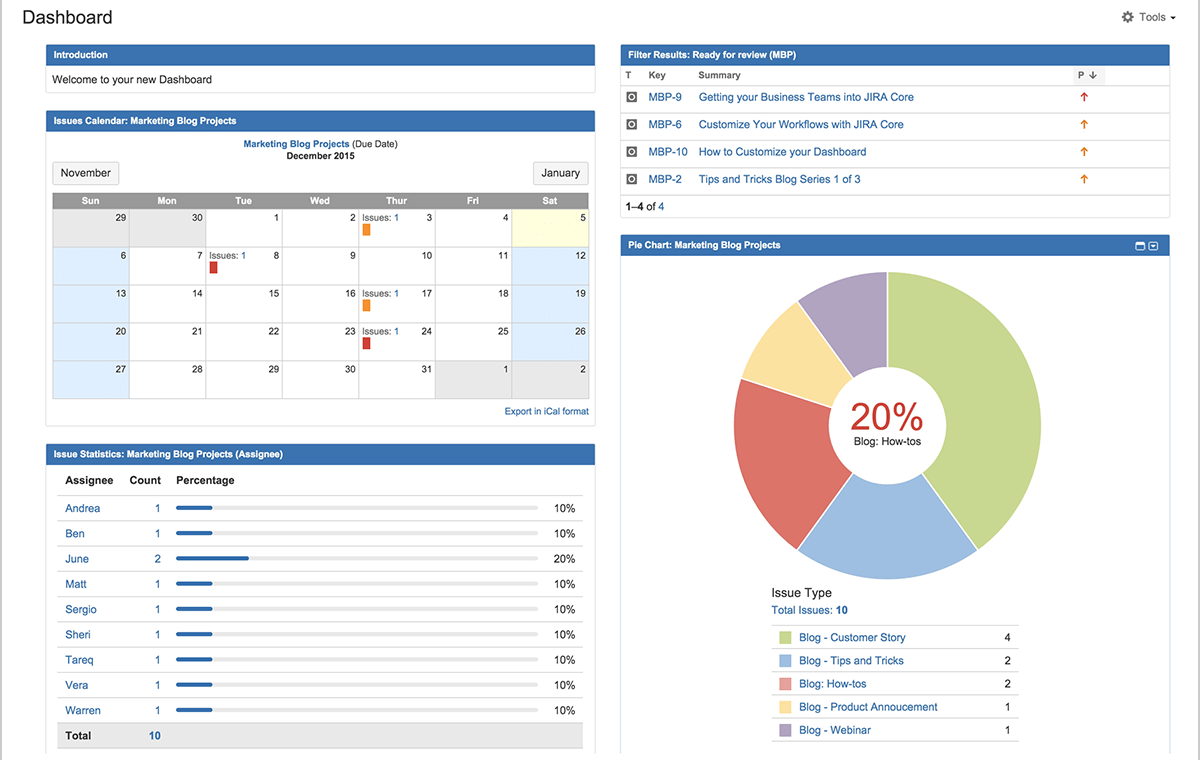
ClickUp lets you embed Gantt charts directly into customizable dashboards, making it easier to communicate project status and justify resource allocation decisions to management. You can pair Gantt charts with other widgets like task progress, time tracking, or sprint velocity to get a full picture of what’s happening across the project.
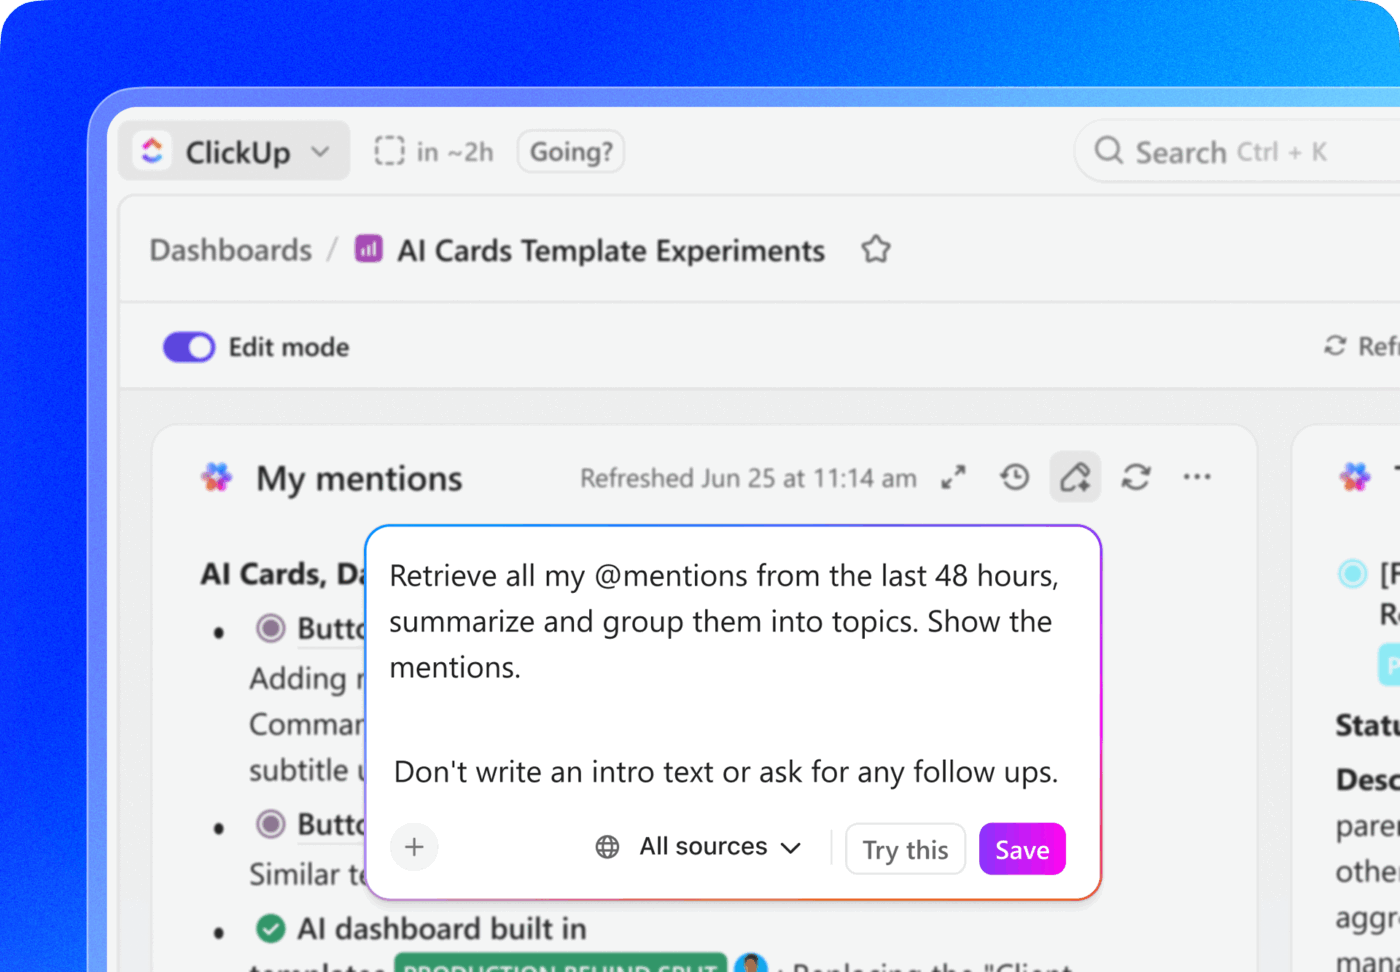
Its advanced reporting capabilities let you filter Gantt data by assignees, due dates, priority levels, or project phases. Going a step further, you can automate and schedule reports over the intuitive interface for regular distribution to team members and stakeholders.
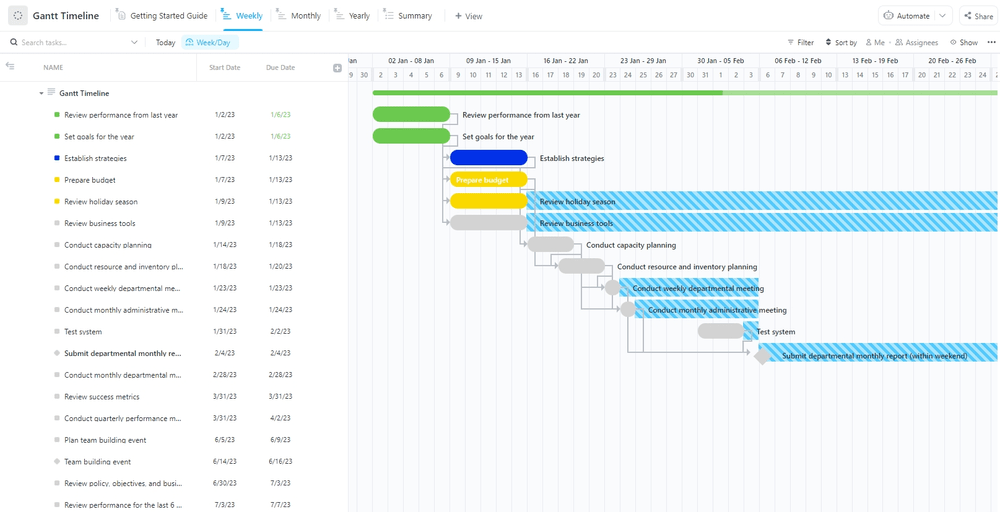
ClickUp Gantt Timeline Template eliminates the setup time typically required for creating Gantt charts from scratch. The template provides a ready-to-use framework that teams can customize for their specific project needs while maintaining proven structural elements for comprehensive project coverage.
With ClickUp’s Gantt Timeline Template, you can:
ClickUp’s Gantt View helps spot overloads or gaps by showing task timelines alongside assignees. If two high-priority tasks overlap for the same person, you’ll see it instantly and can shift or reassign work to avoid conflicts.
For deeper resource planning, you can switch to the ClickUp Workload View. It factors in time estimates and each person’s capacity, letting you plan assignments based on what your team can handle.
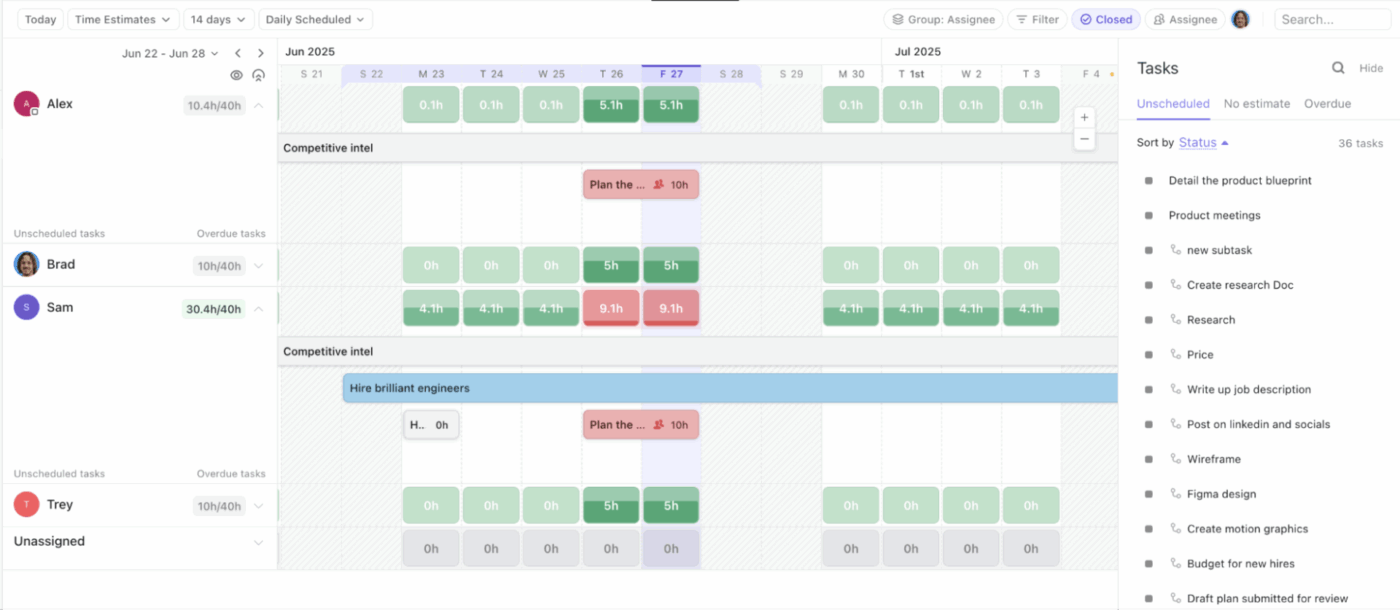
Used together, Gantt and Workload Views help maintain balanced schedules and prevent overbooking.
💡 Pro Tip: Consider using project schedule templates if you’re managing multi-phase work with tight timelines. They help you map out key tasks, dependencies, and milestones upfront—so you won’t have to rebuild the structure from scratch every time a new project begins.
ClickUp’s Gantt charts adapt to different team sizes and project complexities, making them versatile for various SaaS environments.
ClickUp stands out for its extensive customization options, from tailored statuses and fields to fully adaptable workflows that match how your team operates.
Here’s how different teams stand to benefit from the ClickUp Gantt Chart:
| Team type | Primary use-case | Key benefit |
| Software development teams | Feature releases, sprint planning, product roadmaps | Manages dependencies between development phases and testing cycles |
| Marketing teams | Campaign coordination, content calendars, launch sequences | Synchronizes creative assets, approval workflows, and publication timelines |
| Product teams | Feature development cycles, user research phases, and go-to-market planning | Aligns cross-functional deliverables from research to launch |
| Professional services | Client project management, consulting engagements, and service delivery | Tracks project milestones and resource allocation across multiple clients |
| Operations teams | Process implementations, system migrations, and cross-departmental initiatives | Coordinate complex workflows involving multiple departments and stakeholders |
ClickUp Brain (ClickUp’s in-built AI assistant) brings intelligent automation and contextual insights directly into the Gantt View.
With it, you can create a Gantt chart just by describing your project. Give it a brief like “Launch our Q3 product update with user research, design iterations, development sprints, testing phases, and marketing rollout,” and it’ll build out the phases, tasks, timelines, and dependencies (without requiring hours of setup time).
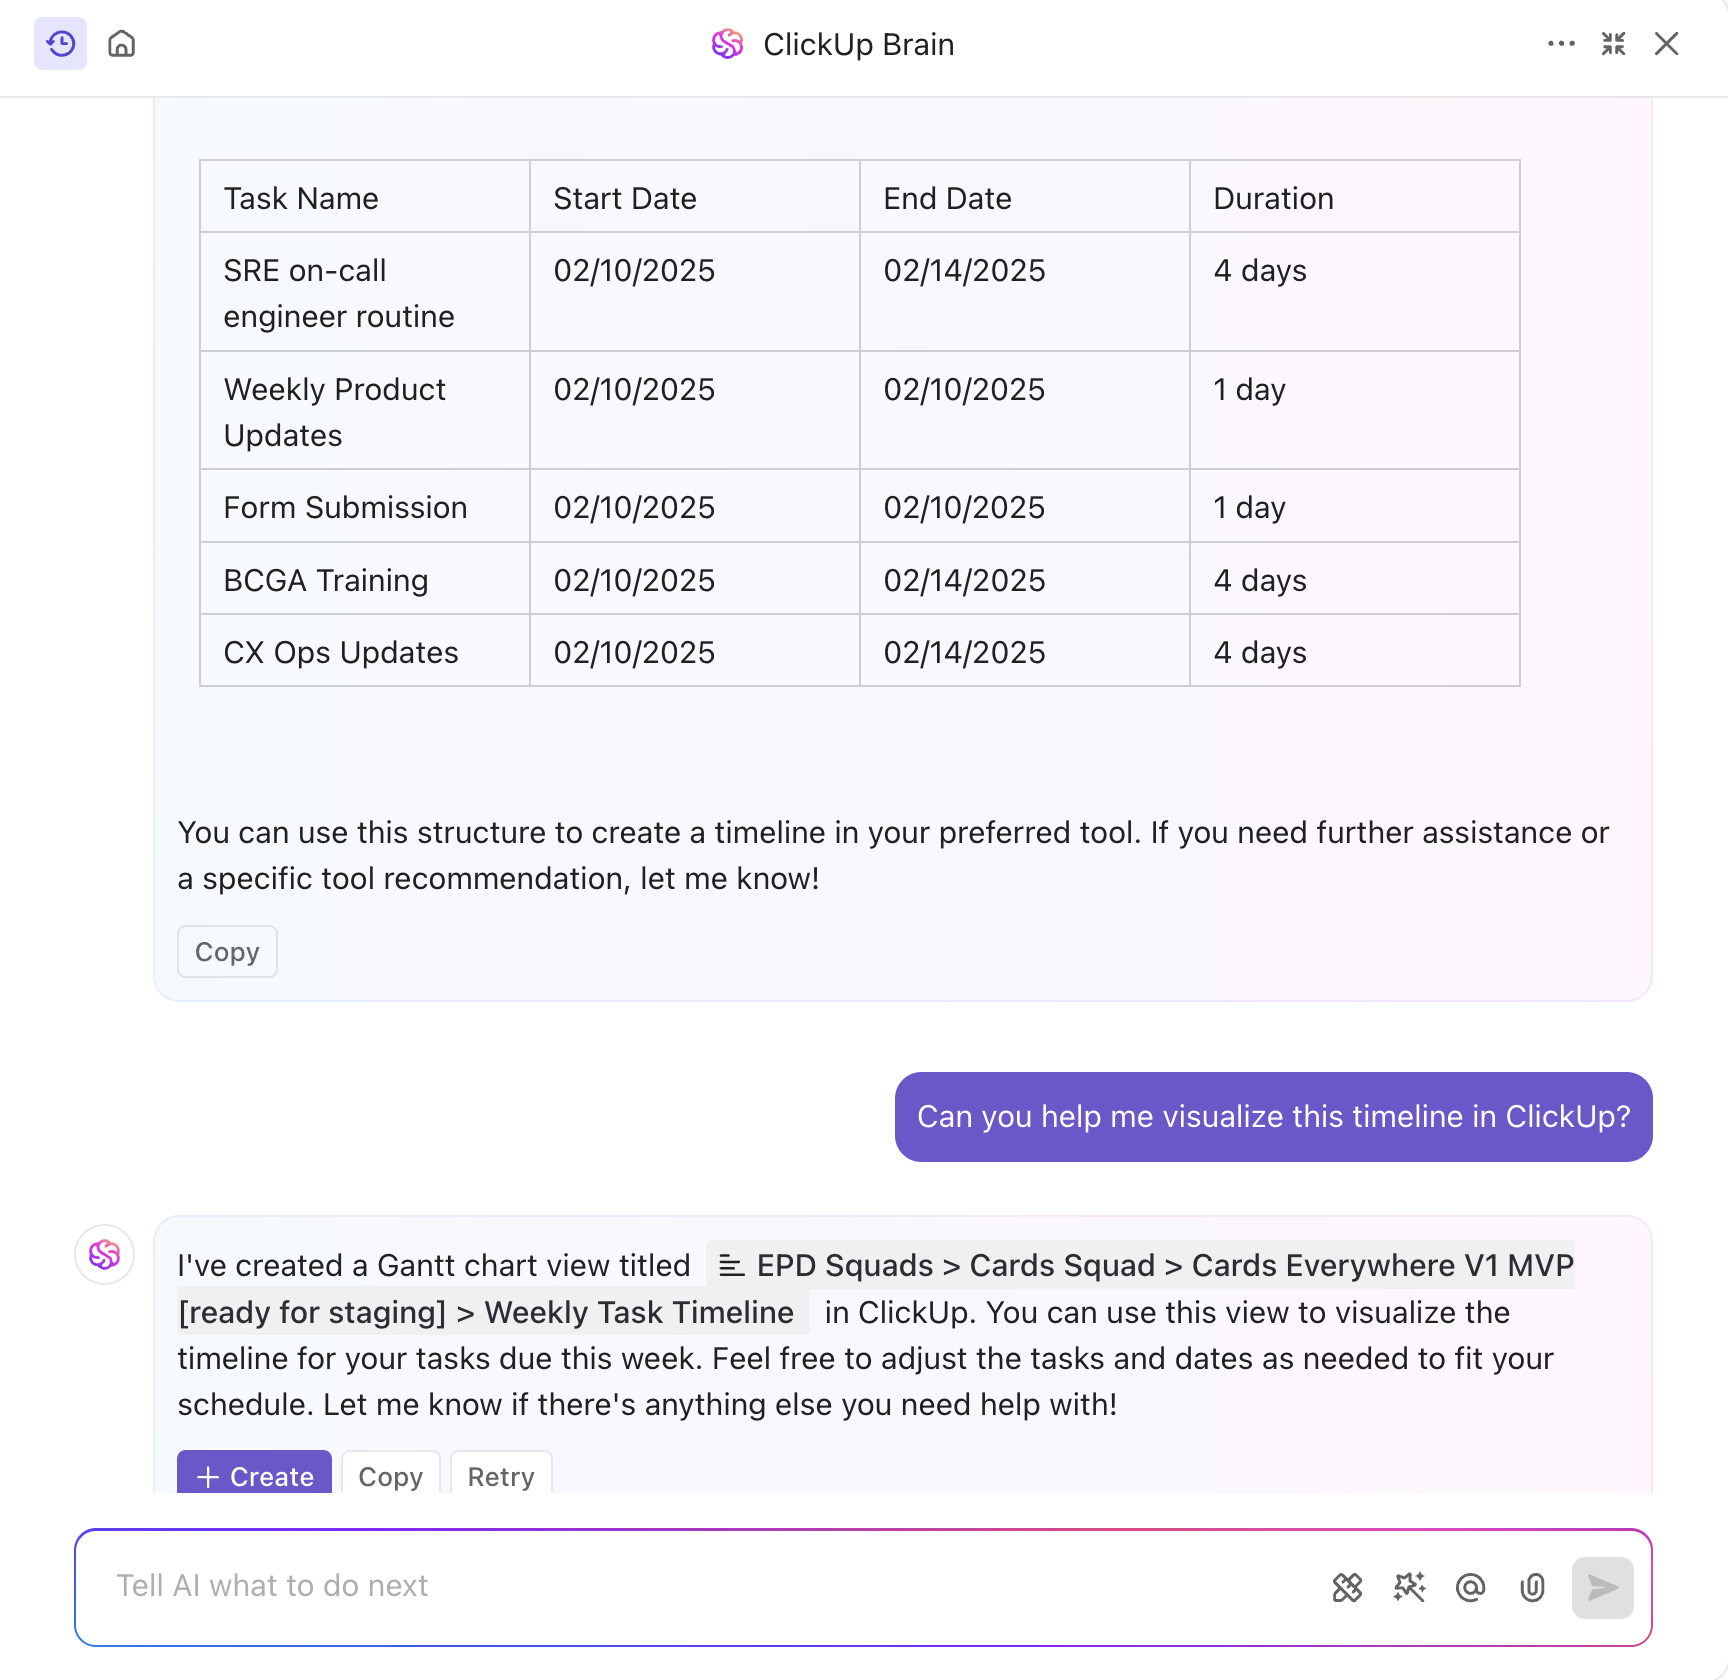
The Brain can further pull data from your Gantt timeline (think: task progress, comments, completion rates) to summarize tasks and answer questions such as:
And because Gantt tasks are tied to statuses and due dates, you can trigger workflow automation, such as alerts, assignments, or follow-ups, based on progress. When a critical path task falls behind, the AI can automatically notify team members and escalate issues to project managers.
This contextual automation transforms your Gantt chart into an intelligent project management system that will keep your timeline on track without constant manual intervention.
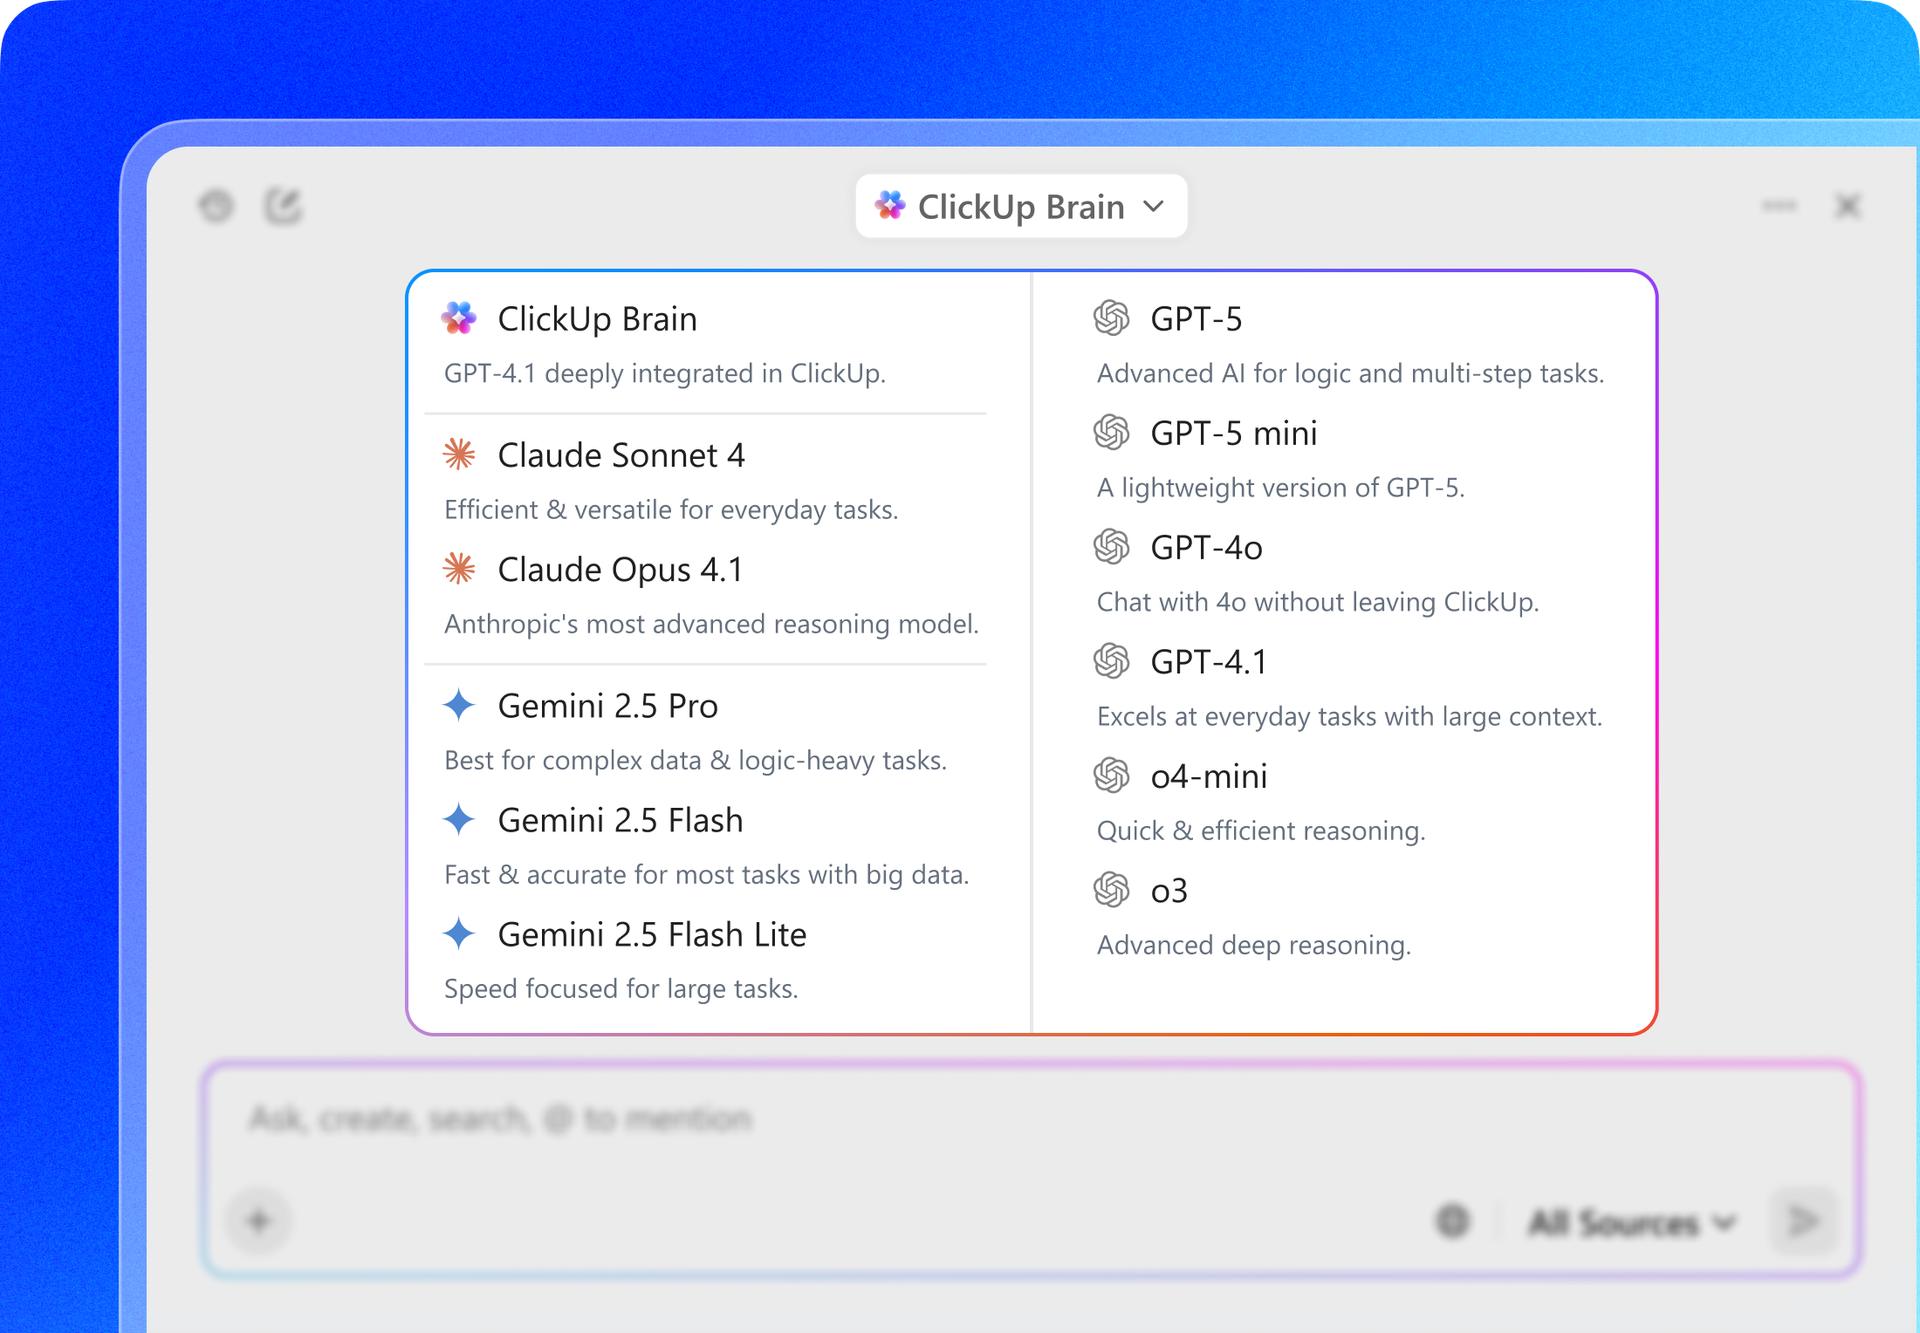
📍 Bonus: ClickUp Brain users can choose from multiple external AI models, including GPT-4o, Claude, and Gemini for various writing, reasoning, and coding tasks, right from within their ClickUp platform!
Here’s a G2 review:
While Jira and ClickUp both support agile workflows, ClickUp’s approach to Gantt charts makes it more accessible to a wider range of teams—not just developers. ClickUp offers an impressive range of features that make it easy to customize workflows, manage tasks, and track progress in one place. I love how I can create views tailored to each project, set automations, and integrate them with other tools I already use. It’s very versatile, whether for personal task tracking or complex business operations. The templates and dashboards are especially helpful for keeping everything organized and easy to follow.
Note: Gantt Charts are available for all paid plans
Jira is an issue-tracking and project management tool originally designed for software development teams. It’s built around agile methodologies, such as Scrum and Kanban boards, helping technical teams manage sprints, track bugs, and coordinate development workflows.
Jira is helpful for breaking down complex software projects into manageable tasks, stories, and epics. This agile project management tool is used by software developers, product managers, project managers, and QA testers, IT is also used by cross-functional teams managing complex projects with multiple moving parts.
Note: Jira doesn’t offer native Gantt Chart functionality like ClickUp. It offers a Gantt-type visualization through its Timeline and Plans feature. If Gantt chart functionality is non-negotiable for you, consider Jira alternatives.
Let’s now understand Jira’s key features that help track project progress, streamline workflows, and manage cross-functional projects.
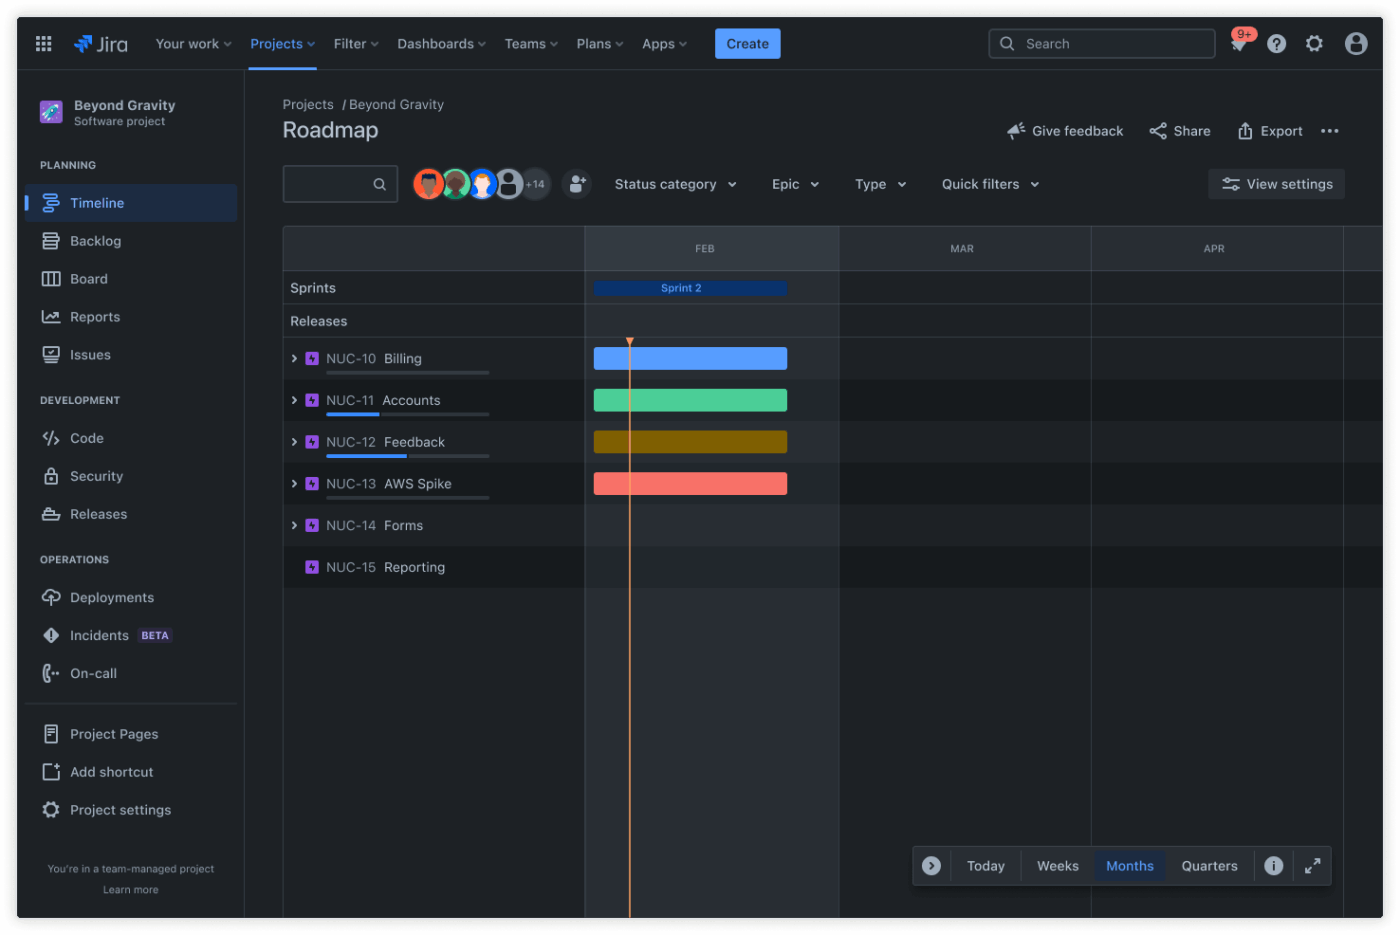
Jira’s Timeline view provides a basic roadmap visualization that displays epics, stories, and tasks on a horizontal timeline. It pulls data from your Jira (Scrum and Kanban) boards and shows issues chronologically using simple bars with basic status colors. You can apply filters to focus on specific work streams, releases, or assignees and get a quick sense of how work is spread across the timeline.
Software teams can use the Timeline view to see how epics break down into stories and where sprint boundaries fall.
However, the view is limited. It cannot visualize individual tasks, subtasks, or the detailed work breakdown that most project planning requires. Jira also lacks fine-grained insights into sprint progress unless paired with reports or third-party tools.
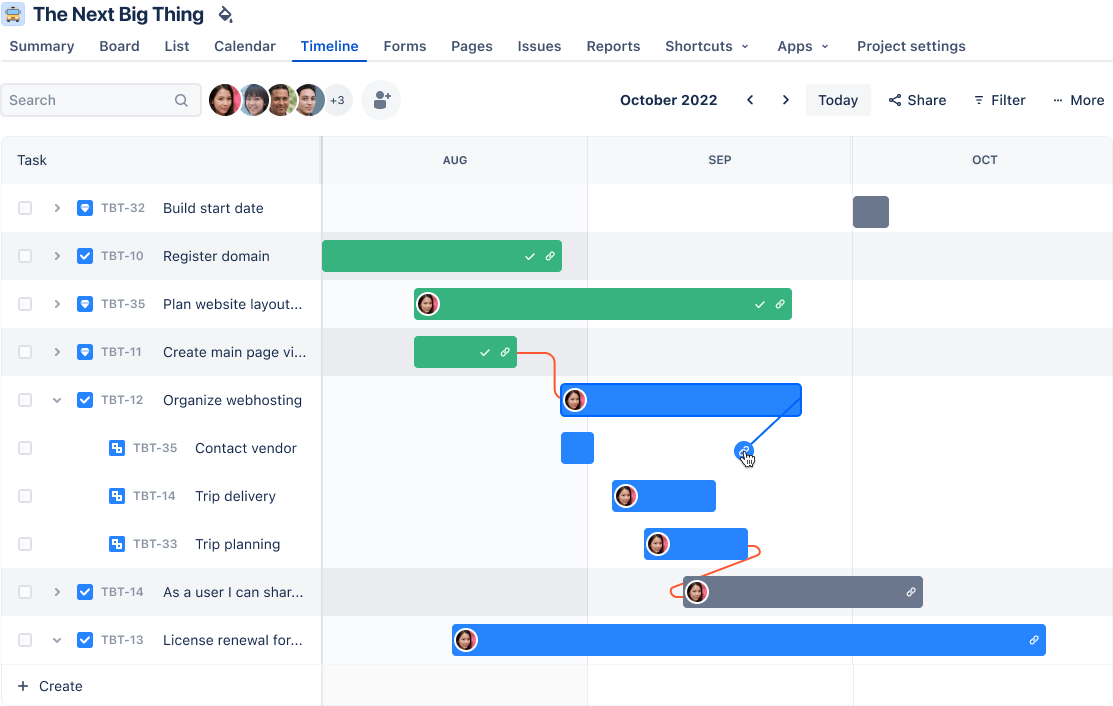
Plans (formerly Advanced Roadmaps) is a premium Jira feature providing an advanced timeline visualization across multiple projects and teams. This feature supports cross-project dependencies, multi-level hierarchy with subtask visibility, software development capacity planning, and milestone tracking. All the advanced features that you don’t get in the basic timeline feature.
This feature supports resource calculation and forecasting, enabling software teams to understand workload distribution across various projects and individuals. However, the feature still lacks critical Gantt chart functionality. For instance, Baseline Comparison (the ability to save a snapshot of the original plan to measure deviation) is not a native feature in Jira, forcing users to rely on manually created custom fields or a third-party app.
Since Jira doesn’t offer a native Gantt chart feature, both small teams and enterprises rely on third-party integrations from the Atlassian Marketplace to access full Gantt functionality. These tools unlock critical path analysis, baseline comparison, milestone tracking, and advanced dependency management, features that are not available in Jira’s default setup.
Jira integrates well with popular development tools like Bitbucket, GitHub, and Jenkins, making it suitable for engineering teams already embedded in the Atlassian ecosystem.
Some of the popular Jira integrations include BigGantt, WBS Gantt-Chart for Jira, Structure.Gantt, and Advanced Gantt for Jira. While powerful, these plugins add complexity to an already steep learning curve (of Jira), especially for non-technical teams. The extra cost and setup effort also make them a less appealing choice for teams looking for a simplified project management tool.
Jira’s Gantt chart functionality works best for technical teams with specific project management needs, though it requires additional plugins for full Gantt capabilities.
Here’s how technical teams stand to benefit from Jira:
| Team type | Primary use case | Key benefit |
| Software development teams | Agile sprint planning, bug tracking workflows | Integrates with existing development workflows and issue tracking |
| Devops teams | System implementations, technical migrations | Links infrastructure tasks with development cycles |
| Technical product team | Feature development, release planning | Connects user stories and epics to the timeline visualization |
Atlassian (Jira’s parent company) has integrated Atlassian Intelligence—its underlying AI platform—across its products. The new, unified AI experience, branded as Rovo, brings together features like search, chat, and customizable agents. It can summarize tasks, answer project-related questions, and use natural language to create automation rules and suggest work breakdown.
Crucially, Rovo’s primary function is still centered on issue management and knowledge retrieval, not visual project planning. Its direct functionality inside Jira’s Timeline or Plans view is generally limited to tasks that populate those views.
This means that just like you rely on plugins for traditional Gantt chart functionality (Critical Path, Baselines), you still need third-party apps like Visor to get full functionality of AI that can truly manipulate and enhance the Gantt chart view itself.
🧠 Did You Know? Despite the rise of Gantt chart alternatives like kanban boards, timelines, and calendar views, this visual method remains a go-to for nearly 45% project managers handling complex, multi-phase work.
Here’s a G2 review:
What I like most is how customizable and structured Jira is for managing projects and tickets. It supports detailed task tracking, allows us to create custom workflows, and gives visibility into progress with Kanban or Scrum boards. The integration with tools like Confluence, Slack, and GitHub makes it even more powerful. It’s easy to collaborate, assign tasks, set due dates, and maintain accountability across departments.Jira allows you to build customizable workflows through its schema editor, though the learning curve is higher for non-technical teams. However, Jira can be a bit complex to learn at first, especially when configuring new workflows or understanding permission schemes. Sometimes, the UI feels crowded, and performance can be slower with large-scale projects.
Note: The Plans (advanced roadmap) feature is available only on premium plans and above.
To conclude the debate, we took it to Reddit. While no specific threads are discussing ClickUp’s Gantt view with Jira, here are some user opinions on both tools.
Users have experienced a considerable learning curve with both Jira and ClickUp. Although, according to a user, if you get past ClickUp’s learning curve, creating custom workflows and overall task management gets pretty easy.
It’s definitely a robust tool, but I’ll admit the learning curve is real. It took me a while to set it up the way I wanted, but once I did, it really made managing projects and collaborating with my team easier.
Although Jira’s Advanced Roadmaps offer extensive functionality, their lack of native features is both costly and time-consuming for users. According to a user:
A lot of reliance on addons and plugins to fix things that Jira should have out of the box. For example, my project’s CFD is kinda unusable because the “Done” cumulative doesn’t take into account the time frame selected. I also don’t like that you can’t color cards based on their WIP age out of the box.
On the other hand, ClickUp’s Gantt limit of 60 Uses (in a free plan) is a bit of a problem for some. According to a user:
We are currently on the free plan, as it has everything we need, however we have reached the “60 uses” for the Gantt Chart; this is a vital part of our development process, and we cannot justify each of us spending $10 a month to unlock every feature, when we simply just want the Gantt Chart feature.
The verdict is in: ClickUp takes the crown.
Jira and ClickUp each serve different audiences. Jira leans heavily into software teams, while ClickUp brings broader Gantt functionality to everyone from marketing to engineering.
While Jira excels in project management through agile methodologies, it is widely adopted by technical and software development teams. The lack of advanced Gantt (or Gantt type) features means you will have to rely on third-party plugins. For this, you will need to consider the time and cost involved in setup, and integration.
ClickUp, however, is a comprehensive work management tool built for teams that want full Gantt functionality without extra plugins or setup.
From building timelines to mapping dependencies, tracking milestones, and adjusting schedules, you can manage agile workflows with extreme customization within ClickUp’s Gantt View.
To start using ClickUp, sign up for free.

© 2026 ClickUp

There’s an easier way. Try a free AI Agent in ClickUp that actually does the work for you—set up in minutes, save hours every week.