


Still downloading templates?
There’s an easier way. Try a free AI Agent in ClickUp that actually does the work for you—set up in minutes, save hours every week.
Sorry, there were no results found for “”
Sorry, there were no results found for “”
Sorry, there were no results found for “”
You have the perfect project plan—everything mapped out to hit your milestones and achieve your goals. But after completing the project, you realize some tasks are still incomplete, and you didn’t deliver the results you were hoping for.
Sometimes, outdated processes or inefficient systems slow you down. Other times, it might be a lack of training or clarity among your team that results in project failure. Whatever the cause, finding and fixing the root problem is the first step to making sure it doesn’t happen again.
A fishbone diagram can be a great way to map out the problem and uncover potential causes. It helps you untangle the main issue, spot patterns, and figure out what’s going wrong.
In this guide, we discuss fishbone diagrams in detail and a step-by-step process to create one. Let’s go!
A fishbone diagram is a visualization tool, like any flowchart template, that helps teams uncover the underlying issues in any business problem.
Also called Ishikawa diagrams, herringbone diagrams, or cause-and-effect diagrams, this diagram’s primary purpose is to visually map out the causes and sub-causes leading to a particular problem or issue.
Fishbone diagrams have been solving business problems since the 1920s. They became famous in 1968 when Kaoru Ishikawa, a Japanese engineering professor, refined and popularized the concept while working on quality management at the Kawasaki Shipyards.
Since then, this simple yet effective tool has become a go-to for more than just fixing issues. It’s now widely used to prevent recurring challenges, improve existing processes, and develop successful products.
🤔 Did you know? Mazda Motors, the iconic Japanese carmaker, designed the legendary Miata (MX5) sports car using fishbone diagrams. Their engineering team used it to brainstorm creative ideas, identify flaws in existing models, and design a car that would thrill enthusiasts everywhere.
The result? The Mazda MX-5 is a ride that’s fun to drive and easy on the wallet. Proof that a little structured problem-solving can lead to a whole lot of joy on the road.
Fishbone diagrams are super helpful in more ways than you can imagine. Trimming it to the basics, here are three simple fishbone diagram examples in real life:
In property management, fishbone diagrams uncover why equipment malfunctions. To better see the underlying problem, categories like People, Process, Assets, Environment, Materials, and Suppliers start revealing patterns that allow facility managers to plan their maintenance better.
Marketing teams usually make an Ishikawa diagram to brainstorm creative strategies or analyze campaigns. In fact, categories like Product, Promotion, People, Marketing Channels, and Processes help marketers spot weak points, understand customer preferences, and create campaigns that actually connect with their audience.
No one likes defective products! A cause-and-effect diagram helps quality teams dig into issues like Design, Material, Inspection, and Process. This reveals what’s affecting product quality so companies can perform root cause analysis, improve customer satisfaction, and protect their reputation.
Are you curious about how to make a fishbone diagram? Start by identifying the problem, brainstorming possible causes, and sorting them into categories. It’s a simple yet powerful tool that works across industries!
Here’s why using a fishbone diagram can be a real game-changer:
This is the most immediate benefit. Fishbone diagrams make spotting root causes easy. They’re perfect for digging into any problem and uncovering its hidden issues. What’s great is they break everything down so you can clearly see what’s going on!
Fishbone diagrams are all about teamwork. They bring everyone together to brainstorm, share ideas, and solve problems. This helps tackle the issue at hand, strengthens team bonds, and boosts motivation. Talk about a win-win!
These diagrams offer a simple way to organize the various causes of a problem. Their clean, straight-line structure (with branches) helps you see how different factors are connected.
The easy-to-understand visual format makes it all the more effortless to identify links, relationships, and potential solutions.
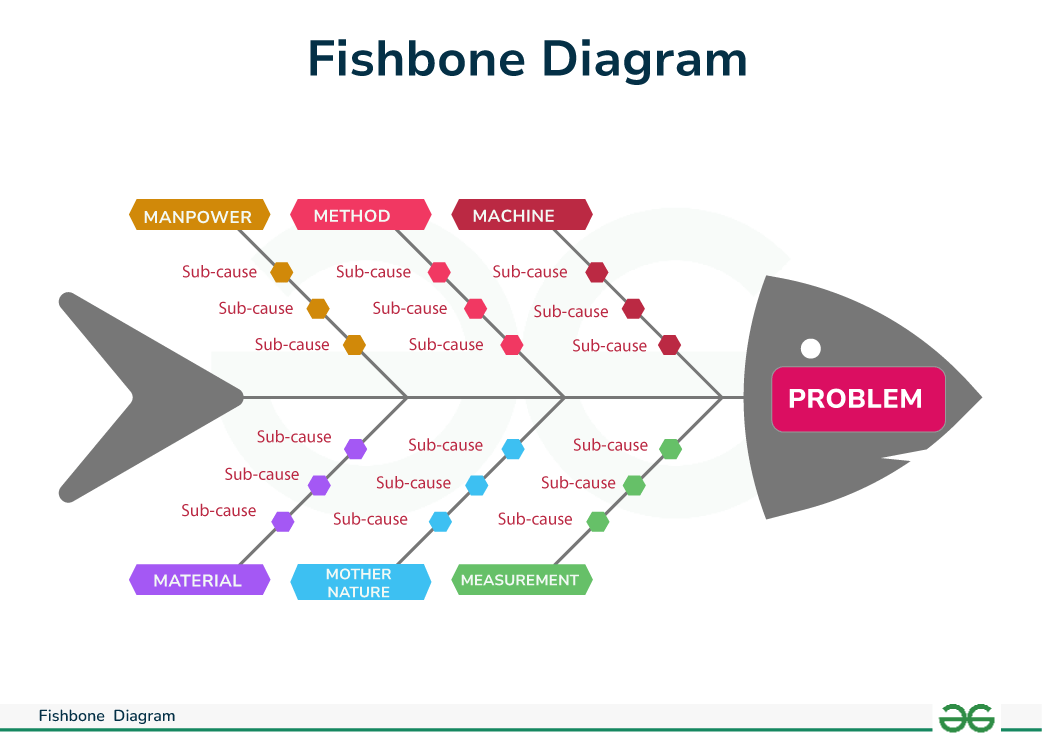
Living up to its name, fishbone diagrams resemble the shape of a fish or fish skeleton.
Let’s discuss how different parts denote the problems and causes:
That said, you will find all these elements in different forms of Fishbone diagrams. Let’s explore what that looks like.
Fishbone diagrams come in all shapes and sizes, depending on the type you pick. Let’s explore some popular ones you can use for your project:
The simple fishbone diagram is the most basic form and has no predefined affinities or categories of causes. So, you have the freedom to customize the categories and factors contributing to the problem according to your industry.
The 4S fishbone diagram organizes the causes into four common categories—Suppliers, Systems, Surroundings, and Skills. This type is widely used in the service industry.
The 8P fishbone diagram gets its name from its eight cause categories: Procedures, Policies, Place, Product, People, Processes, Price, and Production. While it’s a favorite in the service industry, you can tweak it to fit your own needs and industry.
Slightly breaking the pattern, this fishbone diagram categorizes causes into six types—Man, Materials, Methods, Machine, Measurements, and Environment. It’s a go-to for the manufacturing industry and sometimes even adds two extra categories—Management/Money and Maintenance—for more flexibility.
No matter which fishbone diagram you choose, they all follow one principle: cause and effect. The cause is the action, and the effect is the result. Simply, each category branch represents a contributing factor to the outcome or problem statement.
Friendly Reminder: When picking a fishbone diagram type, match it to your problem first, not your industry. The 4S works great for service issues, but if you’re analyzing a manufacturing problem in a service company, the 6M (Man, Machine, etc.) might serve you better. The categories are guides, not rules.
Here’s a step-by-step process on how to make a fishbone diagram:
First things first, figure out the main problem you’re trying to solve. Gather your team from different areas (sales, marketing, support, product) and discuss it. Make sure everyone agrees on a clear, specific problem statement.
For example, ‘Customer churn rate increased by 25% in Q3 of 2024.’ Write this problem at the ‘head’ of your fish (on the left side of your diagram). You can also note what you aim to achieve with this analysis to keep everyone aligned!
In the second step, work with your team to identify at least four broad categories that might be causing the problem. Think big—what could be influencing the issue?
Think of at least four factors which influence your problem. See if a shift in one of these causes can give you a different effect to explore.
This will set the directions for you to identify the sub-causes within each category in the consequent step.
Circling back to the previous example, here are some areas to be considered for solving the customer churn problem:
In this case, the customer service, onboarding process, product quality, or pricing structure can be to blame for the surge in the churn rate.
You can add or tweak these categories further depending on your problem. But just a gentle note: Try keeping it under 10 for a more straightforward diagram.
📌 Quick Hack: You can also use Dependency Mapping at this stage. For example, a confusing onboarding process may make the product hard to use, which then affects customer service. When you map these dependencies, you can spot where fixing one thing might solve several problems.
This is where you take your brainstorming session to the next level. For each category, list all possible causes contributing to the problem. Encourage your team to share every idea, no matter how small.
For instance, if ‘Process’ (from the last step) is a category, some sub-causes might be:
Keep asking ‘why?’ for each cause until you’ve got all the details. The more you explore, the better!
With your diagram complete, it’s time to focus on the patterns. Look for root causes that pop up repeatedly or categories with multiple sub-causes. These are your top priorities.
For example, if ‘Price’ shows up as a factor in several categories, it’s worth digging into. Work with your team to identify what needs attention first and start solving from there.
Create a clear, step-by-step plan to tackle the top causes you’ve identified.
Start taking action right away and stay flexible. If one category doesn’t lead to a solid solution, redirect your focus to other areas. The key is to keep moving forward, learning, and refining as you go—progress over perfection!
Although fishbone diagrams are super easy to create and analyze, here are some tips that you can note down to create an effective fishbone diagram:
Get everyone involved right from the start! Bring stakeholders into the discussion early, and keep collaborating throughout. To crown it all, encourage input on causes without judgment—this is about brainstorming, not debating.
All things considered, focus on simplicity. Add only relevant categories and causes that add value to the problem-solving process. Skip the fluff, and make sure the diagram is easy for everyone to understand.
Why struggle with pen and paper to create fishbone diagrams? There are endless digital tools in the market you can use to decide the best one out of the lot. Better yet, try Whiteboards to make a fishbone diagram, or go for a fishbone diagram maker to avoid the hassle altogether. Let’s see how.
Sure, you could try using fishbone diagram templates in Excel or Microsoft Word (they’re free, after all). But let’s face it—they can be time-consuming, tricky to customize, and prone to frustrating formatting issues. It’s not exactly ideal when you’re trying to focus on solving problems, right?
What you need is a fishbone diagram maker (or a template) that’s clean, flexible, and ready to handle any level of complexity. You want something that looks great, works across devices, and lets you and your team collaborate seamlessly.
That’s what ClickUp brings to the table. It’s a powerhouse project management tool, and all things work-related. With tools like automation, integrations, and even AI, it’s designed to streamline your workflow.
While not inherently a fishbone diagram maker, ClickUp can make root-cause analysis with its rich feature set. Ready to explore the ClickUp magic?
Take ClickUp Mind Maps, for example. They make it a breeze to map out your fishbone diagrams for root cause analysis.
Start by jotting down your problem statement, explore categories step by step, and even refer to mind map examples if you’re new to it. Plus, you can invite your team to jump in, collaborate, and crack the case together!

Once your diagram is done, use the Re-Layout feature to drag and drop and reorganize the causes. This lets you clean up messy brainstorms into a well-organized fishbone structure and determine which causes need your attention first.
Plus, Mind Maps gives you two modes for complete flexibility:
And if starting from scratch isn’t your vibe, why not use fishbone diagram templates?
To sweeten the deal, ClickUp’s Fishbone Diagram Template is here to help you get started fast.
Just sign up for free, add the template to your workspace, and boom—you’re ready to go! State the problem, brainstorm the causes, and customize the template to fit your needs.
Here are its key features 👇
Once you’ve identified the root causes, instantly convert those insights into ClickUp Tasks. Assign them to team members, set due dates, and track progress—all within ClickUp. It’s the easiest way to go from ‘problem-solving’ to ‘problem solved!’
Creating fishbone diagrams just got much easier and way more fun with ClickUp!
Let’s look at some of the many advantages of using ClickUp to make a fishbone diagram:
Here are a couple of tips to make your fishbone diagrams even better:
While fishbone diagrams are great for solving problems, it’s best to be aware of common mistakes that might arise. Let’s take a look:
If you’re not clear about the problem, it’s tough to define it in your fishbone diagram. A vague problem statement leads to unimaginable confusion down the road. This means you might not get the results you want!
✅ Solution: Use the SMART approach (Specific, Measurable, Achievable, Relevant, Time-bound) to nail down your problem statement. Make sure to involve key stakeholders early on to get valuable insights.
Bias and assumptions can seriously mess up your analysis. Whether personal opinions or a lack of data, jumping to conclusions can overlook crucial causes and derail the process.
✅ Solution: Take time to gather input from different experts, review data, and analyze various perspectives. When creating fishbone diagrams, consider all the potential causes and avoid rushing to conclusions without sufficient evidence.
When you’re dealing with complex problems, your fishbone diagram can quickly become overcrowded with causes and sub-causes, making it hard to visualize relationships or prioritize them.
✅ Solution: Use fishbone diagram templates to organize your causes into main categories and sub-categories. Prioritize the most relevant causes using factors like severity, frequency, and feasibility.
It’s easy to confuse ‘symptoms’ with root causes in your fishbone diagram analysis. Truth be told, addressing symptoms won’t solve the underlying business problems in the long run.
✅ Solution: Use the ‘5 Whys’ method and thoroughly examine the fundamental or core causes.
While quick fixes might seem like an easy solution, they often lead to the same problems popping up again (a serious productivity killer).
This is where you’d need fishbone diagrams to solve these issues for good.
And when it comes to creating the perfect fishbone diagram, ClickUp’s the name of the game! It’s a wholesome project management platform that streamlines collaboration and visualization at every stage of your work.
Give ClickUp a try for free and take your fishbone diagram game to the next level!

© 2026 ClickUp

There’s an easier way. Try a free AI Agent in ClickUp that actually does the work for you—set up in minutes, save hours every week.