Brainstorming sessions can be fun. Still, when a major problem occurs, they easily turn into intense and nerve-racking thinking marathons. 🏃
That’s where fishbone diagrams come in. Although simple, they are valuable tools for unraveling complex issues, identifying their causes, and coming up with viable solutions.
You don’t even have to make one yourself. You can use one of many pre-existing fishbone diagram templates and get started in minutes. We’ll share some of our favorites, so stay tuned!
- What Are Fishbone Diagram Templates?
- What Makes a Good Fishbone Diagram Template?
- 10 Ishikawa Fishbone Diagram Templates
- 1. ClickUp Ishikawa Fishbone Diagram Template
- 2. ClickUp Cause & Effect Template
- 3. ClickUp Root Cause Analysis Template
- 4. Microsoft Word Fishbone Diagram Template by TemplateLab
- 5. Cause & Effect Fishbone Diagram Template by Creately
- 6. Microsoft Word Fishbone Graphic Organizer Template by Template.net
- 7. Fishbone Whiteboard Diagram Template by Template.net
- 8. Excel Ishikawa Fishbone Diagram Template by QIMacros
- 9. Excel Simple Fishbone Diagram Template by Someka
- 10. Fishbone Diagram Template by Canva
What Are Fishbone Diagram Templates?
The fishbone diagram is a visualization method for helping you and your team pinpoint the causes of a problem or defect. It’s similar to a mind map but focuses specifically on root causes analysis. Fishbone diagram templates are ready-made documents that help you kick-start brainstorming sessions instead of staring at a whiteboard for hours. 🤔
It’s a framework you can use to begin analyzing the causes of a particular problem in your company, be it related to product quality, resource constraints, process inefficiencies, or customer dissatisfaction. Once completed, the diagram provides a solid baseline for creating a resolution process map and planning its execution.
What Makes a Good Fishbone Diagram Template?
An effective fishbone diagram maker or template should be:
- Clean and simple: Have a clear structure and labels, and be easy to understand for all
- Adaptable: Provide sufficient space for problems of varying complexity
- Accessible: Enable you to access and edit it on multiple devices
- Visually appealing: Include color and other visual elements to make it more interesting
10 Ishikawa Fishbone Diagram Templates
If you’re looking for an effective way to start your next cause analysis brainstorming session, check out our list of the 10 best templates for fishbone diagrams in ClickUp, Word, and Excel.
They help you analyze cause-and-effect relationships and recognize their intricacies. As a result, you can solve issues on the fly and keep your business running like a well-oiled machine! ⚙️
1. ClickUp Ishikawa Fishbone Diagram Template
Few templates are as vivid and dynamic as this ClickUp Fishbone Diagram Template. It’s one of the most fun approaches to cause analysis, simple but powerful, with various colors and shapes to represent different categories.
After running the template, refer to the Legend on the top left of the fish to see what each element stands for. You can refer to the Getting Started doc if you have questions about using the template.
ClickUp’s template follows the standard fishbone diagram structure, but you can modify it to fit any situation and context. This template is a whiteboard, so it’s fully customizable.
Click on the shapes to change their color and outline or double-click on the text to edit it. You can drag and drop objects and group them to make rearranging quicker.
The rest of the board is also at your disposal—you can draw, create flowcharts and mind maps, insert images and website cards, or go anywhere your imagination takes you! 🤩
2. ClickUp Cause & Effect Template
If you prefer trees to fish, perhaps this Cause & Effect Template by ClickUp will suit you better. Its purpose is the same as the previous fishbone diagram example—helping you identify the underlying factors contributing to a problem.
Instead of the fish-like format, it follows a simpler, tree-like structure. 🌳
The main problem is the root and the primary causes are its first-layer branches. They then fork into sub-branches, which represent the second layer, i.e., deeper causes or contributing factors.
The tree can branch out as far as you want. Like all ClickUp Whiteboards, you can customize every template element to perfection. By adding connectors between elements, you can ensure they stay in relation even when moving them around.
While the fishbone and cause & effect diagrams share many similarities, the latter is slightly more flexible. It’s more suitable for those who can’t or won’t fit their causes into distinct categories, such as Method or Materials.
3. ClickUp Root Cause Analysis Template
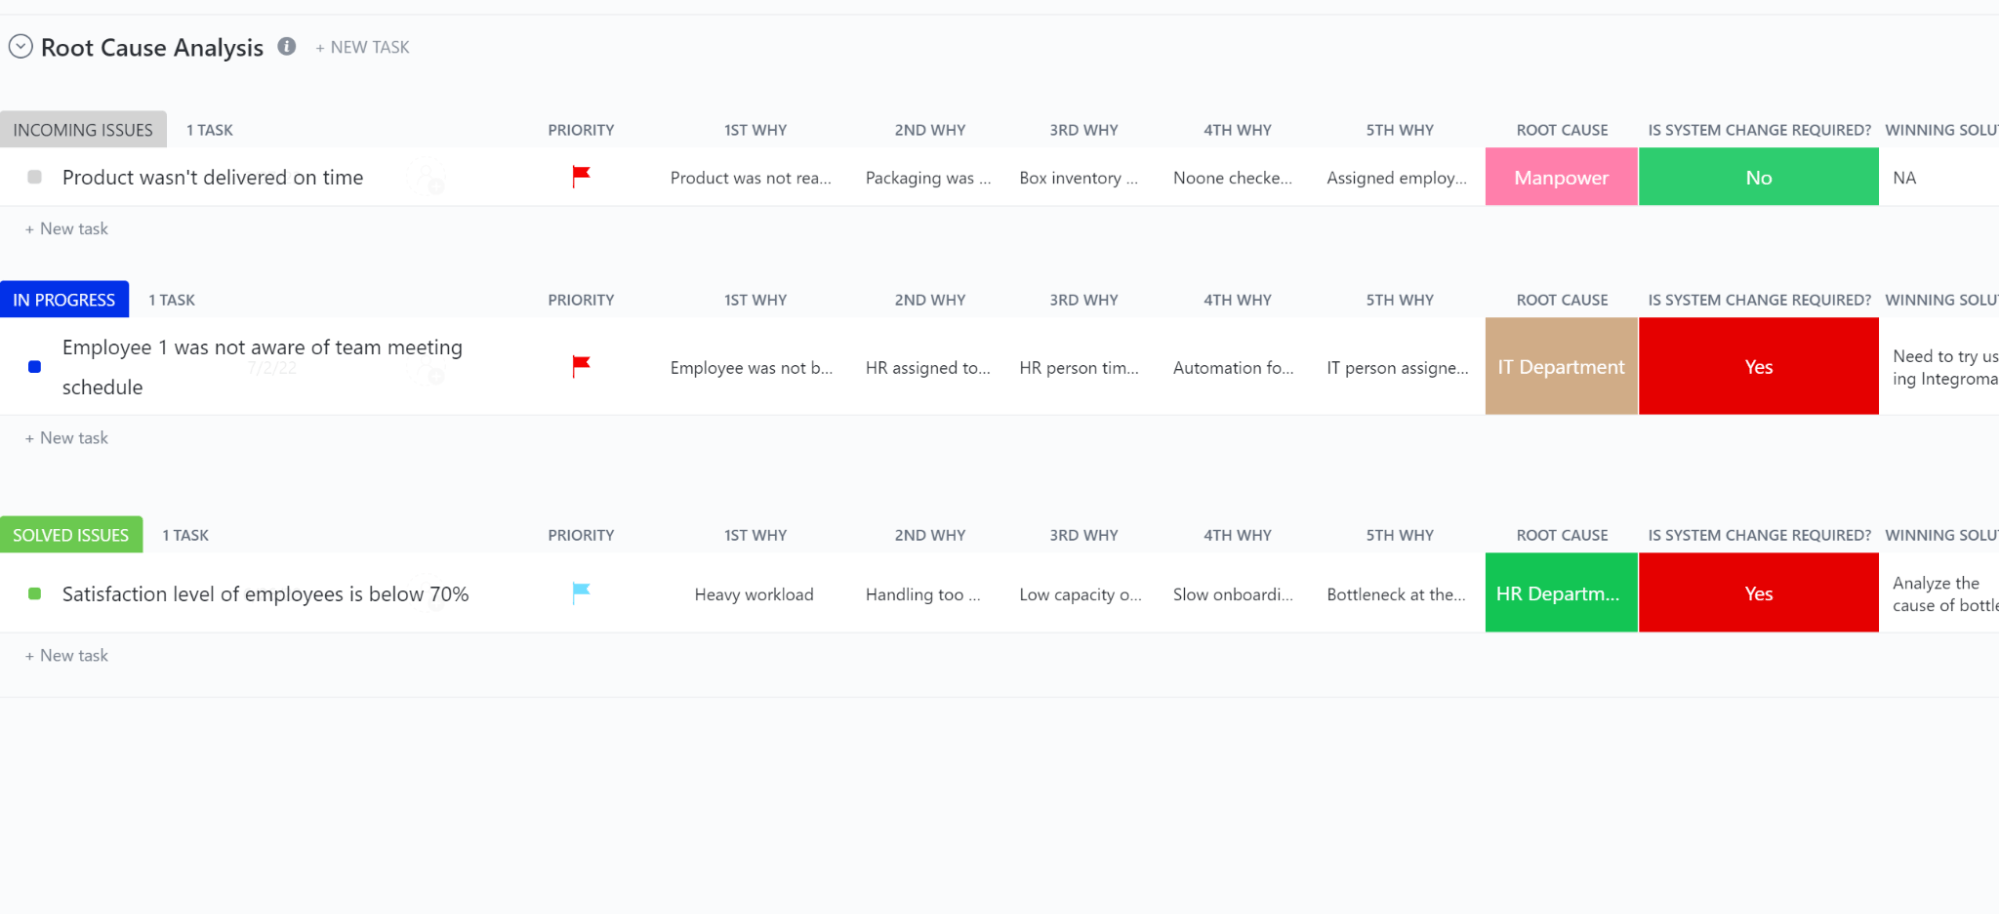
The ClickUp Root Cause Analysis Template is not a diagram but a comprehensive multi-functional tool for understanding problems, identifying their causes, and coming up with solutions.
While the previous templates were whiteboards, this one is a list containing multiple views, namely:
- Getting Started Doc: Explains how to use the template
- List of Issues: Displays all the problems grouped by status
- Priority List: Helps you plan by grouping issues based on their urgency tag
- Needs Action Board: Presents problems as cards for better visualization
In the List view, you can examine and manage all information surrounding a problem. By default, it contains the following columns—priority, causes 1–5, root causes, severity of the change, and winning solution. You can personalize it by changing the labels and categories or creating custom fields.
If you click on a problem, you’ll reveal additional information, such as the history log, checklists, and attachments. You can discuss specificities with teammates in the comments. ClickUp also lets you add custom Automations to optimize your workflow.
4. Microsoft Word Fishbone Diagram Template by TemplateLab
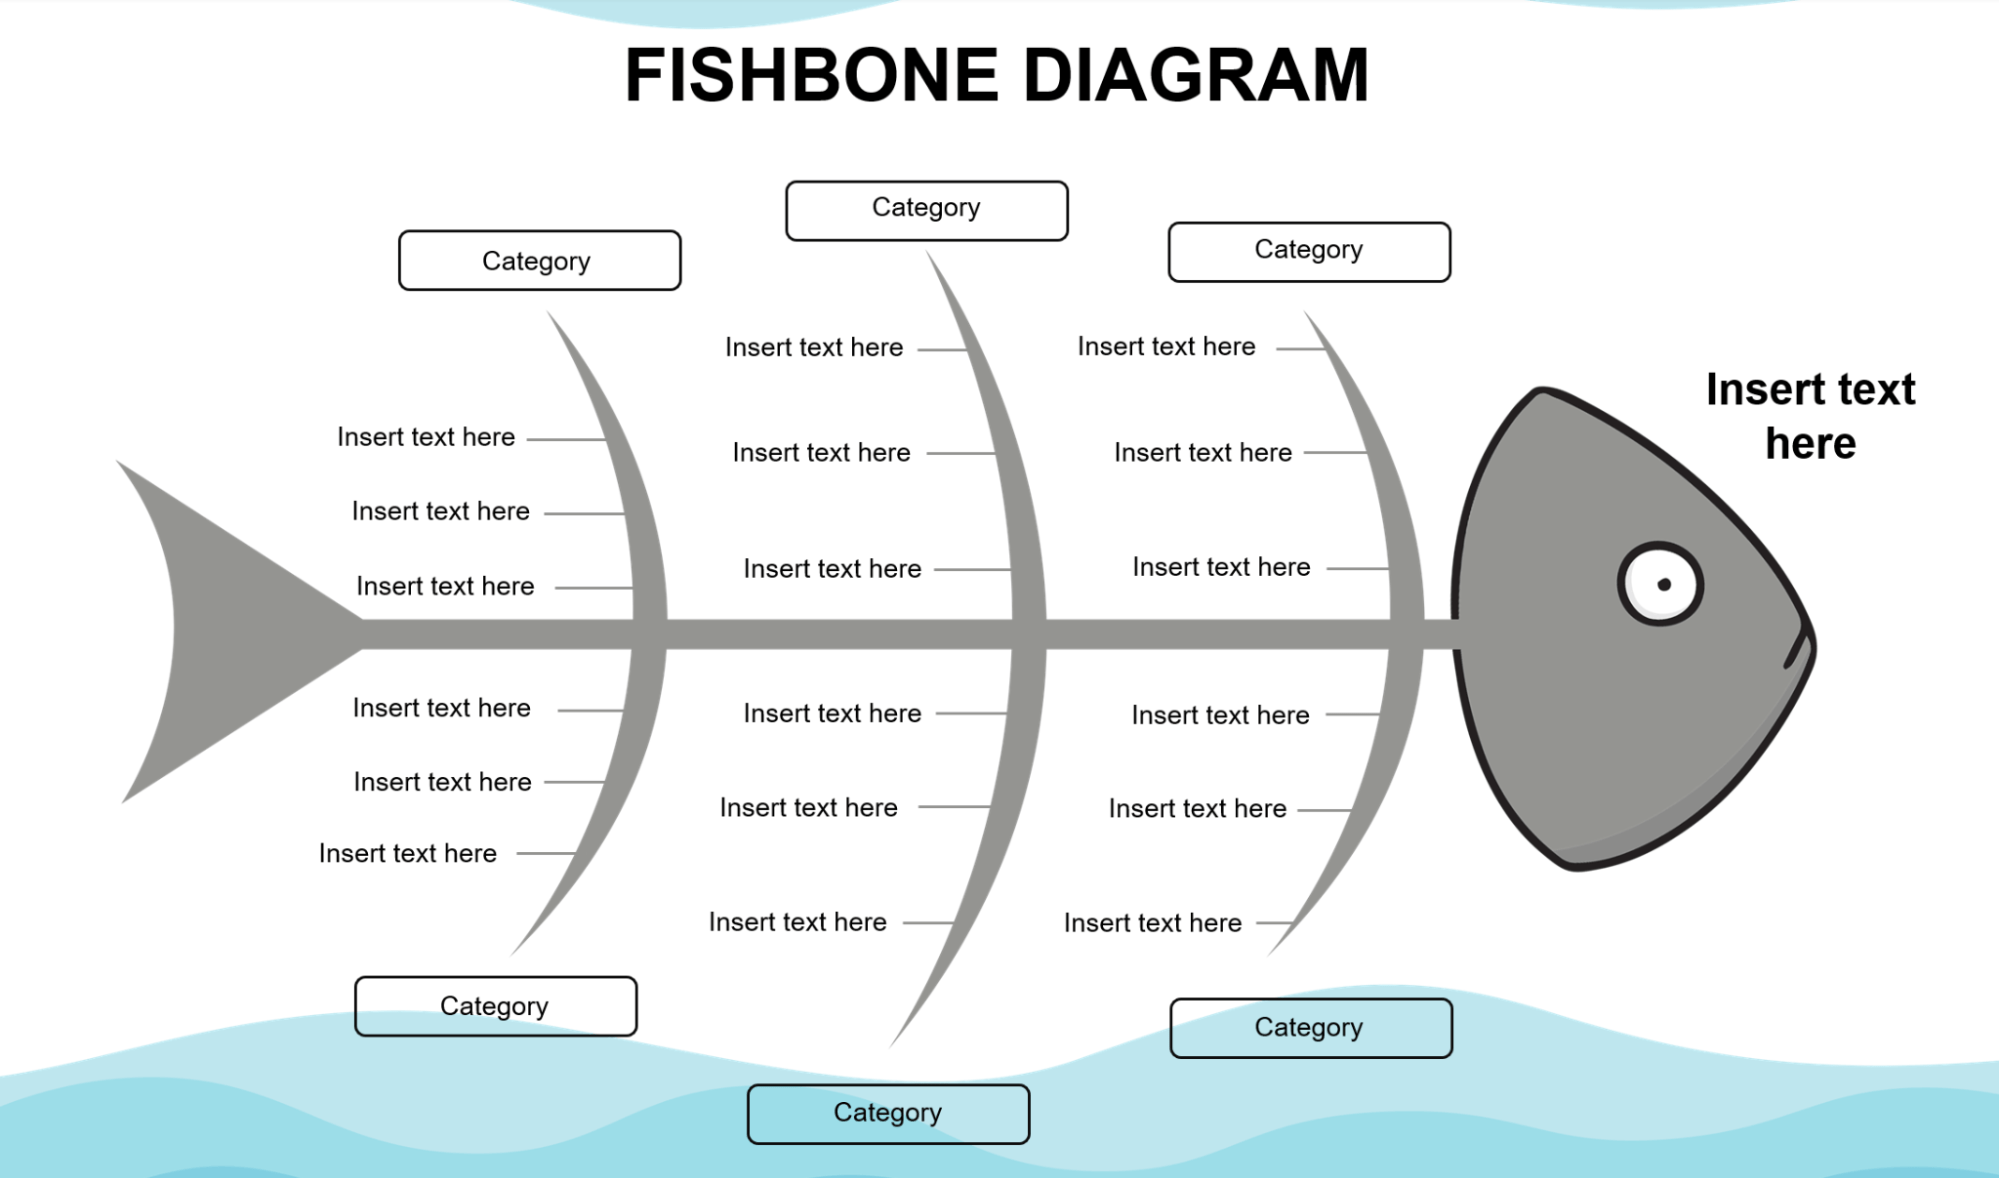
TemplateLab’s fishbone diagrams for Word are documents in which you can track the root causes of a problem statement. While it may not be the most feature-packed of the fishbone diagrams in this list, it’s the most notable in terms of design. The illustration of a concerned fish will put a smile on your face every time you sit down to discuss complex issues, making them less intimidating!
Using an effective diagram couldn’t be simpler. You only need to download it and run it in Microsoft Word, then write down the root cause in dedicated text boxes. You can’t change the number of main categories, i.e., causes, but you can do so with sub-causes.
Remove a branch by selecting the line and the text while holding the Control key, then pressing Delete. To add more branches, you can duplicate existing branches using the above-mentioned Ctrl multi-selection, then Copy (Ctrl+C) and Paste (Ctrl+V).
5. Cause & Effect Fishbone Diagram Template by Creately
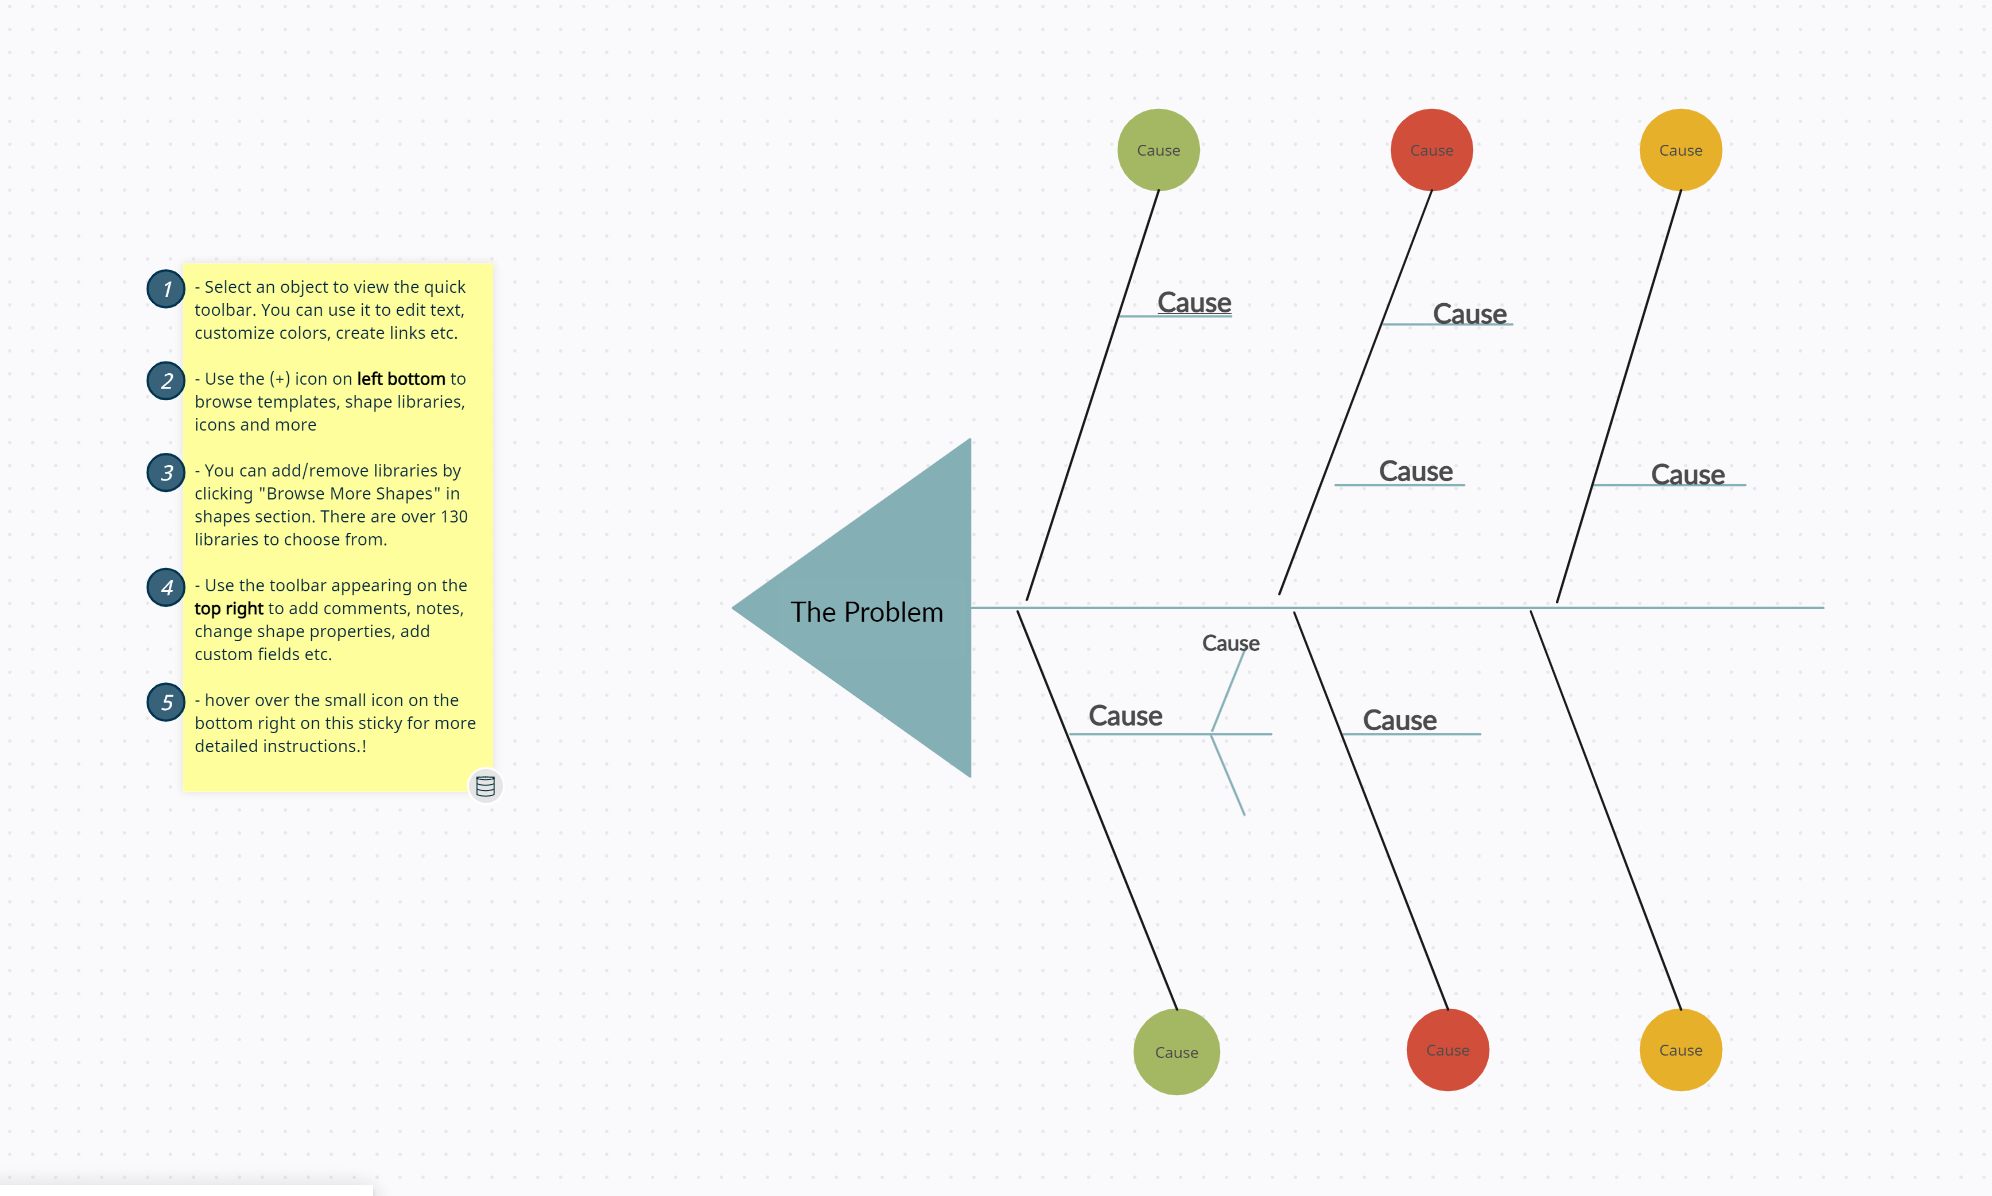
Another useful diagram tool for problem diagnosis is this Cause and Effect Diagram Template by Creately. It’s minimalistic and focused on practicality above all. It abides by the standard fishbone format with a central axis that symbolizes the problem and branches that depict causes.
The easiest way to edit this template is directly within Creately. You can do so for free with a demo account, although with limited features.
Like ClickUp, Creately lets you customize nearly every aspect of the template. You can change colors, insert new elements, and add connectors to create relationships.
Browse its vast library of shapes, frames, and stickers, then introduce them to the template by dragging and dropping. The app also lets you collaborate with your team in real-time.
If you become a paying client, you can export and use the template in external programs like Excel. It currently supports the following formats:
- PNG
- SVG
- JPEG
- CSV
6. Microsoft Word Fishbone Graphic Organizer Template by Template.net
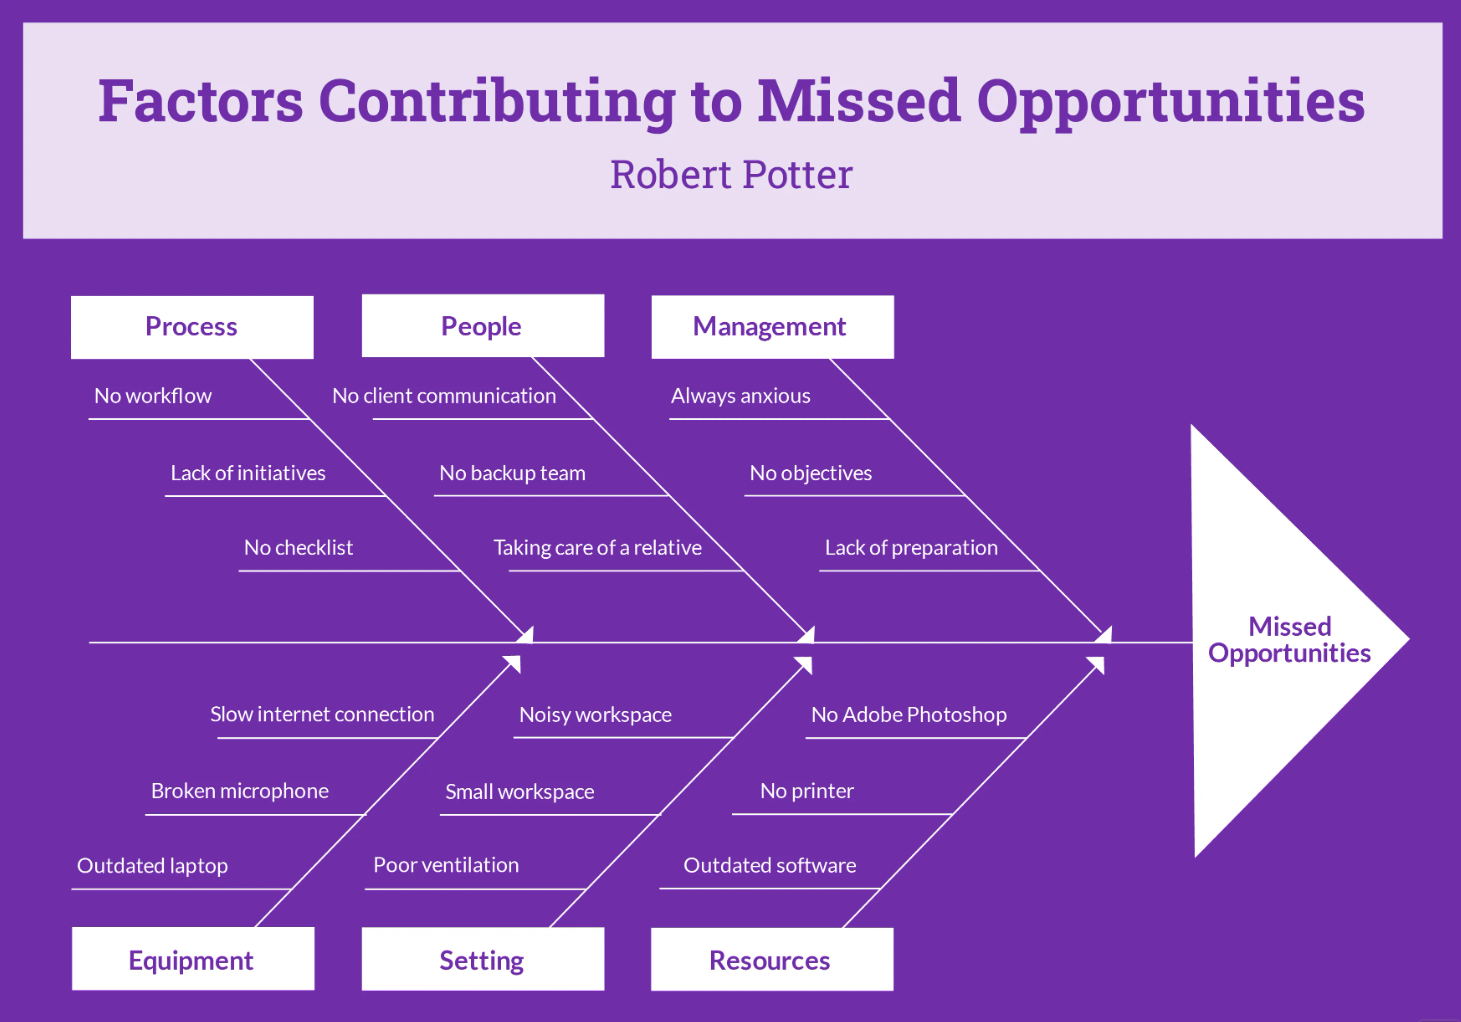
If purple is your color, this diagram will be right up your alley! Even if it’s not, you can change it in seconds once you open the template in Word.
The Fishbone Graphic Organizer Template by Template.net allows you to contemplate problems and their causes with style. It’s simple and elegant, with no bells or whistles in sight.
To use it, download the file and run it in Word. Click on text boxes to edit their contents and move objects around by clicking and dragging. Besides Word, this template can work in PowerPoint, Google Docs, Google Slides, and Adobe Illustrator.
Keep in mind that you have to be a paying Template.net subscriber to download the file. You can edit it directly on the website, but the exporting option is locked behind the paywall.
7. Fishbone Whiteboard Diagram Template by Template.net
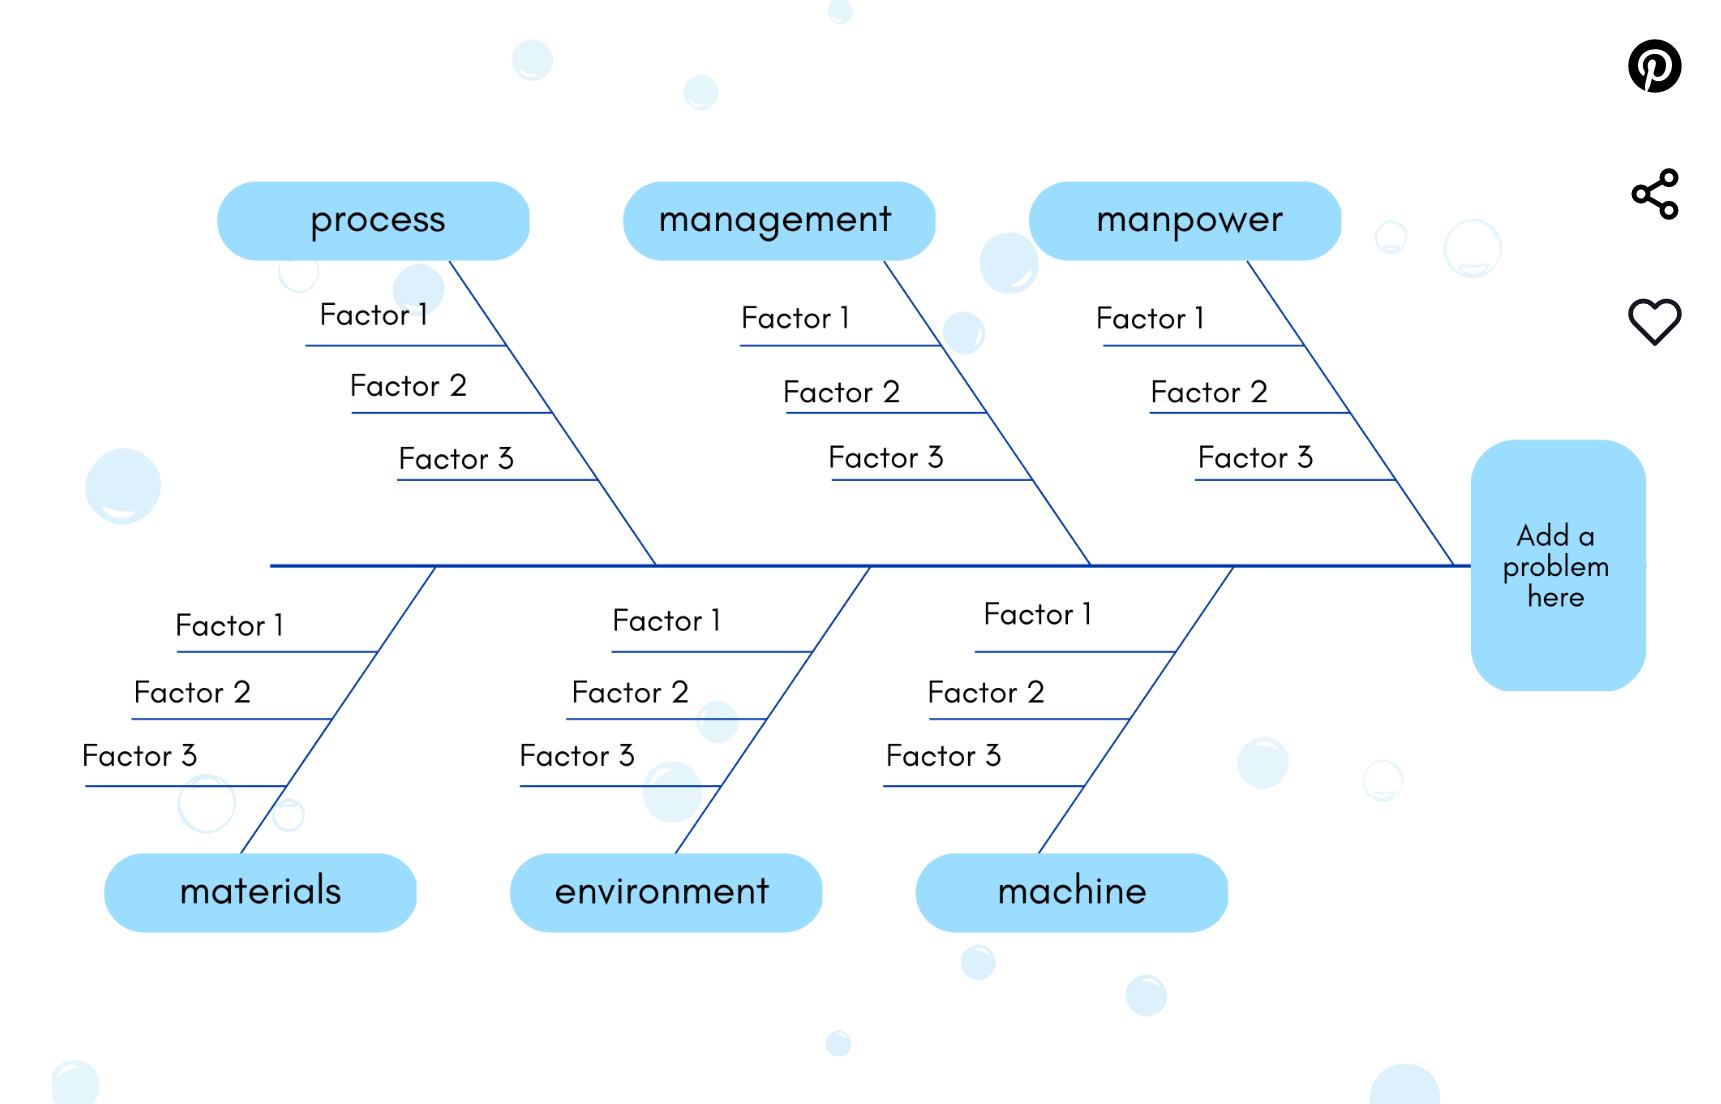
Instead of mulling the problem over, write down your thoughts in this Fishbone Whiteboard Diagram Template by Template.net to make them clearer. While it can’t do the solving for you, it can help you organize your ideas and devise the best possible resolution strategy.
The template includes the standard six cause categories and a space for you to outline your problem. Its whimsical design adds a touch of creativity to your analytical discussions, making them less dull.
As with the previous template, you can edit it on Template.net’s platform for free. To use this fishbone diagram maker in Word, you must opt for the Business or Pro plan.
8. Excel Ishikawa Fishbone Diagram Template by QIMacros
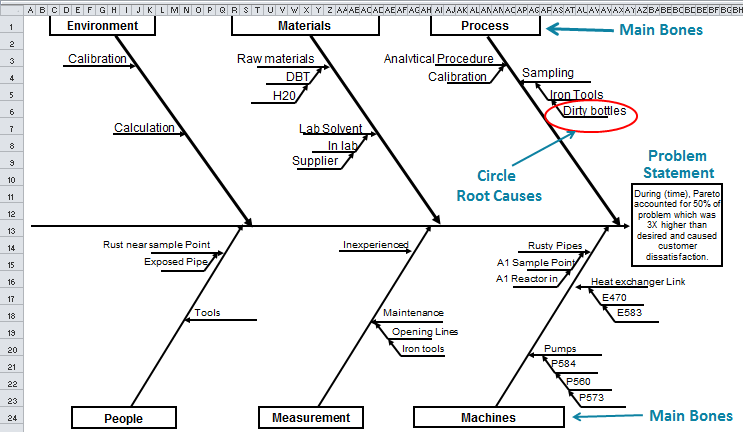
QIMacros’s Ishikawa Fishbone Diagram Template in Excel is one of the most versatile templates of its kind. It’s loaded with features and comes in four variations and five styles, making it adaptable to problems of all sizes and various contexts.
To use the template, you must install the QIMacros add-in. In the new menu within Excel, select the Fishbone Diagram. If you need help getting around, consult the Instructions tab.
The diagram comes in four variants:
- Small: A simplified version of the diagram with four fish bones
- Medium: Standard fishbone diagram with six bones
- Large: A complex diagram with six bones and extra main branches and sub-branches
- Love Bug: Similar to the standard diagram, but with the spine and bones on both sides of the head
Each variant has an Outline tab in which you can input the information, i.e., problem and causes. You can choose the style of the diagram to adjust it to your area of expertise:
- Healthcare
- Manufacturing
- Marketing
- Process
- Service
Once you fill out the outline, select the Create Fishbone option on the right side of the Problem Statement, and the diagram will show up. To emphasize the root causes, create an ellipse or any other shape around them. Revising the diagram is simple—you only need to edit the data in the outline, then select Create Fishbone again.
9. Excel Simple Fishbone Diagram Template by Someka

This Simple Fishbone Diagram Template in Excel by Someka has all you need for quick and effective problem analysis. It consists of two diagrams. The first one is basic, and the second one is an extended version that can support large amounts of data and more in-depth examination.
To fetch the file, you must provide your email address. Click on the link in Someka’s email to download the template. Note that if you’re a free user, you can only access the limited version of the template. The full and multi-user versions hide behind a paywall.
After opening the template, you’ll be greeted by the Input screen. It contains six categories and plenty of space for main and additional causes, but you can also customize them. Jot down all your thoughts in the table, then choose the version and select it. And voila, the diagram will pop up along with the data you’ve entered.✨
10. Fishbone Diagram Template by Canva
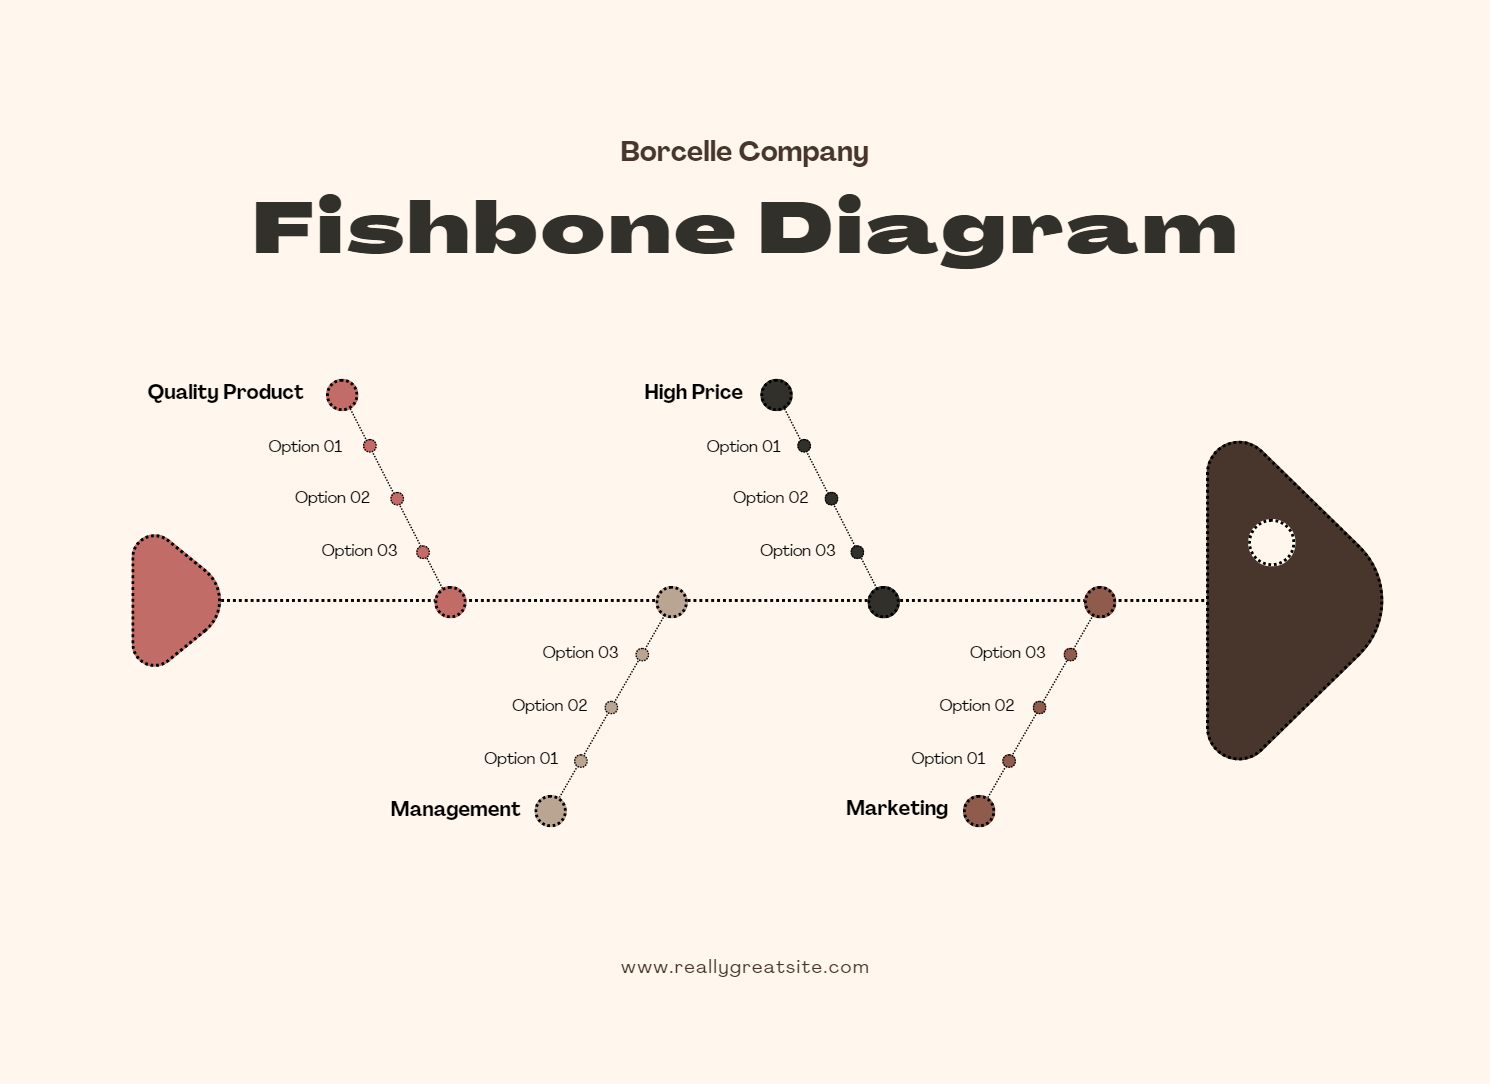
Visually, this template is the most pleasing of the bunch. The Fishbone Diagram Template by Canva—which uses the Ishikawa diagram model—offers a seamless integration of creativity and workflow, allowing you to streamline your problem-solving process.
The diagram contains only four cause categories, but it’s easily customizable. Not only can you add more shapes but also stickers, graphics, and grids. You can even include music to lighten up the mood and make the brainstorming session more fun and productive. Add quirky animations to create an interesting visual that’s bound to engage viewers.
Canva offers numerous functionalities. You can present the template in full screen, share it with teammates, or export it as an image or PDF file.
Top 10 Fishbone Diagram Templates—An Overview
Check out a brief overview of all templates and their benefits in the table below:
| Template | Benefits |
| ClickUp Fishbone Diagram Template | Lets you analyze the causes of a problem and brainstorm accompanying ideas |
| ClickUp Cause & Effect Template | Proposes a less fixed structure—ideal for those who find the original fishbone diagram too restrictive |
| ClickUp Root Cause Analysis Template | Contains multiple views as well as practical tools that help you identify the root causes of any defect |
| Word Fishbone Diagram Template by TemplateLab | Makes problem-solving more lighthearted with the comical fish illustration and vibrant colors |
| Cause & Effect Template by Creately | Offers a clean and simple way to track your thoughts when investigating underlying factors |
| Word Fishbone Graphic Organizer Template by Template.net | Enables you to easily organize the conversation around important issues, regardless of their complexity |
| Excel Fishbone Diagram Template by Template.net | Streamlines the data analysis process with its simple and intuitive design |
| Excel Ishikawa Fishbone Diagram Template by QIMacros | Comes with many features and diagram variations to suit specific situations |
| Excel Simple Fishbone Diagram Template by Someka | Lets you choose between two diagram sizes and does the organizing for you |
| Fishbone Diagram Template by Canva | Enables creating a gorgeous diagram and embellishing it with stickers and animations |
Benefits of Using a Fishbone Diagram Template
Using a fishbone diagram template entails many advantages. The most notable are:
- Efficiency: The template provides a framework for quick problem resolution, streamlining your workflow, and helping you keep up with the project timeline
- Visualization: You can record your thoughts and organize them in a logical and understandable way
- Collaboration: With all the information summed up and grouped, it’s easier to discuss the next steps and make collaborative decisions
- Improvement: Having an optimized troubleshooting process lets your company quickly resolve issues and keep growing
Try These Fishbone Diagram Templates and See for Yourself
No problem is too tough to understand. Some are difficult to solve, but most of them can be fixed if broken down into bite-size pieces. Once you figure out the potential; causes, the solution will be easier to fish out. 🎣
A fishbone diagram maker can set you up for success by helping you navigate the depths of problem analysis and emerge with a clear vision—ready to take action!


