

Customer experience is the new battleground where the business is won or lost.
You can have the best product in the market, but if you don’t promptly address customers’ pain points, implement their feedback, and engage with them meaningfully, it’s unlikely you’ll retain them.
Offering 24×7 customer service is no longer enough. Businesses need to focus on delivering a holistic customer experience. But how exactly do you determine the quality of your customer experience?
This is where customer experience key performance indicators (KPIs) come in.
With customer experience KPIs, you can analyze customer testimonials and learn more about:
- How satisfied your customers are
- How efficiently your support team is resolving customer queries
- The percentage of customers recommending your products or services to others
In this blog, we’ll explore the most impactful customer experience KPIs and how you can utilize them to enhance your overall customer experience.
Top Customer Experience KPIs & Metrics To Track in 2024
Understanding Customer Experience KPIs
Customer experience KPIs are defined as quantifiable metrics that help you evaluate your customers’ interactions, how they feel about your business, and the percentage of loyal and satisfied customers.
The Customer Experience (CX) Value Equation by Oracle provides three core areas of customer experience: acquisition, retention, and efficiency.
CX = Acquisition + Retention + Efficiency

Customer experience KPIs help you track efforts and improve in these three areas. For instance, conversion rate KPI (under the acquisition category) defines the number of leads converted successfully. It indicates whether your messaging, user experience, and value proposition resonate with your target audience.
Similarly, the Net Promoter Score (NPS) quantifies your customer retention efforts by calculating the likelihood of your customers recommending or ‘promoting’ your product/service to others. This helps understand the percentage of loyal customers.
Analytics play a significant role in tracking and interpreting customer experience KPIs. You can use analytics software to transform raw data into meaningful insights and reveal patterns and trends that might go unnoticed otherwise. Here’s how analytics enhance the effectiveness of CX KPIs:
The role of analytics for customer experience KPIs
- Data collection: Gather data from various touchpoints, including customer feedback, social media, purchase history, and support interactions, to ensure that no aspect of the customer journey is overlooked
- Real-time monitoring: Monitor KPIs in real time for swift action in response to emerging issues or opportunities
- Predictive insights: Forecast future trends based on historical data to proactively address potential challenges and capitalize on upcoming opportunities
- Personalization: Segment your customer base and tailor experiences to different groups, enhancing personalization and overall satisfaction. For example, if you have an app-based product, you can segregate customers by analyzing their product journey and push them to take specific actions, like using new features
- Performance benchmarking: Benchmark your KPIs against industry standards or competitors to set realistic, ambitious goals
8 Customer Experience KPIs to Track
Let’s understand some commonly used KPIs to measure customer experience.
1. Net promoter score (NPS)
Word-of-mouth marketing is one of the best ways to grow your business. According to a Nielsen Study, 88% of respondents trust recommendations from people they know over than any other marketing channel.
When Hush Puppies, an American shoe brand, was on the verge of shutting down, word-of-mouth marketing swooped in to create a domino effect, and within a year, it revived its business.
You can calculate the Net Promoter Score to assess how much word-of-mouth promotion your business is getting. Conduct customer surveys with questions such as ‘How likely are you to recommend this product to a friend or colleague?’ where the customers have to pick a number on a scale of 1-10.
Here, ‘1’ means least likely to recommend, and ‘10’ means extremely likely to recommend. The respondents are classified into different categories based on their scores:
- Promoters (9-10)
- Passives (7-8), and
- Detractors (0-6)
NPS is derived by subtracting the percentage of detractors from promoters. A high NPS indicates strong customer loyalty and satisfaction, making it a vital KPI for gauging overall sentiment and predicting business growth.
Pro tip: You can use the ClickUp Net Promoter Score Survey Template to conduct customer surveys and get insights into customer loyalty and satisfaction levels. ClickUp lets you view survey responses on intuitive dashboards and identify areas of improvement to enhance your customer experience.

2. Customer satisfaction score (CSAT)
Are your customer experience efforts worth it? Is the new customer experience strategy working? Whenever you are in doubt about whether you are serving your customers right, calculate the Customer Satisfaction Score (CSAT).
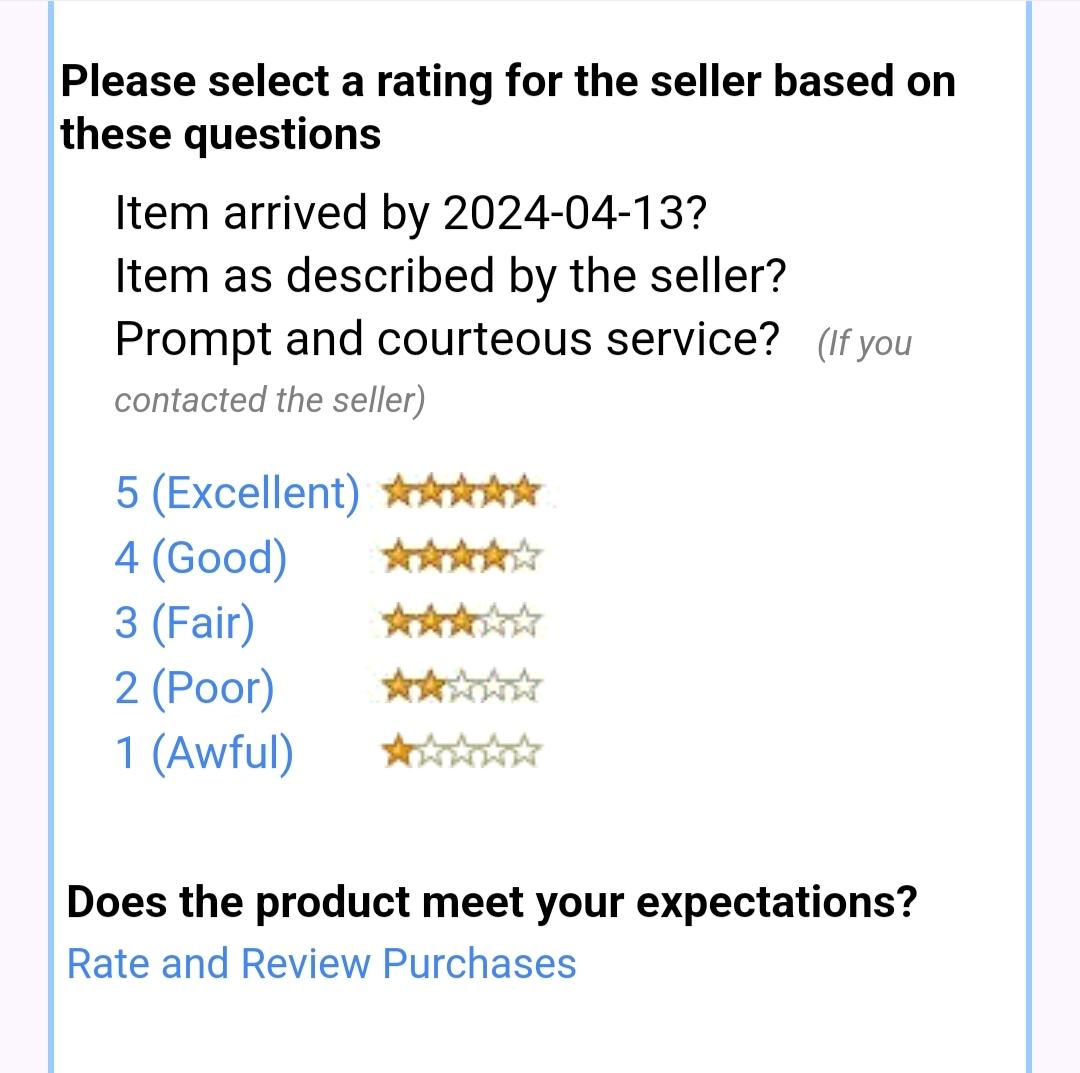
This also requires conducting a survey where you ask customers to rate their experience on a scale of 1-5. The value ‘5’ represents extremely satisfied, and ‘1’ represents extremely dissatisfied. You can conduct CSAT surveys after product deliveries or customer service calls.
CSAT helps you get immediate feedback on specific areas of the customer journey. A high CSAT score reflects effective customer service and product quality, directly influencing customer retention and advocacy.
For instance, after delivering a product, Amazon sends the following survey over email to understand customer satisfaction.
3. Customer effort score (CES)
Step into your customers’ shoes for a moment. Imagine waiting on a support call for over 10 minutes just to resolve a query. You’ll likely feel frustrated.
Ensuring a great customer experience also means making it easier for customers to connect with you. So, if a consumer responds with a statement such as, “The company made it easy for me to handle my issue,” you have bagged yourself a desirable Customer Effort Score (CES).
Lower customer effort scores mean a smoother, more customer-friendly process, which can significantly enhance satisfaction and loyalty. CES is particularly valuable for identifying and eliminating friction in the customer journey.
Pro tip: You can calculate CES with ClickUp’s Customer Effort Score Survey Template. The template helps you analyze customers’ ease of interaction and pain points.
4. Conversion rate
Your marketing team is implementing creative campaigns, but are they actually effective? Your website and ads have multiple views and click rates, but if they are not generating enough customers, they are not working. Of course, the ultimate goal for any business is to acquire more customers and boost revenue.
So, if you’re looking for a KPI to understand the effectiveness of your sales funnel and marketing efforts, it has to be conversion rate.
Conversion rate is a customer acquisition KPI that determines the percentage of leads converted into customers.
Conversion Rate = (Total Number of Visitors or Interactions/Number of Conversions) x 100
It tells you that your campaigns and strategies are reaching the right target audience and your call-to-actions are effective, driving your visitors to perform the desired action.
5. Customer retention rate (CRR)
You have successfully converted a lead into sales, but how long will they stay? To measure this, you must track the Customer Retention Rate (CRR), or the percentage of customers who continue to do business with you over a specified period.
You can calculate the customer retention rate by dividing the number of retained customers by the number of customers at the start of the period. A high retention rate means your customers are satisfied and loyal, reducing the need for constant new customer acquisition strategies and fostering long-term revenue growth.
Pro tip: Use customer retention tools like ClickUp to retain existing customers by improving customer satisfaction and loyalty. The ClickUp Customer Retention Survey Template helps you collect and analyze customer feedback easily so you can improve your strategies.
6. Customer churn rate (CCR)
How do you know you’re doing a bad job at keeping your customers satisfied? When you see them leave.
This is when you calculate the customer churn rate. Customer churn rate is simply the percentage of users who stop using your products or services and cancel their subscriptions.
It’s the inverse of the retention rate, and you can calculate it by dividing the number of lost customers by the number of customers at the start of the period. A high churn rate is a big red flag 🚩 , indicating dissatisfaction and the need for immediate intervention. Reducing churn is vital for maintaining a stable and growing customer base.
Pro tip: To gather valuable insights on reasons for customer churn, you can use the ClickUp Churn Survey Template. It helps you identify reasons for customer churn and make data-driven decisions to improve customer experience.
7. Average resolution time (ART)
A Gartner Report on Customer Service says that almost 28% of customers abandon customer service if they have to stay on a call for too long. So, if your customer response is slow, you lose customer loyalty and might even get bad reviews.
Calculating the average resolution time KPI is essential for smooth customer lifecycle management. ART means the average time your business takes to resolve customer complaints.
Average Resolution Time (ART) = Total Resolution Time for all tickets solved / No. tickets solved
A higher ART leads to a low customer satisfaction score, which, in turn, decreases the customer retention rate. So, you need to monitor ART continuously for business growth.
Pro tip: Try the ClickUp Call Center KPI Tracking Template to track average handling time, first call resolution rate, and customer satisfaction score. You can also analyze agent productivity and call abandonment rate to improve customer service.

8. Customer lifetime value (CLV)
Ultimately, it all comes down to how much money a customer brings into the business. To calculate this, measure the customer lifetime value (CLV), which estimates the total revenue your business can expect from a single user account throughout their relationship.
Customer Lifetime Value (CLV) = Customer Value x Average Customer Lifespan
A high CLV indicates that customers are valuable and engaged, contributing significantly to long-term profitability. By increasing CLV, you can drive more sustainable growth as you maximize the value derived from each customer.
You can set KPIs according to your business needs and empower your team to solve inefficiencies, eliminate time-consuming requests, and align tasks with company-wide goals.
How to Track Customer Experience KPIs?
By now, you know the importance of tracking KPIs for customer experience. But how can you track them effectively to ensure you get valuable insights? This is where you need a powerful KPI tracking software like ClickUp.
The ClickUp CRM Solution helps customer success teams streamline their efforts and manage customer communication better.
With ClickUp CRM, you can build a sales pipeline, engage with customers, onboard customers, track orders, monitor lifetime customer value, and much more.

ClickUp’s Customer Service Teams Solution also helps businesses achieve their customer service goals by customizing workflows, delegating tasks efficiently, and setting clear priorities to focus on important tasks.
Let’s see how you can leverage ClickUp to track and improve your customer experience KPIs:
Define goals and milestones
Tracking KPIs for customer experience involves focusing on long-term objectives while tracking short-term progress. So, you must first define clear goals and then create metrics for them.
ClickUp Goals can help you with this. It enables you to set clear and measurable goals, assign timelines, and automate progress tracking.

Set up KPI tracking
Once you have set your goals and broken them into achievable targets, define your KPIs within ClickUp. You can use the ClickUp KPI Template to visualize KPIs and track team progress. The Board View in ClickUp helps you monitor specific KPIs so you can make informed decisions.
With this template, you get to categorize and prioritize KPIs based on their relevance to customer experience, ensuring you capture all critical metrics.

Enable data input and integration
Integrate ClickUp with other tools you use for customer success, such as HubSpot or Salesforce. This integration will enable seamless data flow, ensuring your KPIs are updated in real time.
Use custom fields
Customize fields within tasks to reflect specific customer experience KPIs, such as Net Promoter Score (NPS), Customer Satisfaction Score (CSAT), and Customer Effort Score (CES). This customization makes inputting and tracking the data relevant to each metric easy.
Visualize data with dashboards
ClickUp Dashboard is pivotal in measuring customer experience KPIs. They provide a centralized, real-time view of all your metrics, allowing you to monitor performance at a glance.

With ClickUp Dashboards, you can automate KPI reporting. This ensures you receive timely insights without manual effort. KPI reporting can highlight areas of improvement and track progress over time.
Trying to stay on top of all these KPIs can feel overwhelming at times. You may need to pick and choose your problems based on priority. ClickUp’s Managing Multiple Engagement Form Template lets you prioritize requests, track progress with clear updates, and collaborate effortlessly with your team.
It can also help you:
- Centralize KPI-related tasks: Track deadlines, deliverables, and client expectations in one place
- Improve visibility: Monitor progress on each task and stay on top of your workload
- Save time: Reduce manual tracking and data entry for simple action items like resolving support tickets

Become a Client Success Champion
Tracking customer experience KPIs is essential for understanding and enhancing customer satisfaction, loyalty, and overall experience. Metrics like NPS, CSAT, CES, and churn rates provide actionable insights to drive strategic improvements.
With ClickUp, you can easily track these customer experience KPIs by centralizing data to get real-time updates and leverage customizable dashboards for automated reporting.
ClickUp CRM solution and customer service capabilities simplify KPI tracking, ultimately improving customer experiences and fueling business growth. Sign up for free on ClickUp and become a KPI-centric customer success champion!

Everything you need to stay organized and get work done.
