Monthly subscription costs are easy to ignore. Until you realize you’re paying for three different AI tools and four separate project managers. While a single $10 charge may feel small, the cumulative cost of fragmented tools drains your budget and focus.
This guide shows you how to build a free subscription tracker in Google Sheets to regain visibility. You will learn how to set up column headers for renewal dates, use formulas to automate spend tracking, and create alerts for upcoming charges.
We will also discover an alternative to fix a bloated tech stack: ClickUp Accelerator. It lets you consolidate your work and replace multiple AI subscriptions with a context-aware AI engine, reducing costs and time spent switching between tabs.
Summarize this article with AI
ClickUp Brain not only saves you precious time by instantly summarizing articles, it also leverages AI to connect your tasks, docs, people, and more, streamlining your workflow like never before.
Summarize this article for me please
Why Use Google Sheets to Track Subscriptions
The biggest problem with subscriptions isn’t the cost of one, but the slow, silent creep of many.
🧠 Fun Fact: The average consumer spends $219 monthly on subscriptions but believes they’re only spending $86. This lack of spend visibility is a huge source of budget anxiety for teams and individuals alike.
A streaming service here, a software tool there—these small recurring charges add up. Before you know it, you’re losing money to services you forgot you even had, a classic case of “subscription creep.”
A subscription tracker in Google Sheets is a practical first step to regain control. While dedicated subscription trackers exist, many charge recurring fees. The irony of paying a subscription to track your subscriptions isn’t lost on us.
Google Sheets gives you a free, accessible, and completely customizable way to see everything in one place.
Google Sheets works well because:
It’s free: You don’t need to add another subscription to your list just to manage the ones you already have
It’s fully customizable: You can build the exact columns and categories that make sense for your personal or team budget, without being locked into a rigid format
It’s shareable: You can easily collaborate with a partner, roommate, or your finance team to manage shared expenses
It’s formula-powered: You can use built-in functions to automate totals, flag upcoming renewal dates, and calculate your annual spend without manual math
The main trade-off is the manual work. You have to enter the data yourself; it won’t automatically sync with your bank statements. But for many, that’s a small price to pay for total flexibility and a clear view of where your money is going each month.
📮ClickUp Insight: Low-performing teams are 4 times more likely to juggle 15+ tools, while high-performing teams maintain efficiency by limiting their toolkit to 9 or fewer platforms. But how about using one platform?
As the everything app for work, ClickUp brings your tasks, projects, docs, wikis, chat, and calls under a single platform, complete with AI-powered workflows. Ready to work smarter? ClickUp works for every team, makes work visible, and allows you to focus on what matters while AI handles the rest.
Summarize this article with AI
ClickUp Brain not only saves you precious time by instantly summarizing articles, it also leverages AI to connect your tasks, docs, people, and more, streamlining your workflow like never before.
Summarize this article for me please
How to Set Up a Subscription Tracker in Google Sheets
Starting with a blank spreadsheet can feel overwhelming. You know you need to track your subscriptions, but what information is actually important? If you create a system that’s too simple, it won’t be useful. If it’s too complex, you’ll abandon it within a week.
Follow these steps to build a functional subscription tracker in Google Sheets in about 15 minutes. We’re assuming you’ve a Google account to set one up.
1. Create a new Google Sheet
First, open Google Sheets in your browser or from your Google Drive. Select the option to start a new blank spreadsheet. Give it a clear name like “Subscription Tracker” so you can easily find it later.
The columns you create will determine what information you can track. These headers are the foundation of your tracker, so don’t skip them. Add these to the first row of your sheet:
Column
Purpose
Subscription name
The name of the service or product (e.g., Netflix, Spotify)
Category
How you group the expense (e.g., Streaming, Software, Fitness)
How often you’re billed (e.g., Monthly, Annual, Quarterly)
Renewal date
The exact date of the next payment
Payment method
Which card or account is being charged
Status
The current state (e.g., Active, Paused, Cancelled)
Notes
Any extra details, like cancellation instructions or account info
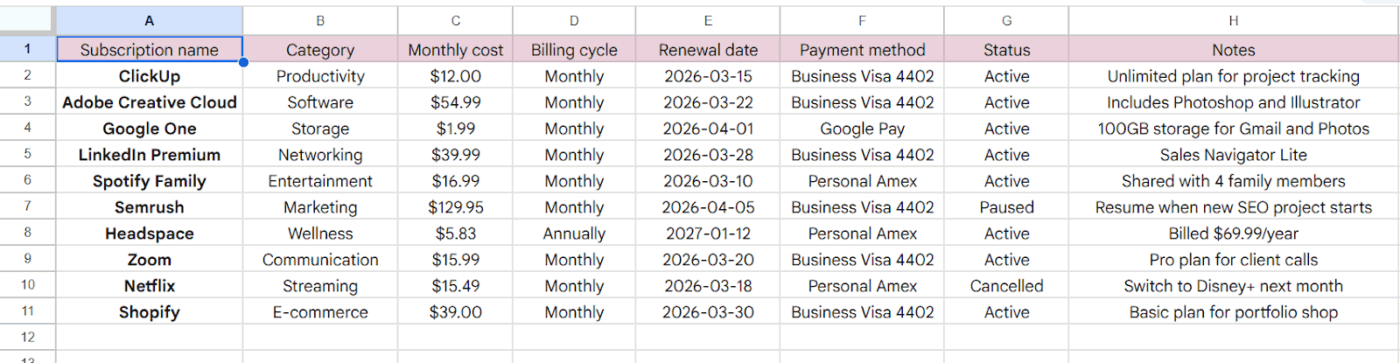
This is how your Google Sheet will look with all the data consolidated in one place:
3. Apply data validation
Data validation is a feature that creates dropdown menus for your cells. This is key to keeping your data clean and consistent, which enables filtering and formulas to work correctly.
Select the entire ’Category’ column, then navigate to Data > Data validation
Create a dropdown list with your spending categories
Repeat the same for the ’Billing Cycle’ and ’Status’ columns.
4. Format currency columns
To make your costs easy to read, select the ’Monthly Cost’ column.
Go to Format > Number > Currency
This automatically adds a dollar sign and standardizes the number of decimal places across all your entries, ensuring accurate calculations.
5. Add a SUMIF formula for totals
Use Google Sheets’ formulas to make your spreadsheet smarter. Instead of manually adding up your costs, you can use one to do it for you.
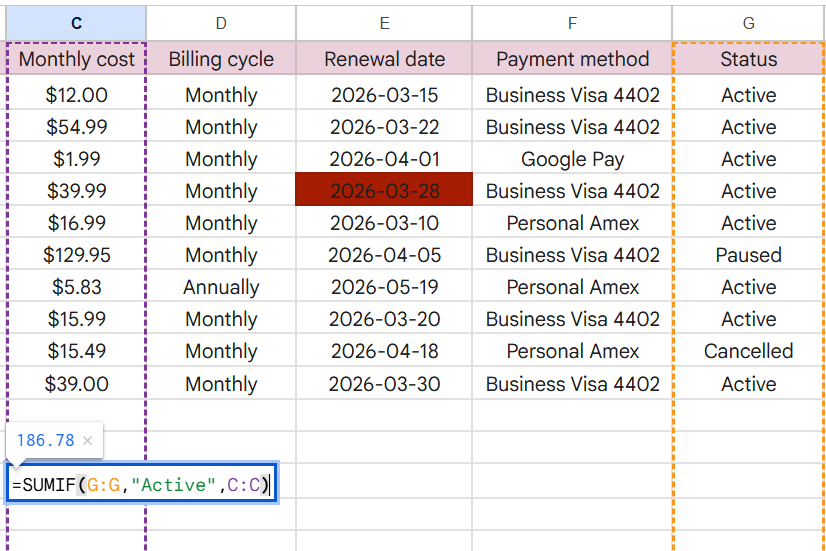
To calculate your total monthly spending on active subscriptions, find an empty cell and enter:
=SUMIF(G:G,”Active”,C:C)
This formula tells Google Sheets to look at your ’Status’ column (for example, column G), find every subscription marked ’Active,’ and then add up their corresponding costs from the ’Monthly Cost’ column (let’s assume, column C).
6. Create a renewal date tracker
To avoid surprise renewals sneaking up on you, you can create a simple countdown.
Add a new column in your Google Sheet. Let’s call it ‘Days Until Renewal.’
You can use the TODAY() function to determine how many days remain until the next payment.
Enter this formula:=E2-TODAY()
It subtracts the current date from your renewal date in Column E. Plus, the sheet updates automatically whenever you open it.
A positive number shows you how many days you have left, while a negative number means the renewal has already passed.
Summarize this article with AI
ClickUp Brain not only saves you precious time by instantly summarizing articles, it also leverages AI to connect your tasks, docs, people, and more, streamlining your workflow like never before.
Summarize this article for me please
Advanced Features for Your Subscription Tracker
⚠️ A basic tracker is a great start, but it’s still a passive list of data. You have to remember to open it and check it regularly. If you don’t, you’ll still miss renewal dates, and you won’t get any high-level insights into your spending habits. Basically, the tracker will likely become just another file you forget about.
But we have a way to make your tracker a lot more useful. With a couple of advanced features, you can transform your static list into a dynamic dashboard that actively alerts you and analyzes your spending. ✨
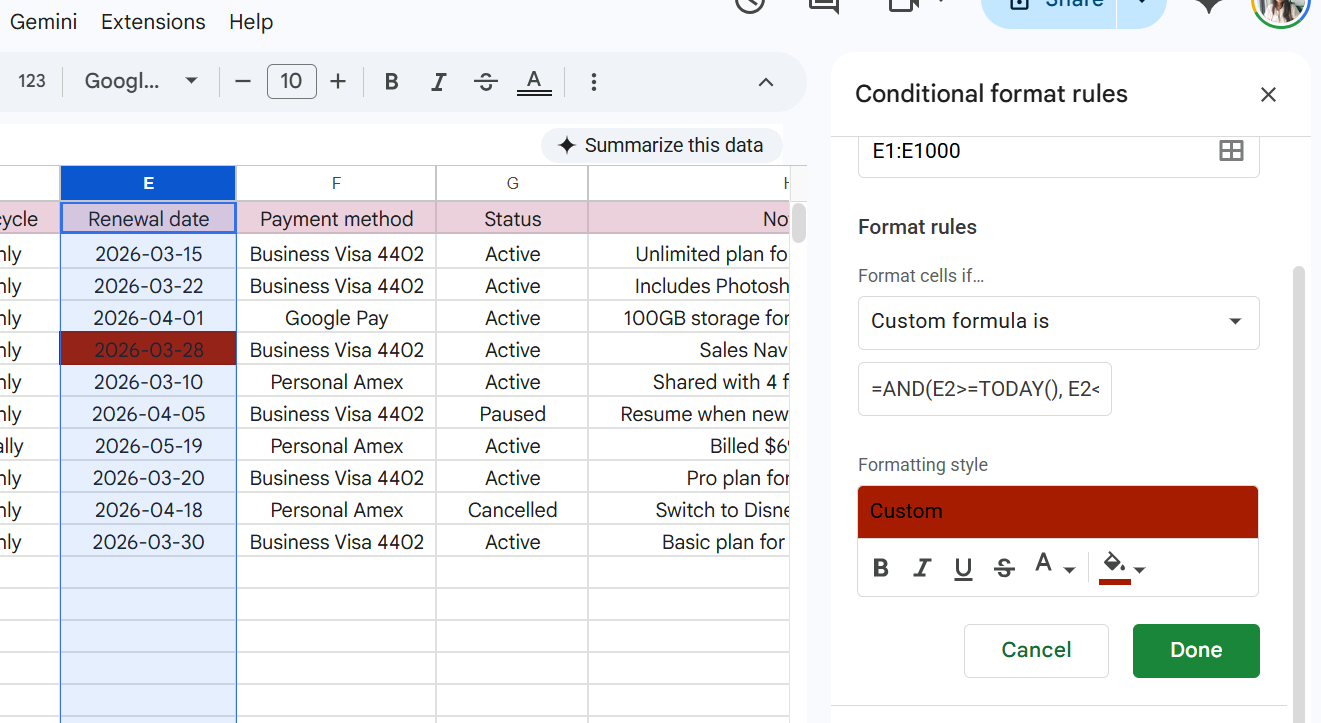
Conditional formatting for renewal reminders
Conditional formatting is a feature that automatically changes the color of a cell based on rules you create. It’s like setting up traffic lights for your renewal dates, making it impossible to miss an upcoming charge.
To set up conditional formatting:
Select your entire ’Renewal Date’ column
Go to the menu and click Format > Conditional formatting
Click on the drop-down of ‘Format cells if,’ and choose ‘Custom formula is’
Assuming your data is in Column E, create rules using custom formulas:
To highlight renewals within seven days in red: Use the formula =AND(E2>=TODAY(), E2<=TODAY()+7)
To highlight renewals within 14 days in yellow: Use the formula =AND(E2>TODAY()+7, E2<=TODAY()+14)
Set style by choosing the color red or any other of your choice, and click on Done
These visual cues make your tracker proactive. You’ll see at a glance which subscriptions need your attention before the auto-renewal window closes. You can even add another rule to gray out any rows with a status of ’Cancelled.’ This keeps your view clean and focused on active expenses.
Pivot tables for subscription analysis
A pivot table in Google Sheets summarizes your data without you having to write complex formulas. It’s the perfect tool for answering bigger questions about your spending, like “How much do I spend on software each year?” or “Which category makes up the biggest chunk of my subscription budget?”
To create a pivot table:
Select all your data, including the headers
Go to Insert > Pivot table
In the Create pivot table window, enter A1:I11 to capture all your columns in the Data Range
Choose a cell like J1 in your Existing sheet to see it side-by-side and click Create
📌 You can also select the new sheet option to keep your analysis separate.
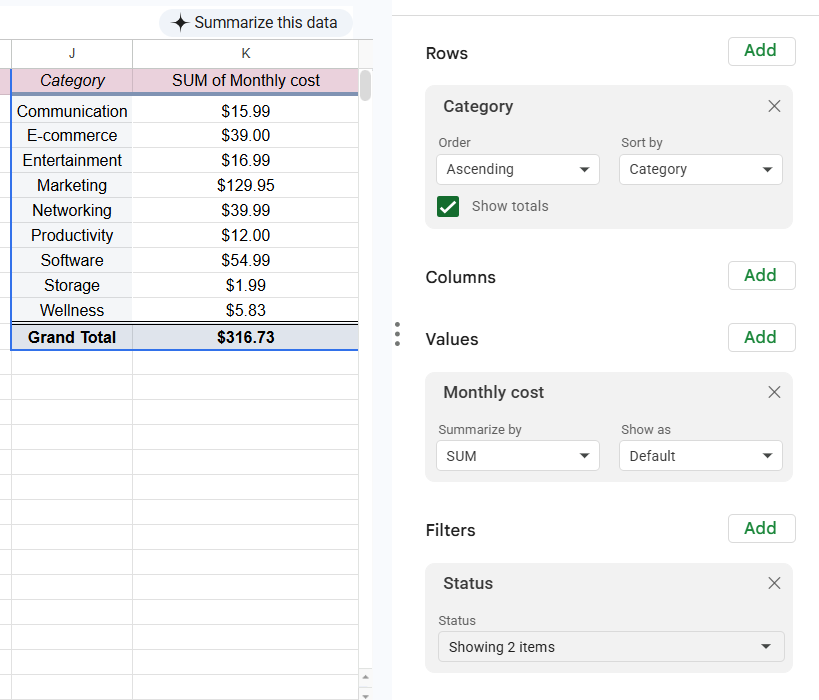
Use the editor panel on the right to organize the data:
Rows: Add Category to see a breakdown by groups like ‘Category’ or ‘Software’
Values: Add Monthly cost and ensure it is set to SUM to calculate the total for each category
Filters: Add Status and uncheck the box for Cancelled so that services like Netflix are excluded from your totals
This is how your Pivot Table editor and sheet will look:
Now, you’ve turned raw data into actionable insights and have a clean summary of your spending grouped by category. Use this view to identify exactly where you can cut back or consolidate tools to stay lean.
👀 Did You Know? SaaS spend averages $4,830 per employee annually. Keeping a close eye on these categories helps you spot overlaps before they dent your budget.
Summarize this article with AI
ClickUp Brain not only saves you precious time by instantly summarizing articles, it also leverages AI to connect your tasks, docs, people, and more, streamlining your workflow like never before.
Summarize this article for me please
Track Subscriptions Faster with ClickUp
Google Sheets is an ideal solution for personal finance tracking. However, if you adopt it for your growing team, it will eventually lead to tool sprawl—the finance department approving new software tools, IT managing license assignments, and your team stuck in the middle, manually updating spreadsheets and chasing each other down in Slack.
This fragmentation can easily lead to a key renewal getting missed because the sheet owner is on vacation. Plus, there’s no clear audit trail for who approved which tool.
Before you know it, your simple tracker has become a source of friction and risk.
👀 Did You Know? Organizations with 100 employees lose $420,000 annually due to miscommunication and disconnected tools.
📮 ClickUp Insight: 44% of our survey respondents use spreadsheets to manage their projects and tasks. But spreadsheets were never designed for evolving workflows.
As your projects grow more complex, keeping statuses, timelines, and assignments up to date becomes a manual, time-consuming task.
A converged AI Platform like ClickUp solves this problem with purpose-built Views like List, Table, Calendar, and Gantt. That means, you get to visualize tasks in a way that makes sense for you and your team.
Set up trigger-based Automations to update fields and statuses as work moves forward, and suddenly, manual updates become a thing of the past.
Never miss a renewal with ClickUp Automations and Recurring Tasks
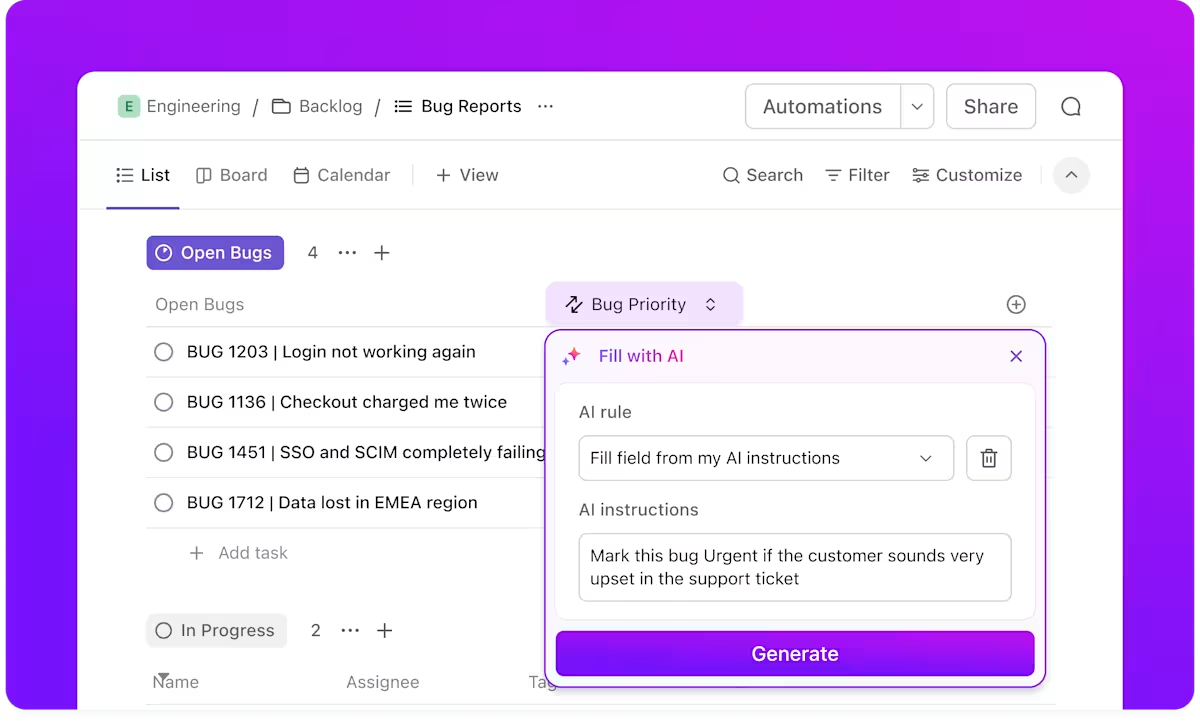
The biggest risk of manual tracking is the missed cancellation window. Instead of manually checking a date column and keeping a mental note, you can use ClickUp Automations to do the remembering for you.
They let you set a trigger to send yourself (or another team member) a reminder seven days before a renewal date, which automatically creates a review ClickUp Task for the department head or posts a reminder in a specific ClickUp Chat channel. This ensures you evaluate the tool’s value before the next charge.
Trigger AI-generated updates for tasks with customized ClickUp Automations
To further standardize these habits, use Recurring Tasks. For any subscription that requires an annual or quarterly review, you can set the task to recur automatically. Once you complete the review and close the task, ClickUp will automatically create the next one based on your schedule, ensuring that proactive evaluation becomes a standard part of your workflow.
Build a structured database with Custom Fields and Docs
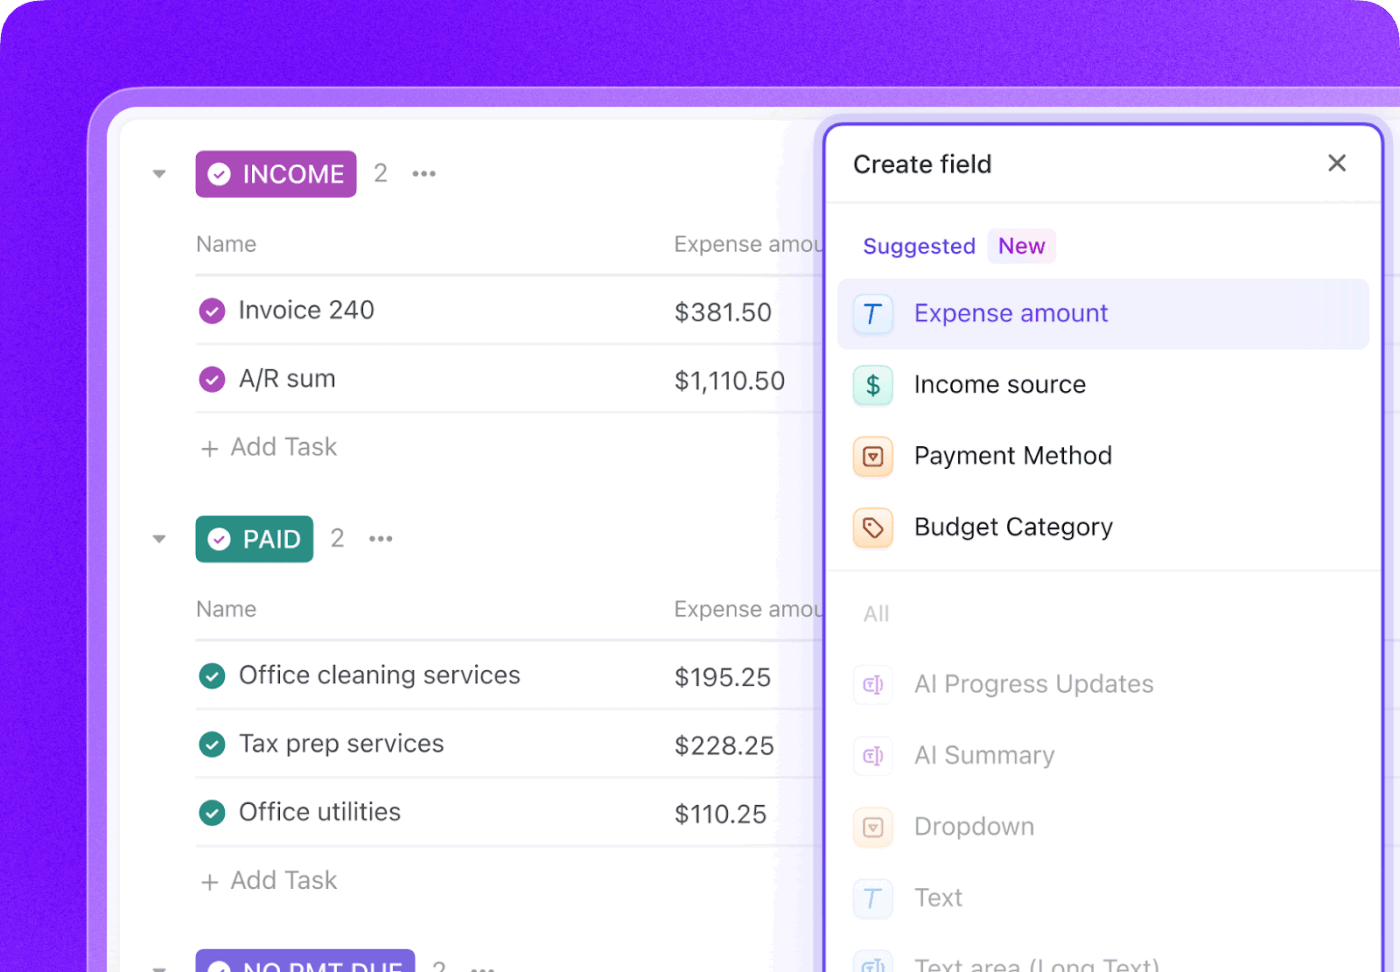
Similarly, while a spreadsheet limits you to static rows and columns, ClickUp Custom Fields allow you to build a structured, interconnected database for every vendor. You can log specific data points, such as monthly cost, contract terms, and payment methods, directly within a ClickUp Task.
Customize the details you want to monitor in your subscription tracker with ClickUp Custom Fields
This keeps all your context—including the vendor agreement itself—attached to the work, so you don’t hunt through email threads to find a contract during a budget audit.
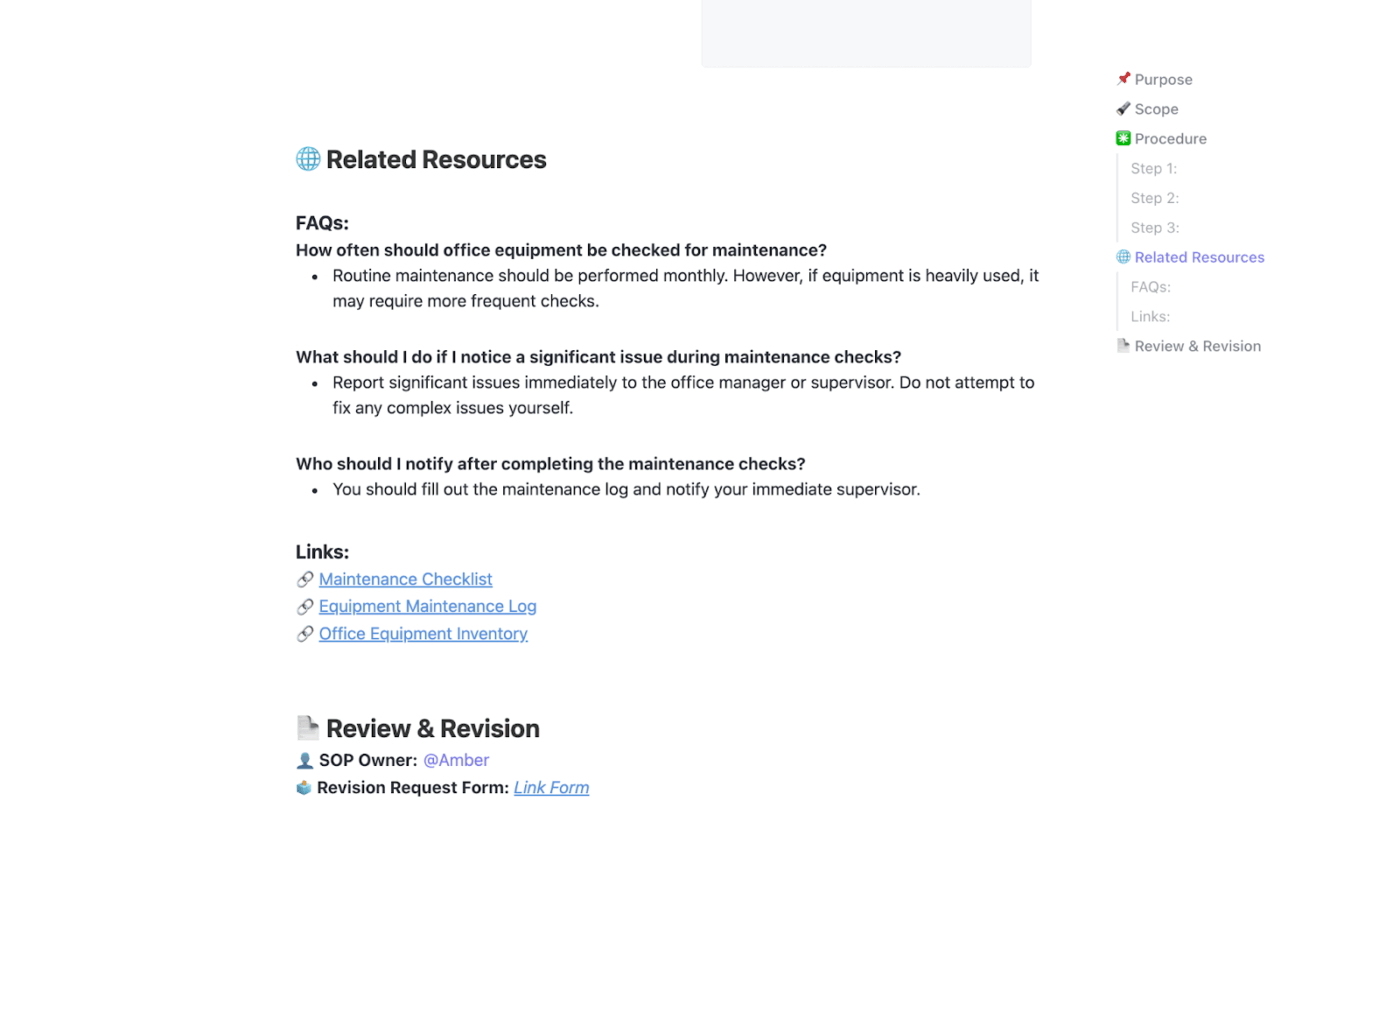
You can also eliminate the chaos of scattered information by centralizing all related materials in one place. For example, house your vendor management policies, onboarding guides, or cancellation procedures in ClickUp Docs.
Use ClickUp Docs as your single source of truth for vendor and subscription management
Then, link those Docs directly to your subscription tasks. Now, when it’s time to review a tool, the contract, usage policy, and renewal history are all connected, ending the frustrating search for information across different apps.
Gain real-time visibility with ClickUp Dashboards
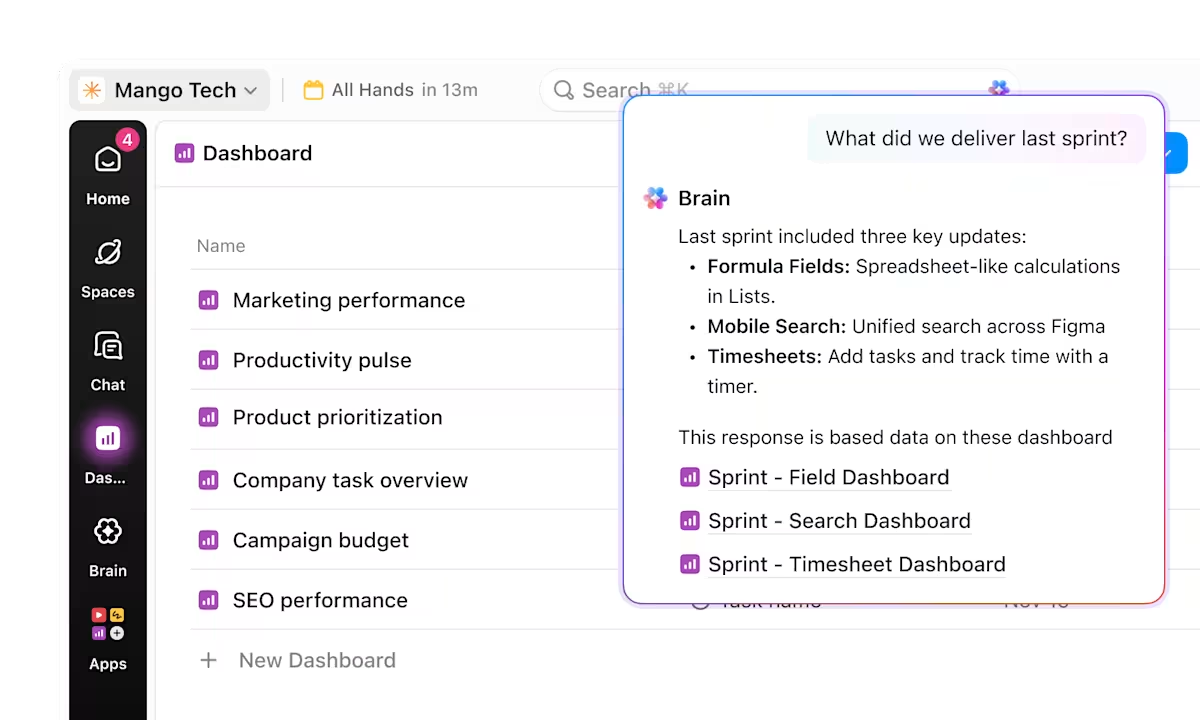
While pivot tables are useful, they aren’t real-time or easily shareable with leadership. ClickUp Dashboards pull your subscription data into high-level visual reports that refresh automatically.
Visualize complex data with ClickUp Dashboards and ask ClickUp Brain to make sense of it for you
You can build charts to view total spend by category or to see all upcoming renewals on a timeline, giving you a clear picture of your cash flow without any manual formatting.
💡 Pro Tip: If you want to move beyond charts and get direct answers about your expenses, add an AI Card to your Dashboard. Use the AI Brain card to run custom prompts in natural language, such as asking for a summary of spending spikes over the last quarter. It’s like having a financial analyst embedded directly in your reporting view.
Consolidate 20+ apps with the ClickUp Business Accelerator
Managing dozens of disconnected apps leads to Work Sprawl, a cycle of friction and fragmented information that costs organizations almost 30% of their annual revenue.
The ClickUp Accelerator breaks this cycle by converging your entire stack into a single, unified workspace. It gives you a Converged AI Workspace where every project, document, and conversation lives together with complete context.
In the context of your subscription strategy, this acceleration helps you:
Consolidate fragmented workflows into one platform to eliminate redundant tool costs
Deploy department-specific AI solutions in days to replace expensive, niche legacy software
Automate routine vendor management tasks to reduce manual administrative hours
Achieve cross-departmental visibility to spot and cut overlapping service subscriptions
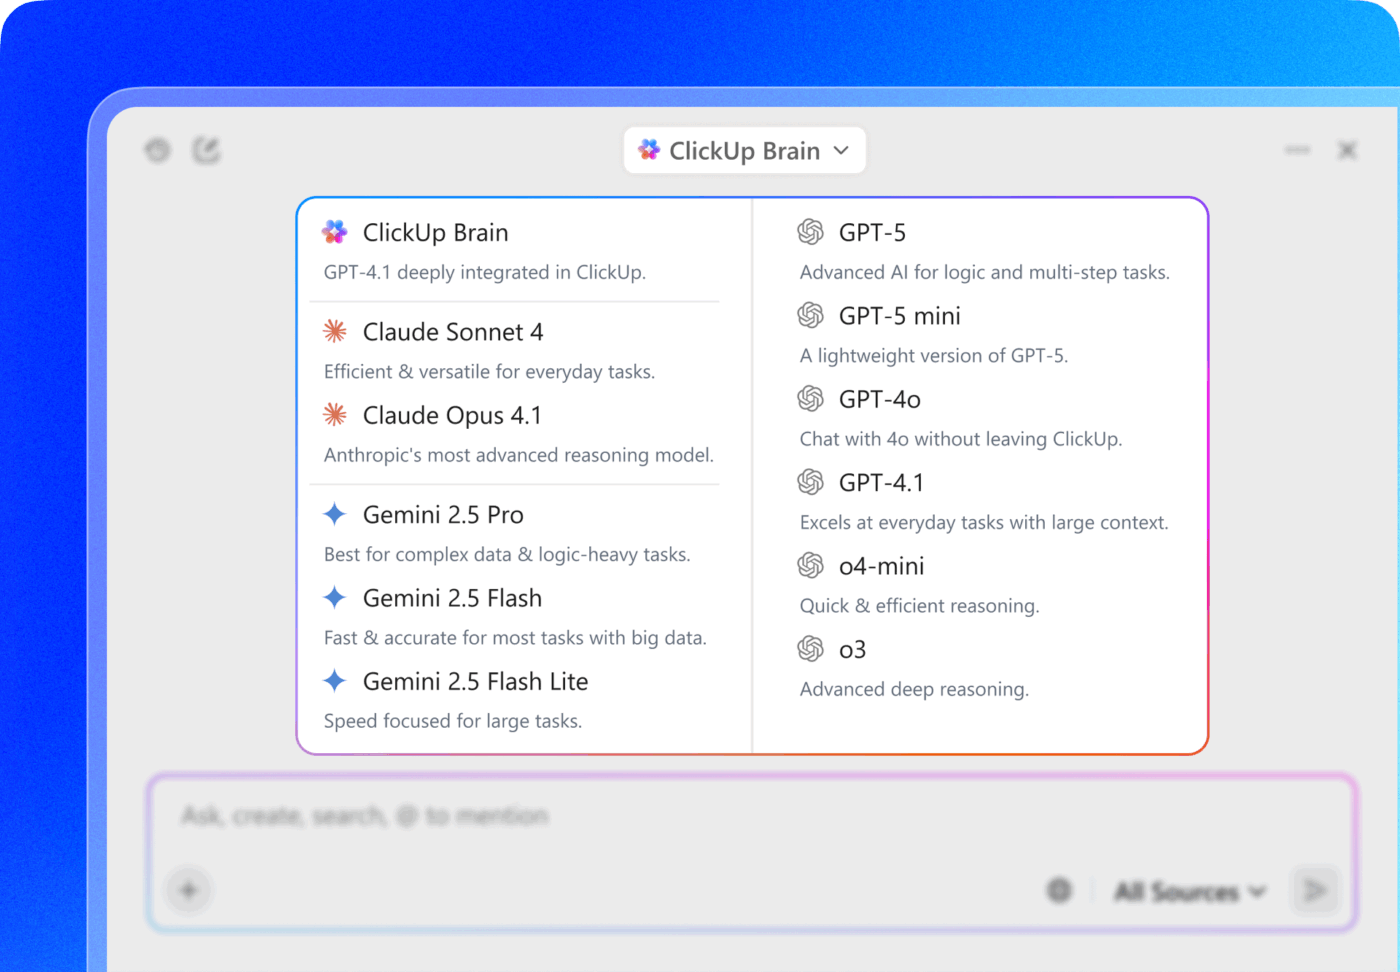
You can also use ClickUp Brain to defeat AI Sprawl. Rather than managing subscriptions for multiple disconnected LLMs, you can use this context-aware AI to access them in one place. This allows you to consolidate your AI stack, reducing your overall subscription footprint while maintaining full context across your projects.
Use multiple LLMs from a single interface with ClickUp Brain
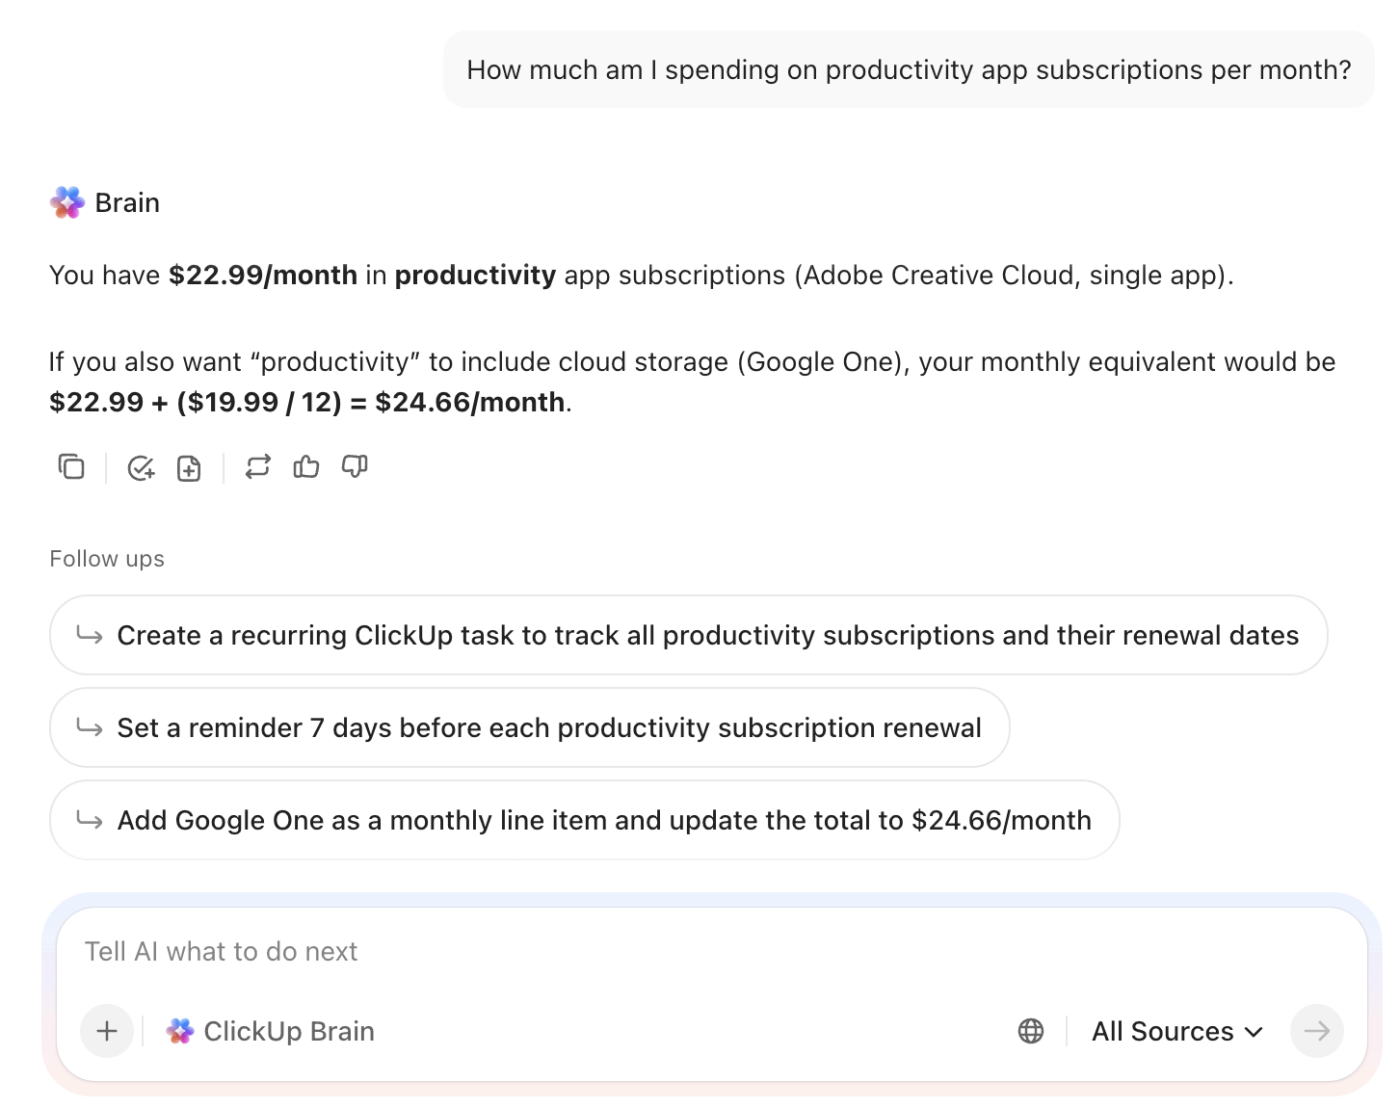
Plus, Brain can act as your personal financial advisor and track subscriptions, renewals, and reminders for you. Feed it your subscription expenditure data. Use it to plan your budget and manage subscriptions in natural language.
This unified access extends beyond your AI models and into your actual data through Enterprise Search. It allows you to find information across all your connected apps—like Google Drive, Slack, and Salesforce—from one place.
Instead of jumping between tabs to find a specific invoice or contract detail, you can also ask ClickUp Brain to locate it instantly. It indexes your content frequently, so your answers are always up to the minute.
💡 Pro Tip: If your team wants to move beyond simple automation, try ClickUp Super Agents. These are autonomous AI teammates that operate within your workspace to handle complex, repetitive processes. You can assign a Super Agent to monitor your recurring invoices, or task it with tracking vendor communication to identify when a contract is due for renegotiation.
Because these agents possess long-term memory and 24/7 ambient awareness, they can independently manage the administrative legwork of subscription reviews, freeing your team from the manual oversight usually required to keep costs in check.
🎥 Learn more about them here:
Summarize this article with AI
ClickUp Brain not only saves you precious time by instantly summarizing articles, it also leverages AI to connect your tasks, docs, people, and more, streamlining your workflow like never before.
Summarize this article for me please
Taking Control of Your Tech Stack
Building a consistent review habit is the only way to prevent subscription creep from draining your budget. Whether you start with a simple Google Sheets tracker or move straight into an automated workspace, the goal is the same: total visibility into where your money is going.
If the latter option sounds more convincing and you want to move beyond manual updates to manage your subscriptions with automated workflows, try ClickUp for free!
Summarize this article with AI
ClickUp Brain not only saves you precious time by instantly summarizing articles, it also leverages AI to connect your tasks, docs, people, and more, streamlining your workflow like never before.
Summarize this article for me please
Frequently Asked Questions (FAQs)
Can I share a Google Sheets subscription tracker with my team?
Yes, you can share a Google Sheets tracker by clicking the “Share” button and adding collaborators via email. You can set their permissions to view, comment, or edit.
What are the limitations of tracking subscriptions in Google Sheets?
The main limitations are the manual data entry, lack of automatic renewal reminders, and no direct sync with bank accounts. For teams, this can lead to version control issues and a lack of accountability.
How is a subscription tracker different from an expense tracker?
A subscription tracker focuses only on recurring payments and their renewal cycles. An expense tracker is broader, logging all types of spending, including both one-time and recurring charges.
What’s the best way to track subscriptions for a whole department or company?
For departments or companies, it’s best to use a tool with built-in automation, approval workflows, and centralized dashboards. This ensures that nothing gets missed and there is a clear record of all subscription-related activities.
Everything you need to stay organized and get work done.