
These words perfectly encapsulate the struggle many teams face while planning their workload. Without a clear timeline, even the best ideas crumble—deadlines slip, focus diminishes, and progress stalls. But there’s a way to avoid this.
All of us could benefit from a visual tool that brings clarity and structure—a way to see the complete picture of project tasks.
That’s where Gantt charts come in handy! They provide a dynamic visual plan for managing assignments and goals, helping you stay in control.
With Smartsheet, bringing these charts to life is easy. Its spreadsheet-like interface simplifies planning, tracking, and reporting, ensuring your operation runs smoothly.
In this article, we’ll learn how to create a Gantt chart in Smartsheet. We’ll also explore whether it suits your evolving needs and suggest better Smartsheet alternatives.
How to Create a Gantt Chart in Smartsheet (And Unlock a More Powerful Workflow Solution)
What is a Gantt Chart?
A Gantt chart is a visual planning tool for managing and scheduling activities over a set period. Each item appears as a bar along a timeframe, showing when it starts, how long it will take, and how it connects to other activities.
Here’s why they’re so effective:
- Comprehensive visibility: Get a quick, bird’s-eye view of your project timeline. Spot conflicts, resource overlaps, or gaps before they derail your work
- Task dependencies: Track which activities rely on others to avoid bottlenecks and maintain a smooth workflow
- Resource management: Maximize your time and resources. See who’s working on what, and ensure no one is overloaded or underutilized
- Team alignment: Keep everyone on the same page. Share your Gantt chart timeline to keep your unit synced on deadlines and responsibilities
Gantt charts are essential for project managers in every industry because of their simplicity and efficiency.
Now that you know what makes them so powerful, let’s explore how to create a Gantt chart.
💡 Pro Tip: Gantt charts aren’t just for managers. CEOs, HR leaders, consultants, and marketing pros use them to gain quick insights into schedules. Need inspiration? Check out these Gantt chart examples to see how different teams leverage this versatile tool.
How to Make a Smartsheet Gantt Chart: A Step-by-Step Guide
Building a Gantt chart in Smartsheet is simple, but attention to detail is essential for achieving a clear, functional, and valuable outcome. Follow these steps to keep your projects on schedule and aligned with your goals.
Step 1: Log in to your account and set up a new sheet
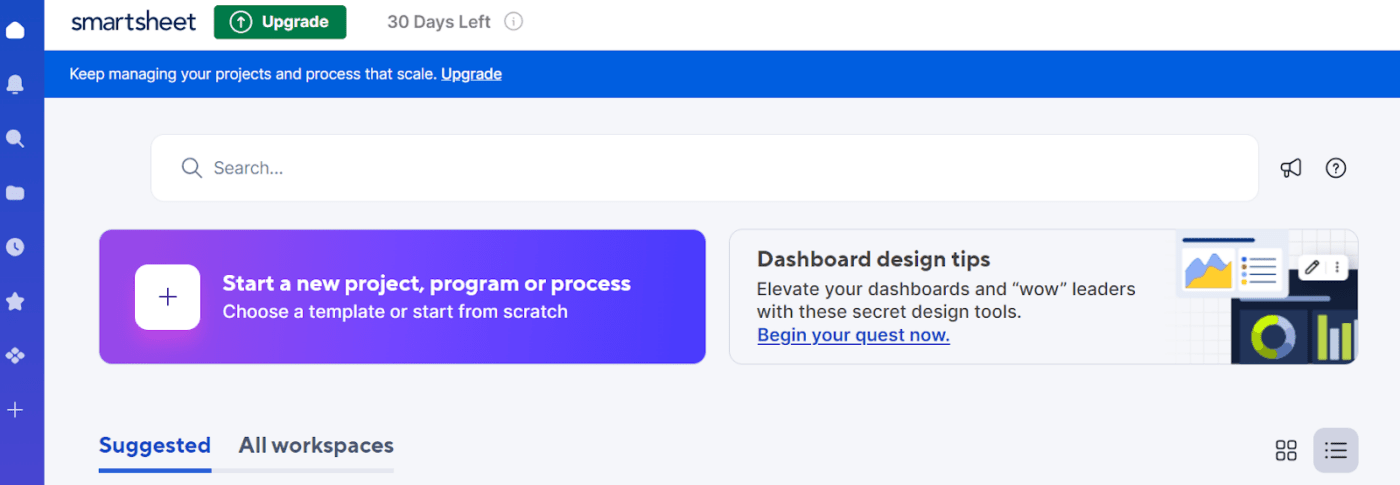
Start by logging into your Smartsheet account—or creating one if you’re new to the platform.
Once on the dashboard, click the ‘+’ button to launch a new project, process, or program.
You’ll see two options: ‘Select a pre-built template’ or ‘Start from scratch’. While templates offer structured setups, the other option gives you the most flexibility for building a custom Gantt chart.
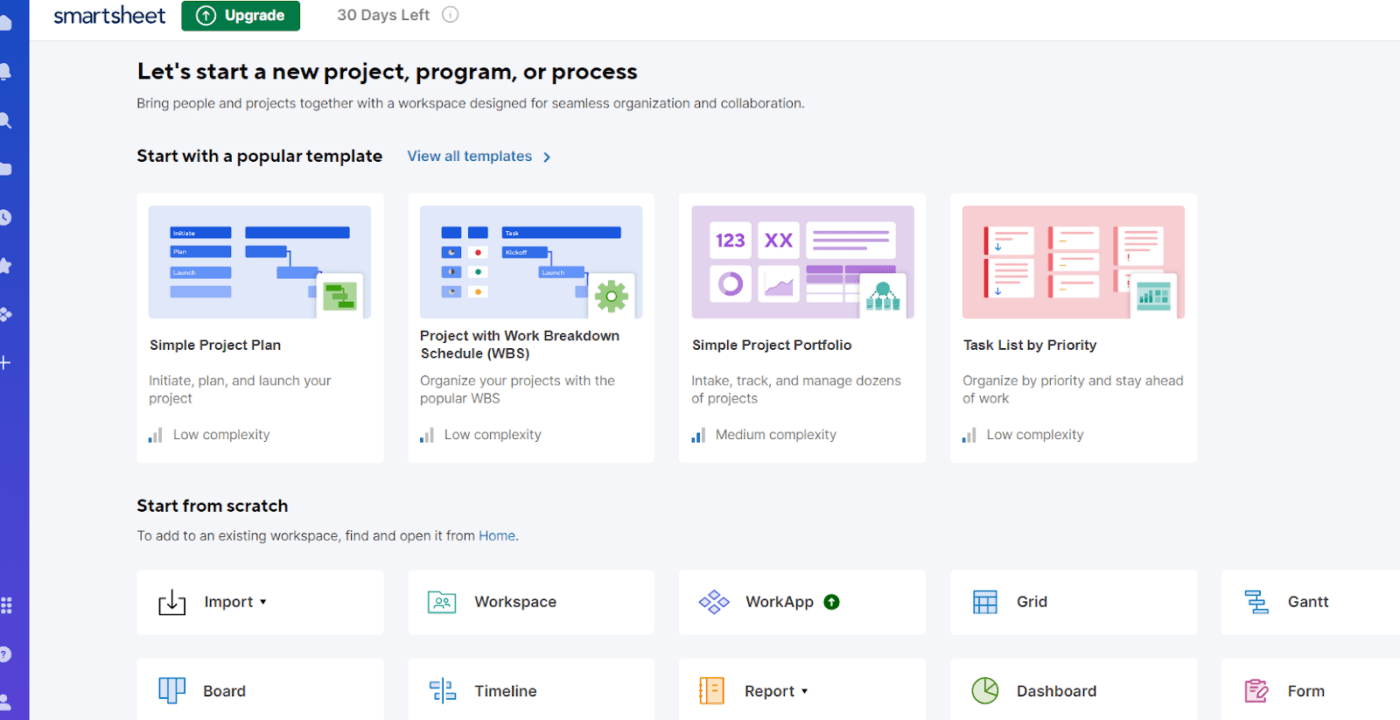
Then, simply select ‘Gantt’ to get started.
At this point, you’ll have the entire layout needed to start. Begin by naming your projects and filling in the fields related to your work items. It will set the foundation for your timeline and structure.
Step 2: Populate your sheet with key data
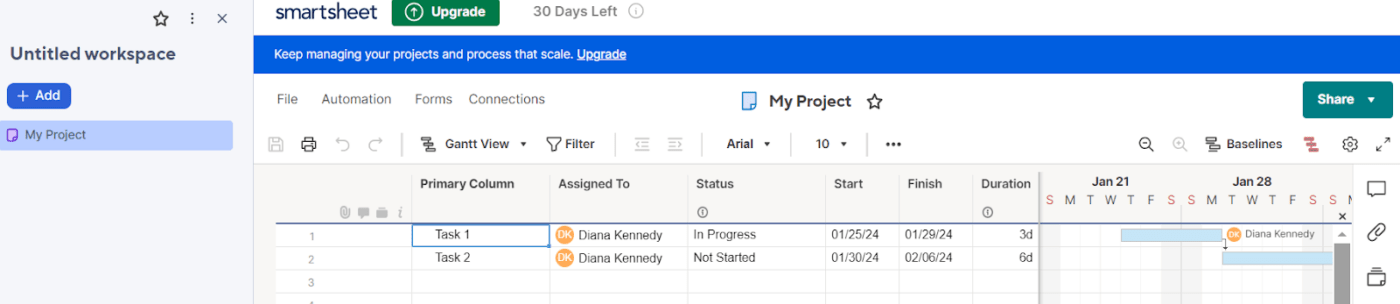
Once you create your sheet, populate your chart with essential details to ensure clarity from the start:
- Outline tasks: List all the milestones and targets in the ‘Primary’ column. Be clear and specific to avoid confusion later
- Assign durations: Enter each item’s ‘Start Date’ and ‘End Date.’ Smartsheet will calculate work durations based on these dates, ensuring consistency
- Define roles: Use the ‘Assigned To’ section to delegate duties to project members. This way, you’ll easily access who is responsible for each task
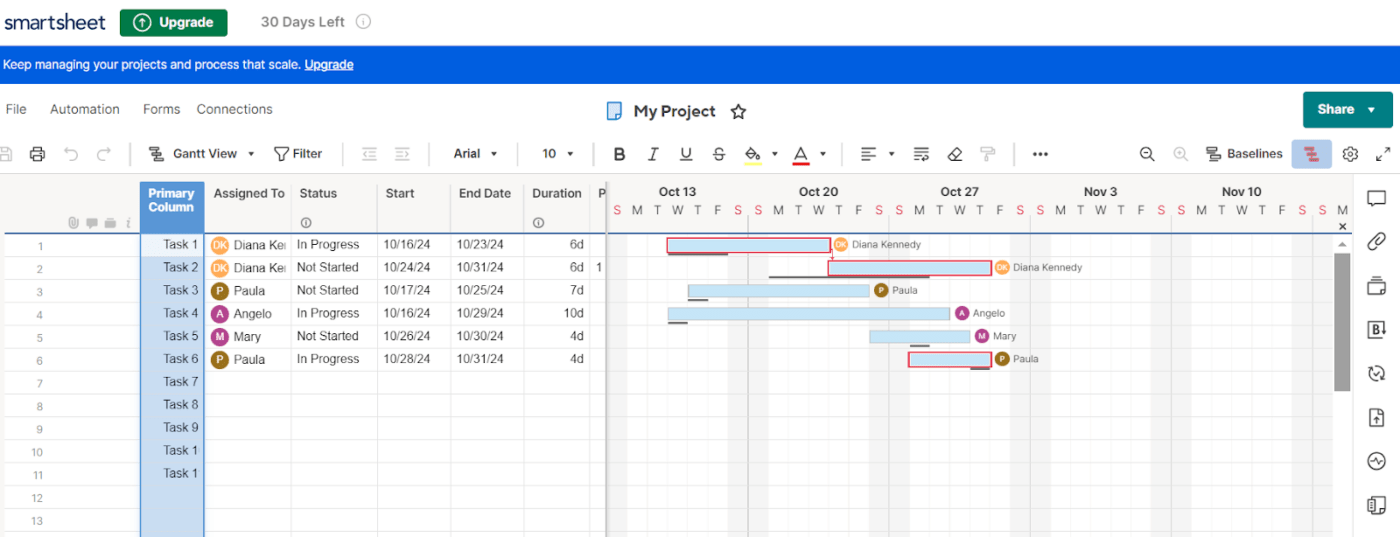
Plus, since you selected ‘Gantt’ in the first step, Smartsheet automatically converts your sheet into a Gantt chart. This chart displays work items as rows of horizontal bars across a timeline.
Step 3. Establish and edit dependencies
Dependencies are crucial for understanding which deliverables rely on others for fulfillment.
Here’s how to set them up:
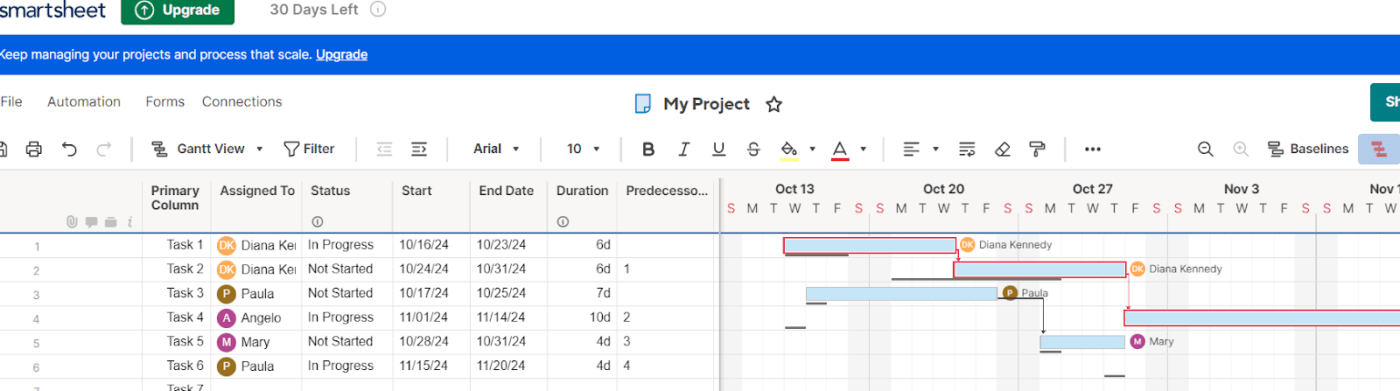
- Click on your sheet’s ‘Predecessors’ column
- Enter the row number of the activity your workforce needs to complete first. For example, if Job 2 relies on Job 1, you’ll enter ‘1’ in the Predecessors column for the second task
- Set up baselines to track the variance between your plan vs. actual date
Leverage the ‘critical path’ feature to highlight essential activities that impact your timeline. Any changes will automatically modify the driving path, with priorities highlighted in red on your Gantt chart
Afterward, Smartsheet visually links the tasks, showing how each impacts the others.
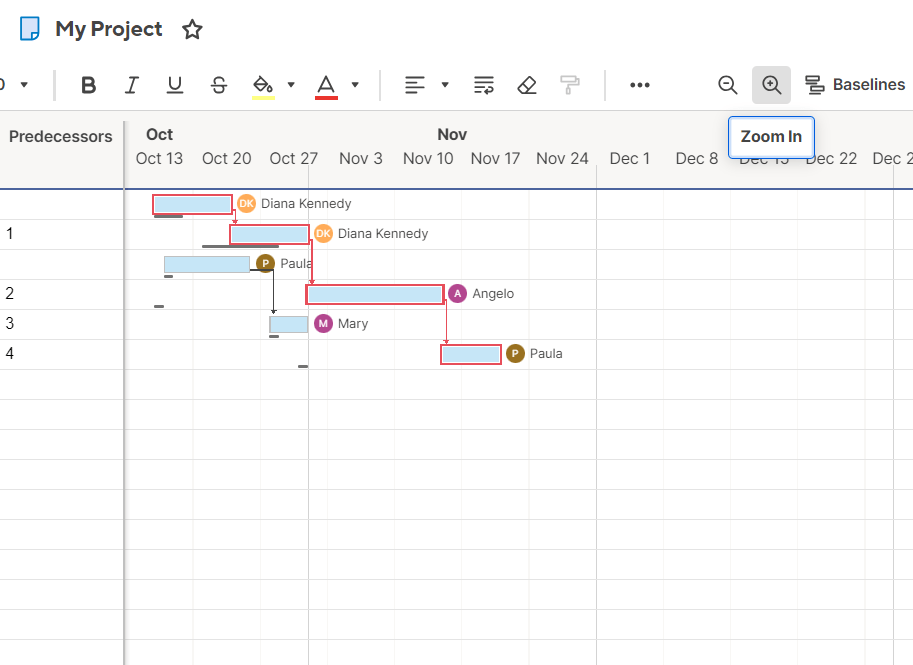
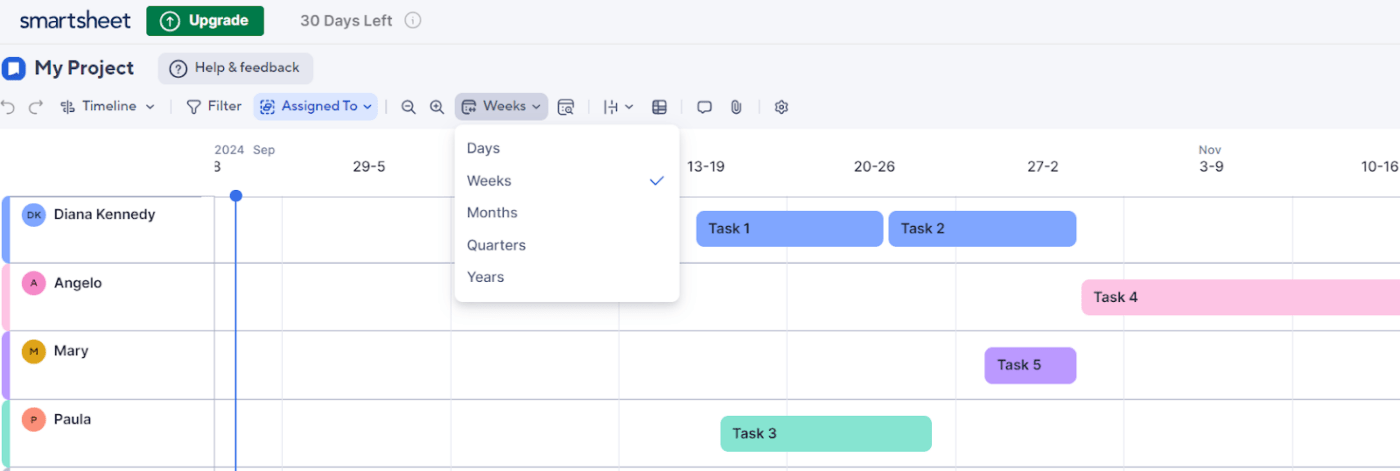
Use the zoom-in or zoom-out feature to view your work by day, week, or month. Adjust the scale based on the length or duration to make the chart more manageable.
Step 4. Customize your Gantt chart
After populating your Gantt chart, it’s time to tailor it to your project’s specific requirements.
Smartsheet offers many basic customization options to enhance your chart’s clarity.
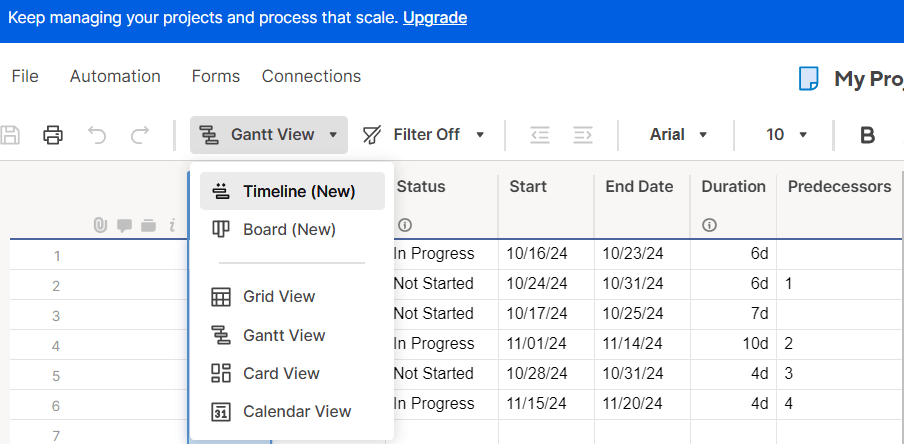
- Use the ‘Timeline’ display to adjust the view (day, week, month, or year) based on your schedule’s scale
- Add color codes to categorize items by status or priority. This visual aid makes it easy to see what’s on track and what needs attention
- Mark critical milestones directly on the chart to keep everyone aligned with dates or events
- Adjust task bars—styles or labels—to personalize your chart and improve readability
Step 5: Track progress and adjust as needed
Once your Gantt chart is up and running, Smartsheet makes monitoring project growth and development easy.
- Change duration, start date, end date, and dependencies as needed to reflect changes in the visual timeline
- Track completion percentages to see what’s on schedule, getting an accurate representation at all times
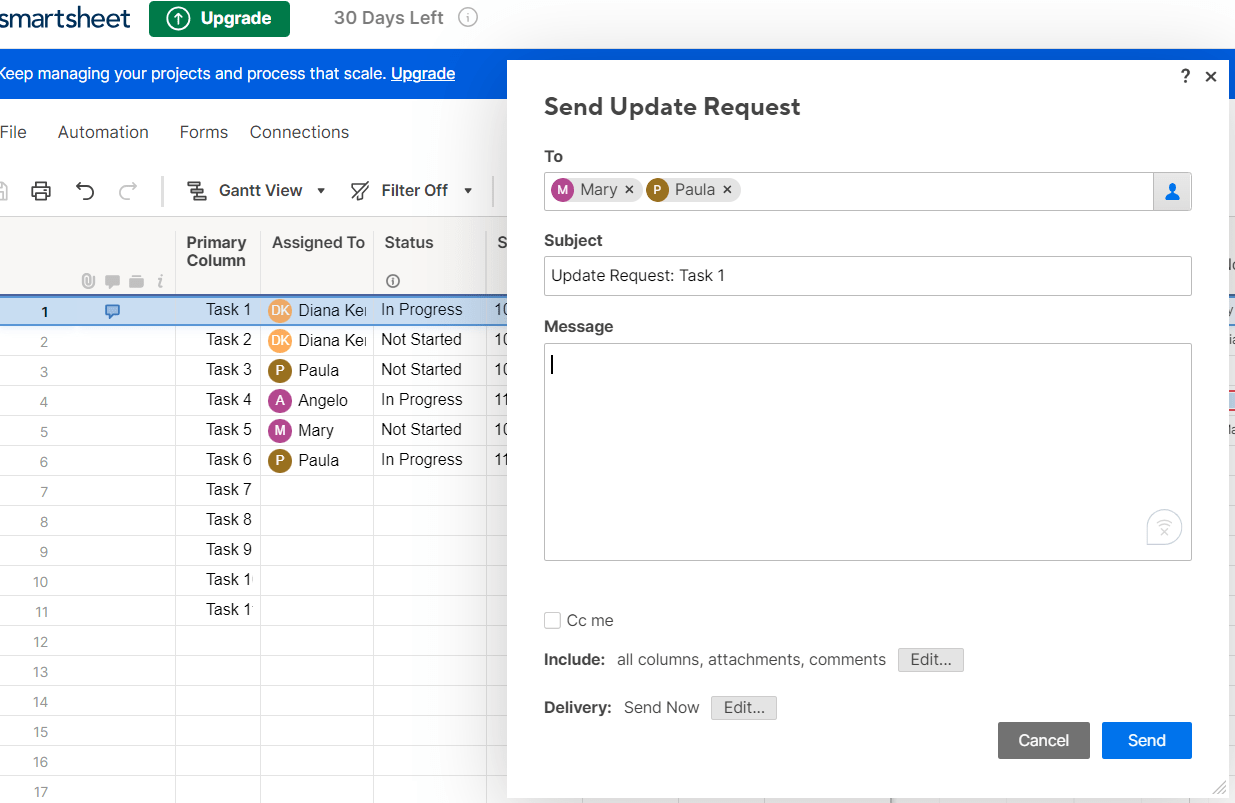
You can also send ‘update requests’ directly from Smartsheet, prompting your team to provide the latest situation on specific deliverables. These requests allow collaborators, including external stakeholders, to modify key rows without navigating or accessing the entire sheet.
Step 6: Share your Gantt chart with stakeholders
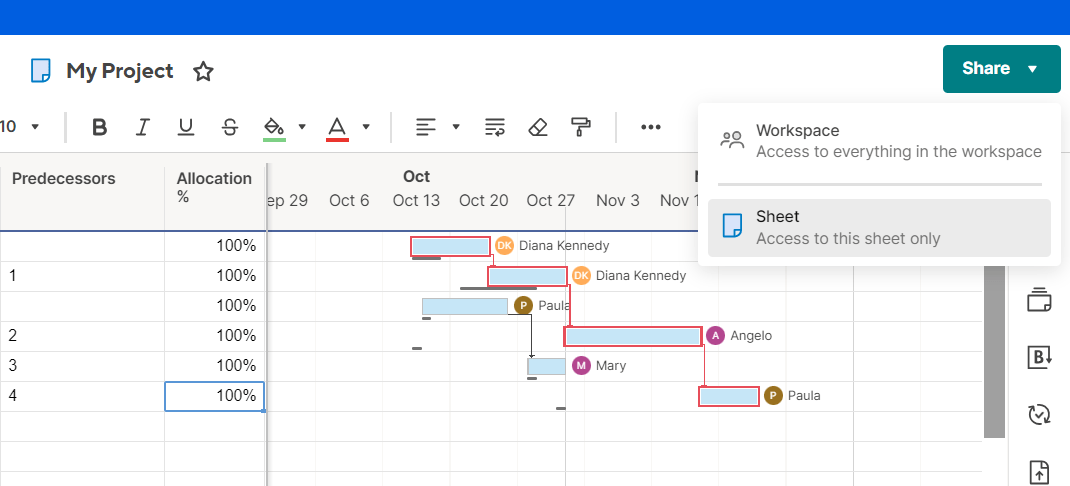
The final step is keeping your teams informed, which is crucial for your initiative’s success. Smartsheet makes this simple through the ‘Share‘ button on the screen’s right panel.
- Choose whether to give stakeholders view-only access or editing rights based on their involvement
- Set up notifications for any changes or delays, reducing miscommunication and meeting deadlines
Limitations of Creating a Gantt Chart in Smartsheet
Smartsheet is a solid tool for Gantt charts, but it does have its share of challenges, especially for larger, more complex projects.
Here are some common roadblocks users face:
Customization constraints
Smartsheet’s straightforward design is great for simplicity. However, the platform might feel restrictive when your work plan has intricate layers of work duties or dependencies.
Suppose you’re managing a large app revamp project with multiple moving parts. Smartsheet’s customization options may need more flexibility to map your work’s scope or tailor the chart to your needs.
Basic automation features
Smartsheet’s automation works for basic processes but doesn’t scale well for complex workflows. For example, if you manage a product launch involving several approval stages, this tool’s limited automation forces you into manual mode too often.
When your teams rely on real-time triggers and custom workflows, these manual touchpoints cause unnecessary delays. They slow things down, turning what should be an automated process into a time-consuming task.
Collaboration isn’t seamless
Smartsheet does not offer a built-in chat feature or real-time commenting, so your teams must use emails for communications. Think about working with global teams on a marketing campaign. Updates get lost in inboxes without efficient collaboration tools, leading to confusion and delays.
Manual reporting slows you down
Do you need to generate detailed reports? Smartsheet requires you to do most of it manually, which could be a serious time drain. The lack of automated insights makes tracking project advancement and responding quickly to changes harder. This issue impacts decision-making when fast updates are essential.
No built-in time tracking
Project time management is crucial for boosting productivity and optimizing resource allocation. Unfortunately, Smartsheet doesn’t offer a built-in time-tracking feature.
Without this, project managers struggle to monitor how collaborators spend their time on tasks or track billable hours. As a result, managing workloads becomes more complicated, and performance reviews are less precise.
Costs add up quickly
Smartsheet’s pricing can become steep, especially without a free plan. The Business plan costs $24 per user monthly, with a minimum of three users. That’s at least $96 per month to get started.
Also, features like advanced reporting and enterprise-grade security are not available with these tiers. So, if you need those, you’ll have to pay even higher costs with the Enterprise plan, making it a less economical choice for many businesses.
Reddit Reviews
Understanding genuine user experiences is essential before you start using the tool. We checked out Reddit discussions to get a sense of how users feel about Smartsheet, and here’s what we found: One user voiced concerns about its security and pricing:
Another user raised many functionalities issues:
But what if your projects require more flexibility, deeper automation, or seamless real-time collaboration?
Let’s look at how ClickUp addresses these pain points and offers even more!
🎯Also Read: How to Create a Gantt Chart in Confluence
Create Effortless Gantt Charts with ClickUp: The Best Smartsheets Alternative
ClickUp is a dynamic, all-in-one project management platform that makes the most complex workflows feel manageable. With tools covering everything from activity tracking to goal setting, it’s a game-changer for teams of any size.
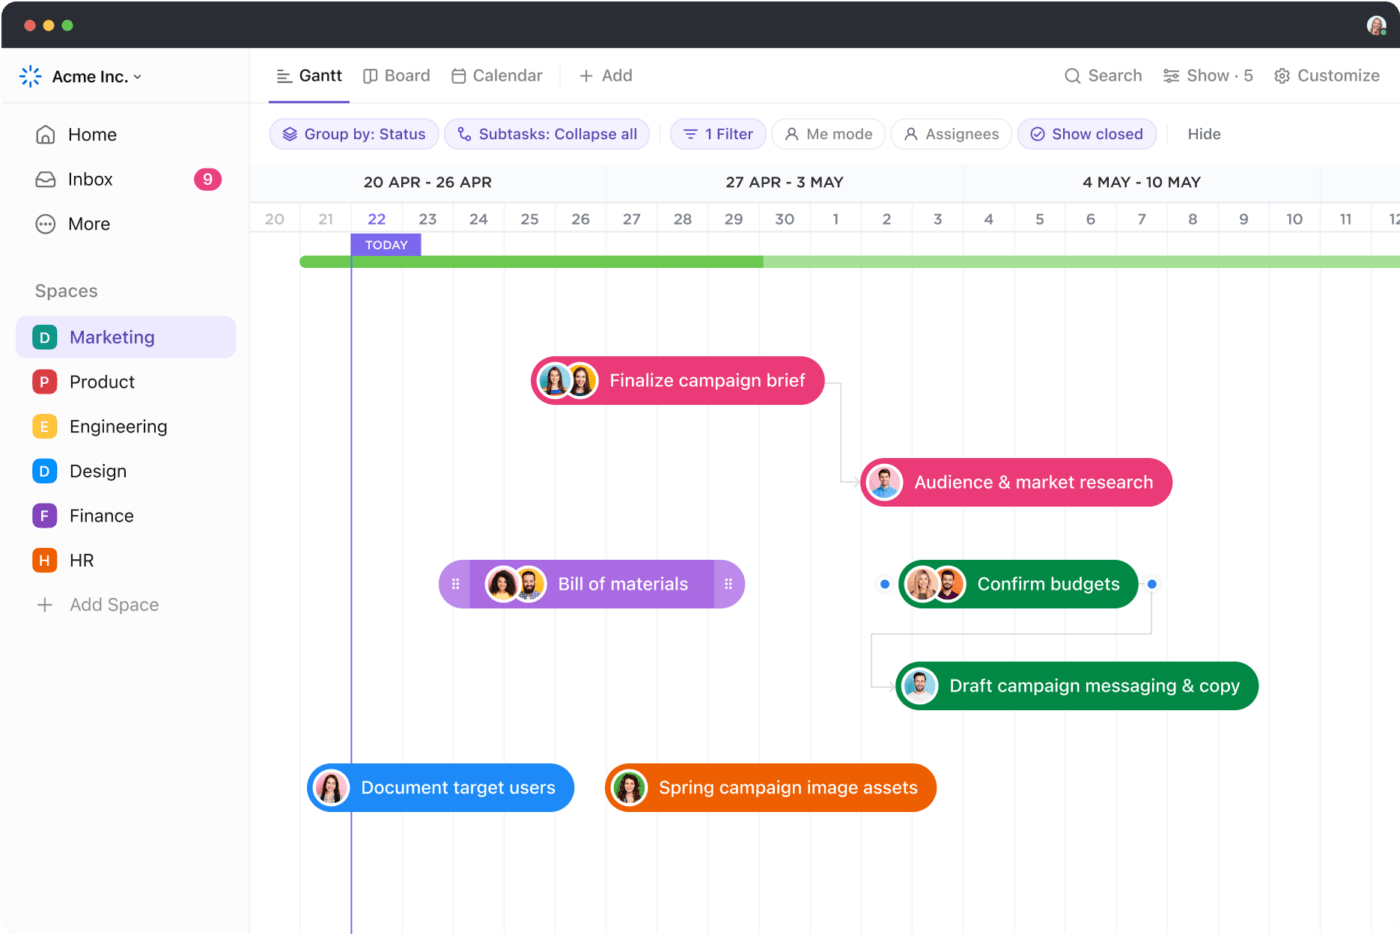
Among its many versatile features, ClickUp Gantt Charts View stands out for obvious reasons. Think of visualizing deadlines, streamlined dependencies, and trackable workflows—all in real time.
These words highlight that ClickUp doesn’t just fill Smartsheet’s gaps—it redefines successful project management. With ClickUp’s Gantt View, you unlock powerful customization, advanced automation, and real-time visual tracking that keeps every project moving smoothly.
Here’s how:
1. Gain unmatched customization freedom
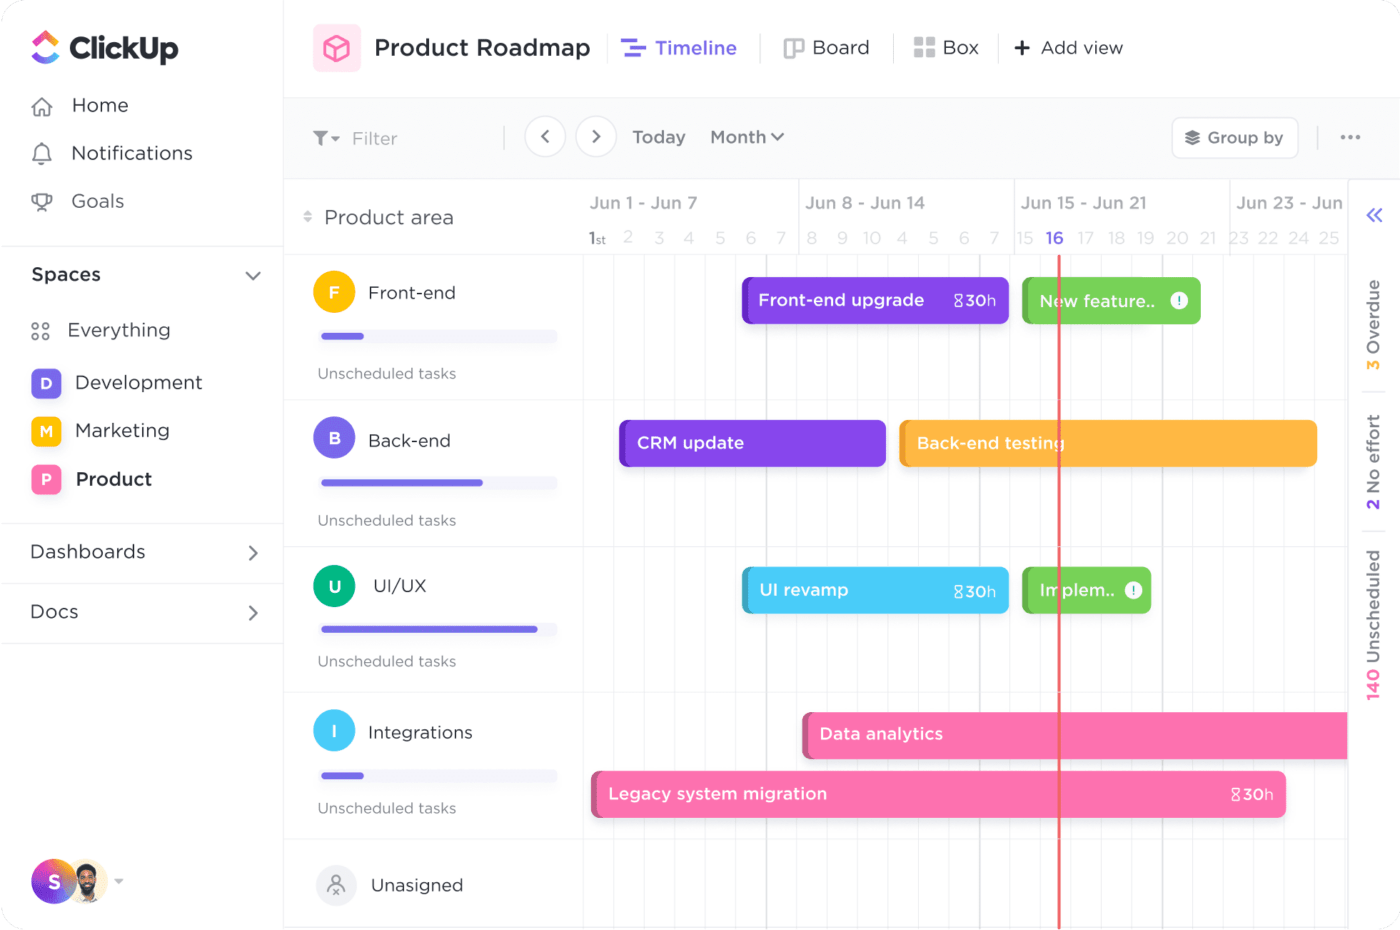
ClickUp breaks away from Smartsheet’s rigid design, allowing you to customize your Gantt charts to fit your unique needs. This adaptability makes managing complex workflows more intuitive.
For example, a product development team working on a software release can use ClickUp’s Gantt View to ensure alignment across every phase—from back-end design to front-end deployment.
Right-click any column header to access the “Project Settings” tab and modify aspects like start date or task duration. The flexibility allows you to fine-tune your project for better control quickly. Here’s how:
- Drag-and-drop timelines: Adjust schedules effortlessly—just drag the taskbar, and it automatically updates everything
- Advanced hierarchy: Organize projects into multiple sub-levels for extensive control
- Automated flows: Simplify repetitive actions like allocating tasks or updating statuses, reducing manual effort and minimizing errors
- Custom color-coding: Tailor the layout to your needs—whether by deadline, team columns, or project phase. Assign distinct colors for easy navigation and a streamlined experience
💡 Pro Tip: Take your Gantt chart to the next level by linking your task interdependencies to workloads. This visual connection shows how different elements align with major events, helping you anticipate delays and keep everything on track. Check out the image below to see it in action!
2. Seamless automation for maximum efficiency
While Smartsheet requires manual updates, ClickUp’s Automations runs your workflow on autopilot, freeing you from routine tasks.
Set triggers that activate when specific conditions are met, like updating statuses or sending notifications when one phase is complete. Once a job or stage finishes, the next one kicks off automatically—ensuring no delays and minimizing errors.
ClickUp also offers a library of pre-built Gantt chart project templates to simplify busywork and boost productivity.
ClickUp Simple Gantt Template
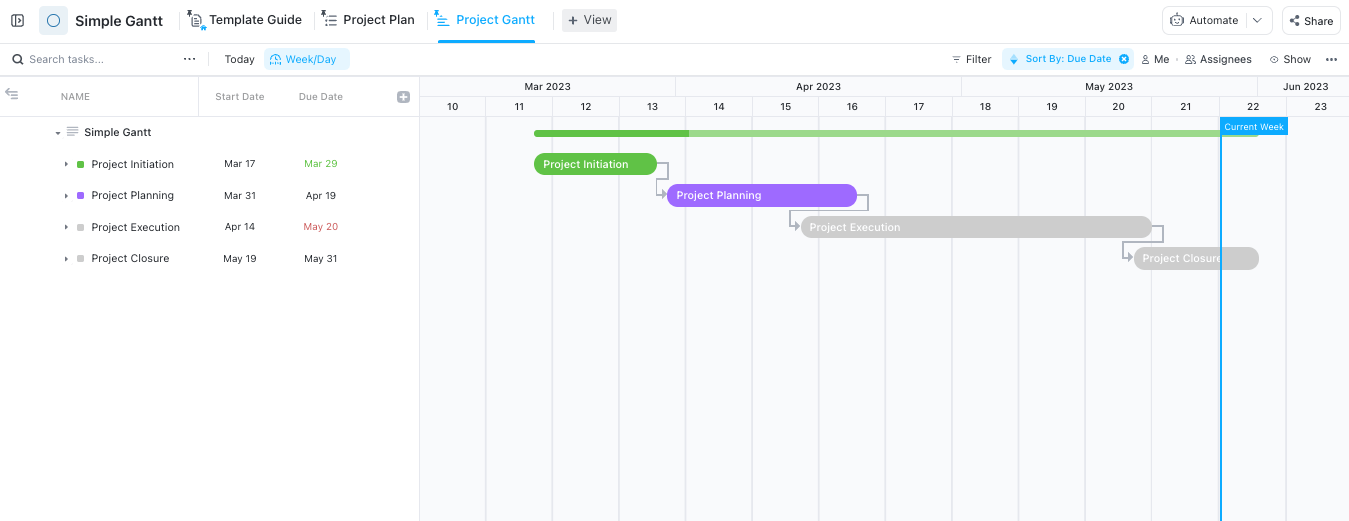
Need a quick yet exhaustive visualization framework? The ClickUp Simple Gantt Template offers a perfect solution. Its built-in dependencies let you instantly review task relationships, and keep your project moving forward effortlessly.
Here are some key features of this template:
- Organize activities using custom taskbars to display if they are open, in progress, or complete
- Gain a high-level overview of your project’s health with a color-coded snapshot of each phase
- Streamline task reassignment and timeline adjustments for smooth, uninterrupted workflow
- Use a parent task to build a clear, organized summary path for sublevels and their dependency management
Ideal for: Perfect for managing large workflows like software launches, product development, or hybrid operations—anywhere you need real-time tracking without micromanagement.
3. Leverage seamless collaboration
Miscommunication and delayed updates can disrupt project growth, mainly when information is scattered across emails and platforms. ClickUp’s Gantt view resolves this issue by embedding real-time collaboration directly without leaving the visual timeline.
- Use @Mentions to tag collaborators directly on individual cells to notify them about relevant changes
- Add comments, feedback, and even attachments right on the row itself, keeping all discussions in context
- Collaborate without switching between tools—everything happens in one place, leading to faster decisions and smoother workflows
4. Harness the power of robust analytics

ClickUp Dashboards seamlessly integrate with Gantt charts, offering a tailored view of essential metrics such as budgets, goals, and level updates. The critical path and slack time features highlight crucial tasks and potential delays, helping you avoid bottlenecks.
Organize your data with individual cells for a structured, hierarchical overview. Parent rows automatically summarize the work of related child rows, providing a comprehensive, top-down view of your projects while ensuring no detail is missed.
In addition, ClickUp’s built-in time tracking feature lets you monitor productivity and billable hours. You can track time directly on tasks, create timesheet reports, and optimize resource allocation for maximum efficiency.
But that’s not it—ClickUp is one of the best free Gantt chart software available in the market today. Unlike Smartsheet, ClickUp’s Free Forever plan gives you unlimited users plus 60 Gantt uses. Need more? Paid plans unlock unlimited views for complete flexibility.
💡 Pro Tip: Do you love how ClickUp’s Gantt Views simplify workflow and dependency management? Watch our quick video tutorial and discover how to master these powerful features with ease! It’s the ultimate visual guide to running your projects like a pro.
Supercharge Your Project Timelines with ClickUp
Gantt charts are essential for keeping timeframes and interdependencies in check. But when it’s Smartsheet vs. ClickUp, the difference is undeniable—ClickUp delivers a more dynamic and powerful toolkit for managing workflows.
While Smartsheet works well for smaller projects, ClickUp shines with complex, large-scale operations. With advanced automation, real-time collaboration, and full customization, it becomes your ultimate weapon for seamless project management.
Why settle for basic features when you can access a fully customizable, real-time platform?
Get started with ClickUp today and experience the difference for yourself!


Everything you need to stay organized and get work done.

Recent Articles
Bear Vs. Evernote: 2026 Review (Features, Pricing) 
Bear Vs. Evernote: 2026 Review (Features, Pricing)
