


Still downloading templates?
There’s an easier way. Try a free AI Agent in ClickUp that actually does the work for you—set up in minutes, save hours every week.
Sorry, there were no results found for “”
Sorry, there were no results found for “”
Sorry, there were no results found for “”
Profitability analysis only works when you’re looking at the right numbers in the right context. A pricing decision needs a different lens than a budget review. A break-even calculation answers a different question than a project margin check. That’s why one generic spreadsheet usually falls short.
This guide walks you through 10 free profitability analysis templates built in ClickUp, each designed to help your team answer a specific financial question, from break-even analysis and cost-benefit evaluation to pricing strategy and project profitability. Instead of rebuilding reports from scratch every time, you can use the right template for the job and make decisions with more clarity.
Knowing you need to track profitability is one thing; having the right framework is another. A single, generic spreadsheet rarely works because analyzing a new product launch requires a different lens than reviewing the financial health of an entire department. Using the wrong tool for the job can give you misleading insights, while building a new report for every question wastes valuable time.
The templates below are designed to solve this. Each one tackles a different angle of profitability, from high-level financial reporting to granular cost breakdowns. They’re all built inside ClickUp, which means you can stop juggling disconnected spreadsheets and bring your financial analysis into the same place you manage your work. You can customize fields, automate calculations, and collaborate with your team in real time.
Your leadership team just asked for a financial overview of the last quarter, and you’re stuck piecing together data from 10 different spreadsheets—a common challenge when 40% of CFOs don’t completely trust their organization’s financial data. The numbers don’t match, formulas are broken, and you’re spending hours on manual data entry instead of actual analysis. This frantic, last-minute scramble means your reports are often surface-level and prone to errors, undermining your credibility.
Eliminate the reporting fire drill with the Financial Analysis Report Template. This template is your go-to for creating a comprehensive financial snapshot. It consolidates revenue, expenses, and key profitability metrics into a single, clean report view that’s perfect for leadership presentations or investor updates.
Stop wrestling with spreadsheet formulas. Instead, use ClickUp Custom Fields to track your most important financial KPIs. You can create specific fields for revenue, cost of goods sold, and operating expenses. Then, use ClickUp Formula Fields to automatically calculate gross margin and operating income in real time. Now, your financial data lives alongside your work, always up-to-date.
You’re excited to launch a new product, but there’s a nagging question: how many do you actually need to sell to make a profit? Guessing your sales targets is risky—price it too low, and you could lose money on every sale; price it too high, and you might not get any customers at all. Without a clear break-even point, you’re essentially launching blind.
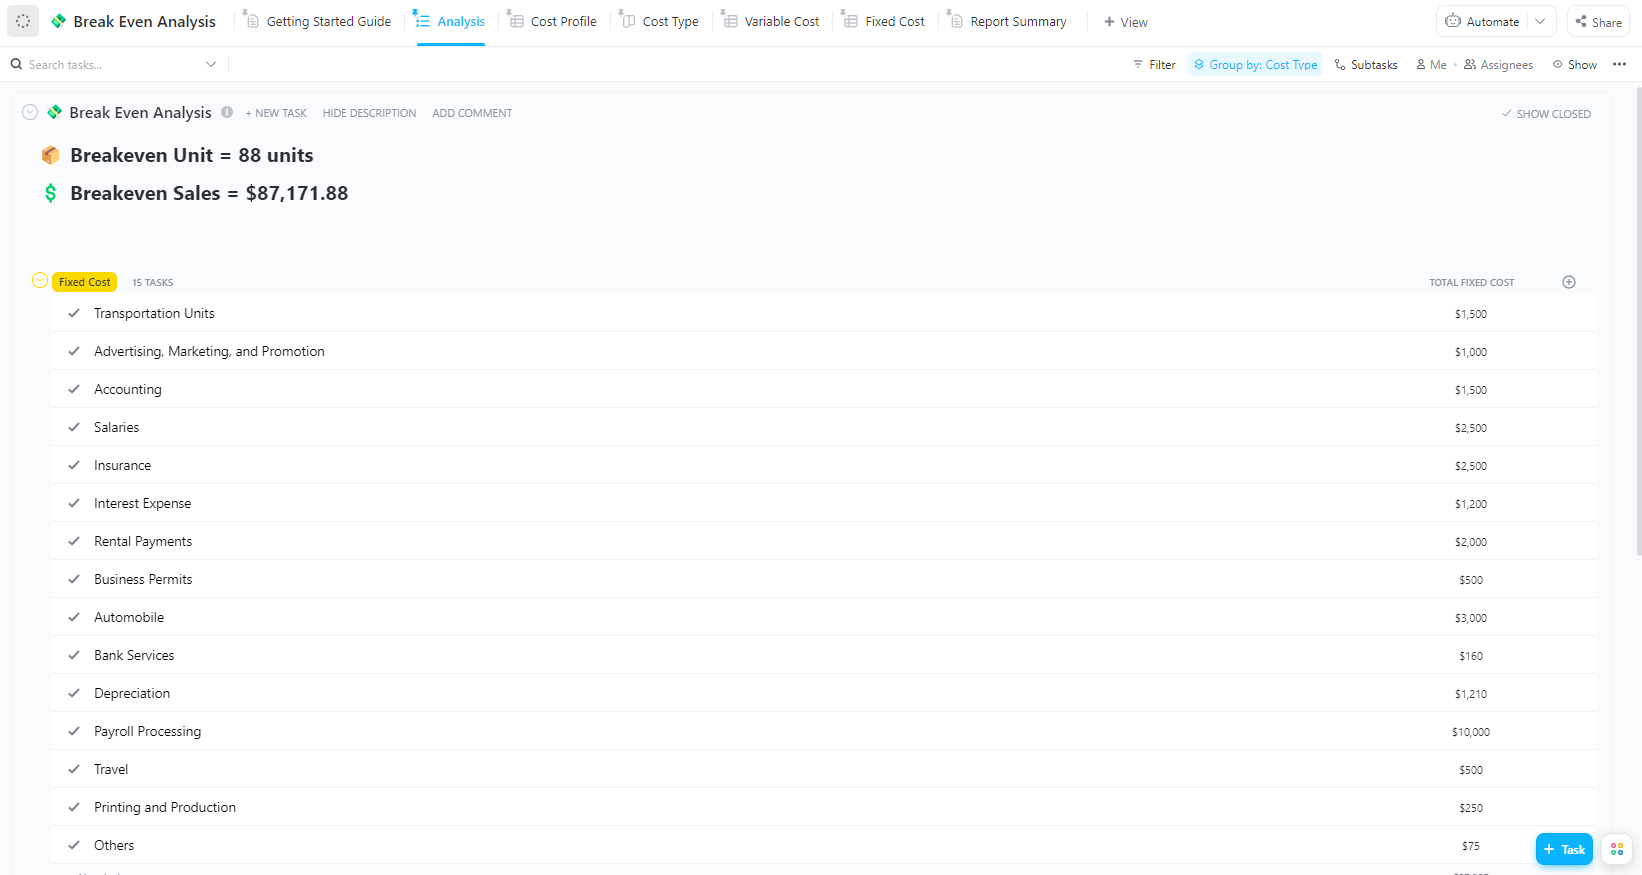
Remove the guesswork with the Break-Even Analysis Template by ClickUp. Break-even analysis is the calculation that shows you the exact point where your total revenue equals your total costs. It’s the moment you stop losing money and start earning a profit. This template structures all the necessary components—fixed costs, variable costs per unit, and selling price—to automatically calculate the sales volume you need to hit.
The best part? It’s dynamic. As you adjust your inputs, like negotiating a better price for raw materials or considering a promotional discount, ClickUp Formula Fields instantly update your break-even point. This allows you to model different scenarios on the fly without ever having to rebuild your spreadsheet. This template is perfect for product teams planning a launch, finance teams evaluating a new service line, or any department making a critical pricing decision.
Your company is growing, but your profits aren’t keeping pace. You have a sneaking suspicion that costs are creeping up, but you have no easy way to see where the money is actually going. Expense reports are vague, and project budgets live in separate, disconnected files, making it impossible to get a clear, consolidated view of spending. This lack of visibility means you can’t spot inefficiencies or make smart cuts.
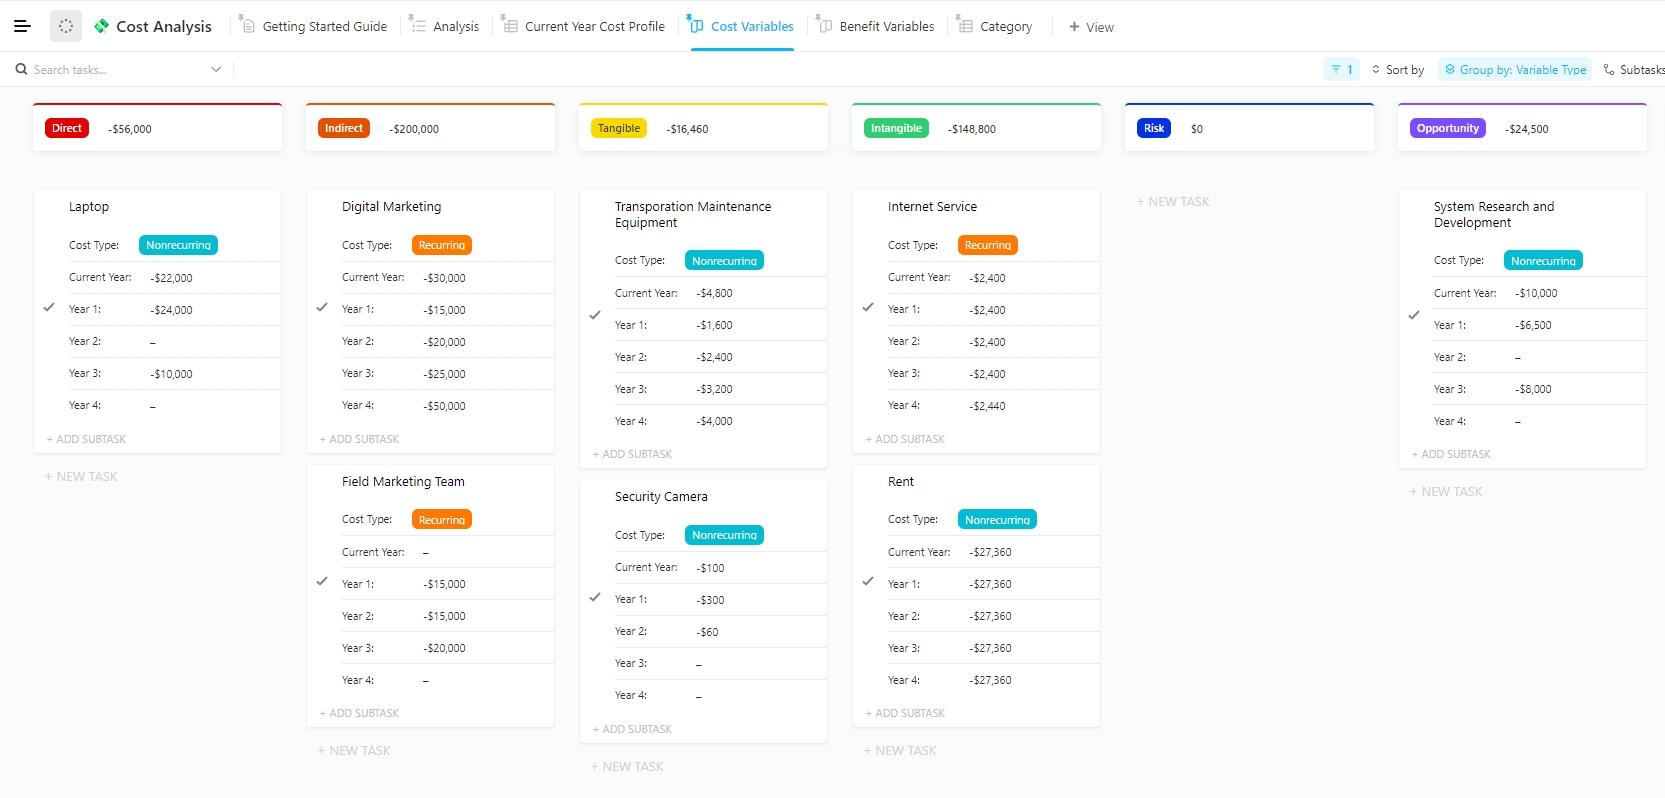
Get the granular detail you need with the Cost Analysis Template by ClickUp. This template is designed for teams that need to dissect their spending. It helps you categorize every cost not just by type—like labor, materials, or software—but also by the project or department responsible. This gives operations and finance teams managing multiple cost centers total visibility into spending patterns.
Stop losing cost data in endless email threads and disconnected tasks. With ClickUp, you can break down large projects into ClickUp Subtasks and track costs at each level. The platform’s hierarchical structure automatically rolls up these costs, so you can see the total spend for an entire project or department. You can even use ClickUp Brain to analyze your cost data, ask it to summarize spending trends, or flag anomalies you might have otherwise missed.
A new software investment is proposed, or a major process change is on the table. Everyone agrees it feels like a good idea, but you have no structured way to prove it. Without a formal cost-benefit analysis, decisions are made based on gut feelings, not data, and you risk investing in projects with a negative return on investment (ROI).
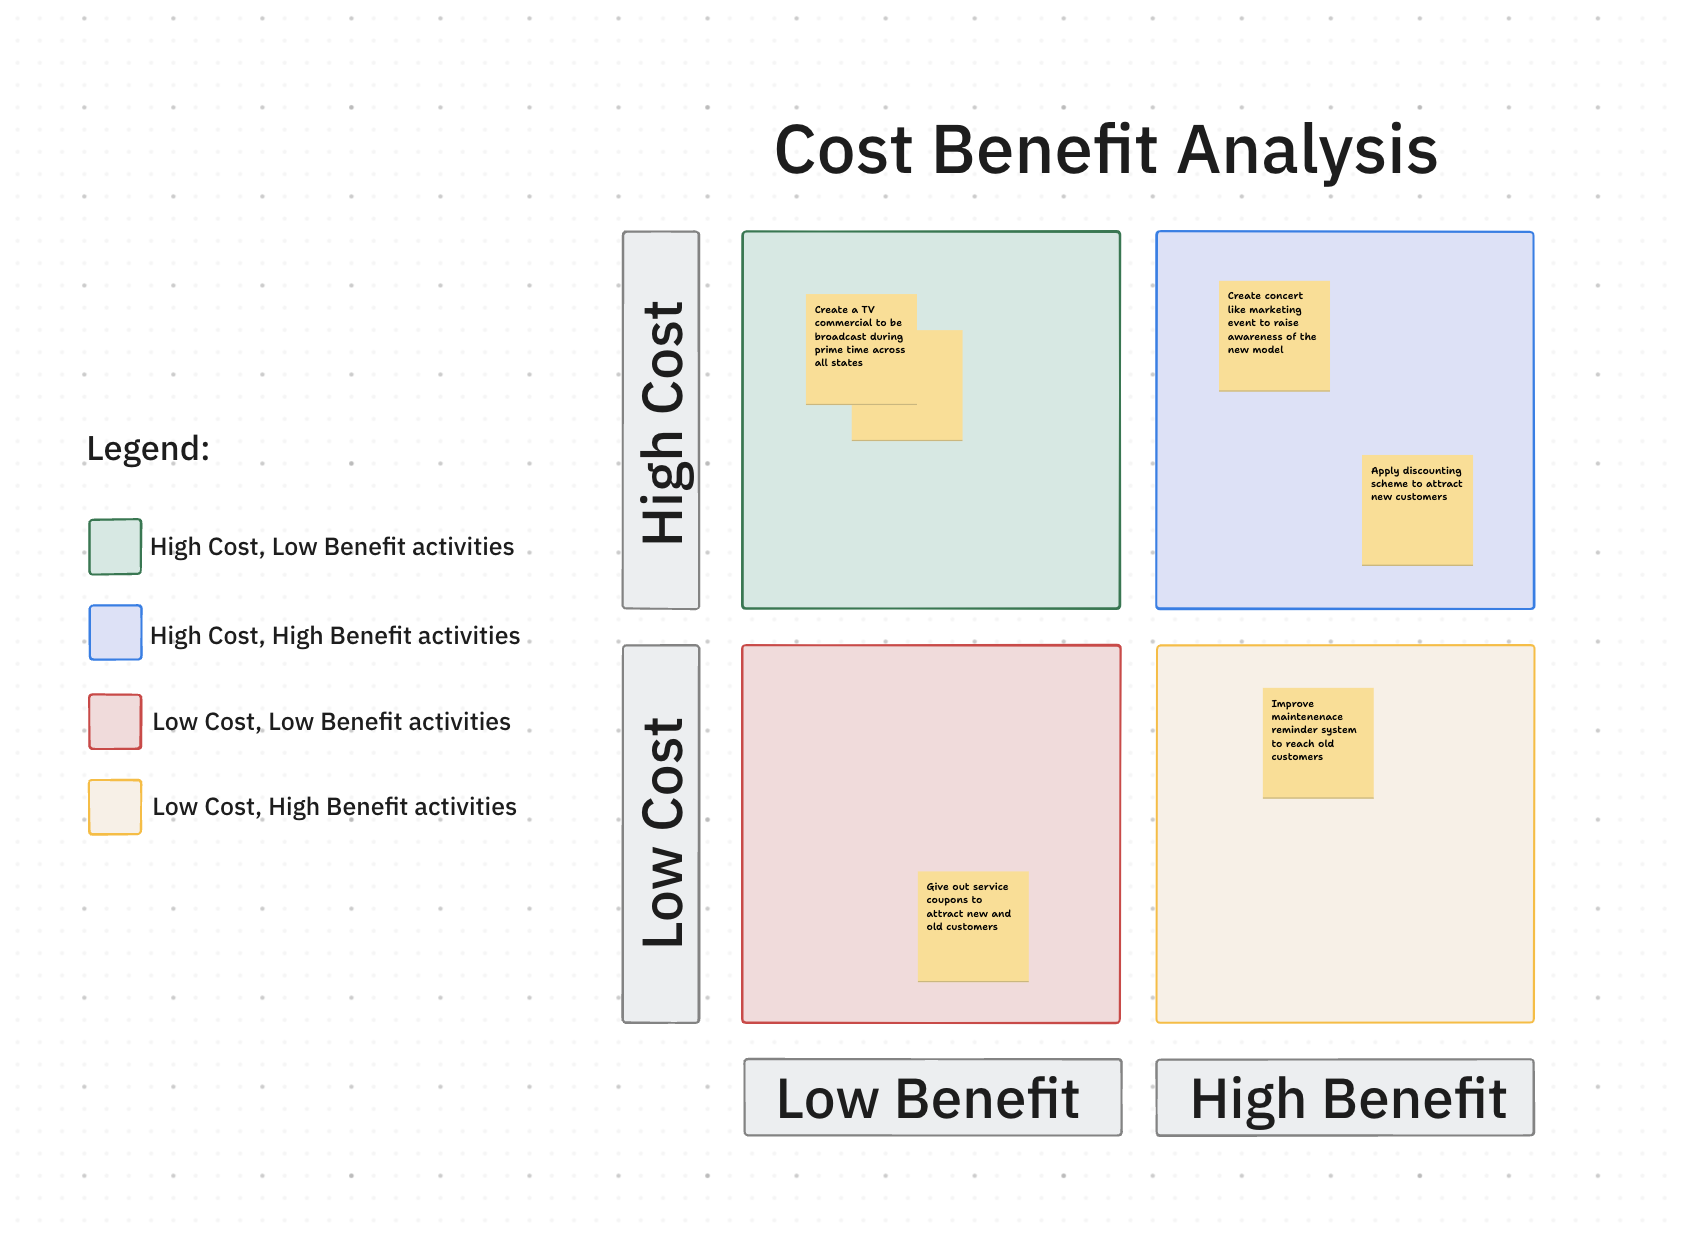
The Cost-Benefit Analysis Template by ClickUp provides the framework to make smarter, data-driven decisions. Before you approve any significant investment or initiative, you need to know if it’s actually worth it. This template helps you structure the projected costs against the expected benefits—including increased revenue, cost savings, and efficiency gains—to calculate the true net value of a proposal.
Some benefits are easy to measure, like a 10% reduction in material costs. Others are intangible, like improved employee morale. This template lets you capture both. Use ClickUp Custom Fields to quantify everything, with Number and Money Fields for tangible benefits and a ClickUp Rating Field for intangibles. This makes it the perfect tool for project proposals, capital expenditure requests, or evaluating any process improvement initiative.
As a project manager, you’re constantly being asked, “Are we on budget?” Answering that question involves digging through timesheets, vendor invoices, and expense reports—a manual and time-consuming process. By the time you’ve compiled the data, it’s already outdated, and you may have already gone over budget without realizing it.
The Project Cost Analysis Template by ClickUp is built specifically for project managers who need to track profitability in real time. It allows you to capture budgeted vs. actual costs for labor, materials, and subcontractors, all tied directly to specific project deliverables. This gives you an always-on view of your project’s financial health.
Stop chasing down labor hours. With ClickUp Time Tracking, your team can log time directly on their tasks. That data can then be used for project cost management to automatically calculate labor costs, separating billable from non-billable hours. You can even set up ClickUp Automations to get instant alerts when project costs exceed a certain threshold, so you can address budget issues before they spiral out of control. This template works well for agencies, consultancies, and any client-service team that needs to ensure projects stay profitable.
To see how project planning templates integrate with cost analysis and budget tracking in ClickUp, watch this walkthrough of ClickUp’s project planning capabilities:
You’re a product manager, and you need to know your true cost of goods sold (COGS). But your cost data is a mess—raw material prices are in one spreadsheet, labor costs are in another, and manufacturing overhead is a mystery number from finance. Without a clear understanding of your per-unit cost, you can’t set profitable prices or identify opportunities to improve production efficiency.
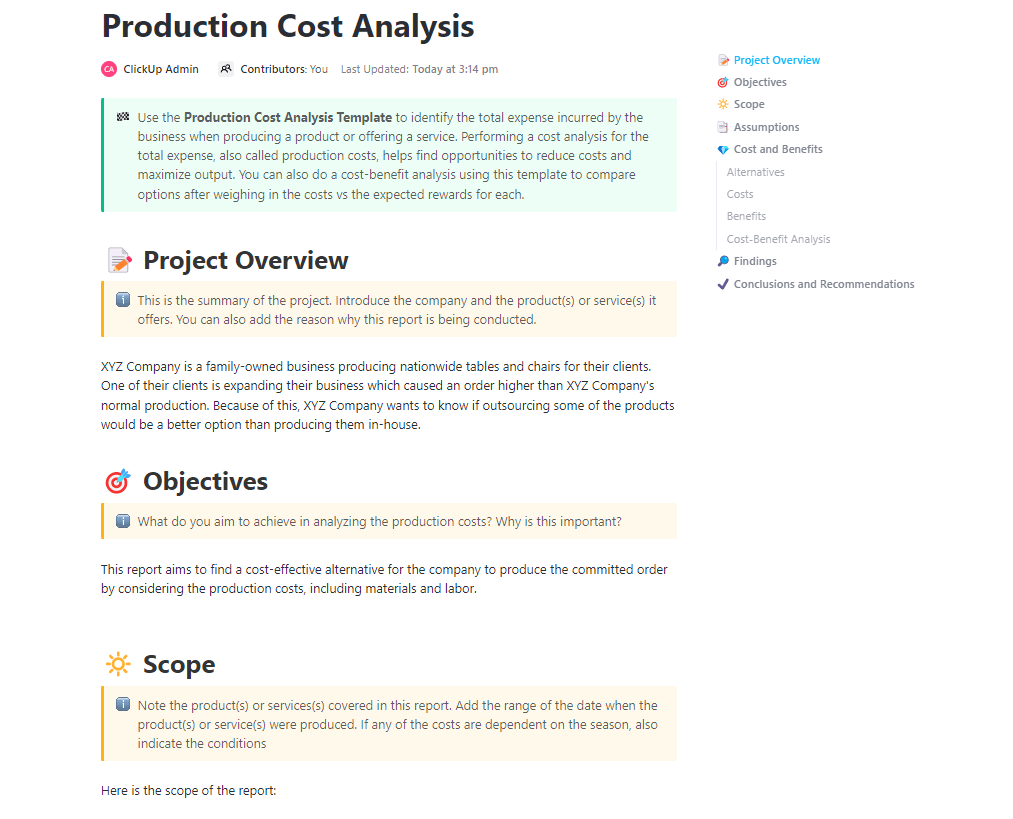
The Production Cost Analysis Template by ClickUp is designed for manufacturing and product teams who need to know the true cost to produce each item. This template breaks down every component of your production cost—raw materials, direct labor, and manufacturing overhead—on a per-unit or per-batch basis. This gives you the clarity you need to calculate accurate margins.
Connect your production workflow directly to your financial data. In ClickUp, you can create Tasks for each step of the production process and use Custom Fields to link them to your cost data. This gives you real-time visibility into your margins as products move through the assembly line. Use a List View or ClickUp Table View to see a summary of all your costs, and even calculate the total for any numeric column, giving you an instant COGS figure.
Setting the right price for your product feels like a black box. You know your costs, but you’re not sure how to translate them into a price that both covers expenses and delivers a healthy profit margin. You end up either guessing, which is risky, or spending hours in a spreadsheet trying to model different pricing scenarios.
The Product Pricing Template by ClickUp helps you set prices strategically, based on data, not guesswork. This template structures all the key inputs you need: your cost per unit, your desired profit margin, and competitive benchmarks. It then uses this information to recommend an optimal selling price.
The market is always changing, and so are your costs. This template is built to be dynamic. Thanks to ClickUp Formula Fields, your recommended price will automatically update as your underlying cost data changes. This makes it easy for product managers, e-commerce teams, and anyone launching a new product to test different pricing scenarios without having to manually rebuild their calculations each time.
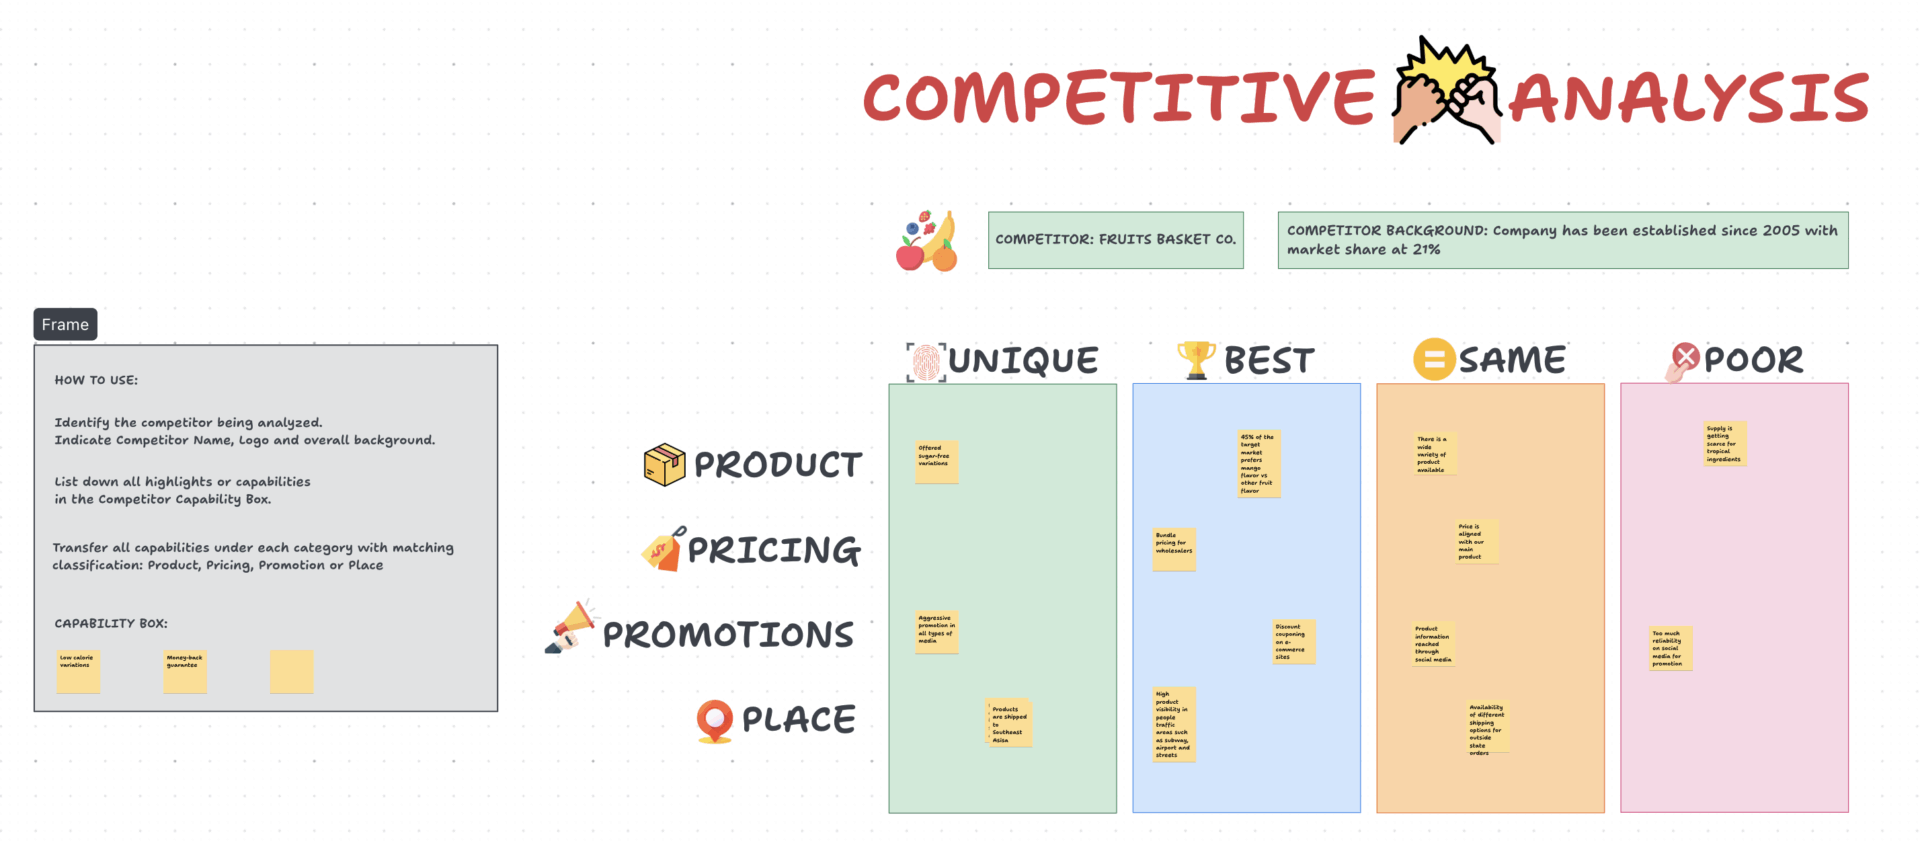
You know your product is great, but you’re not sure how it stacks up against the competition on price and features. Your team’s competitive research is scattered across random documents and bookmarks, making it impossible to see the full picture. This disorganization means you’re missing opportunities to highlight your unique value and position your product effectively in the market.
The Competitive Analysis Pricing Template by ClickUp helps you benchmark your product against the competition in a structured way. It provides a framework to capture competitor prices, features, and market positioning right alongside your own cost and margin data. This gives marketing, product, and strategy teams a clear, side-by-side view to evaluate market positioning and identify competitive gaps.
💡 Pro Tip: Stop letting valuable research get lost. With ClickUp Docs, you can embed your detailed competitor analysis, including screenshots and links, directly within the template. This keeps all your research connected to your pricing strategy. Use a Table View to create a powerful comparison matrix, displaying competitor data in a familiar, easy-to-scan spreadsheet format.
| Competitor | Price | Key Features | Your Price | Your Advantage |
|---|---|---|---|---|
| Competitor A | $99 | Basic features, limited support | $89 | More integrations, 24/7 support |
| Competitor B | $149 | Advanced reporting, enterprise-focused | $119 | Better value, more flexible for SMBs |
| Competitor C | $79 | No API access, limited user seats | $89 | Full feature set, unlimited users |
Profitability doesn’t just happen; it starts with a plan. But creating and managing a budget in a static spreadsheet is a recipe for frustration. Departments send in their numbers in different formats, tracking actual spending is a manual chore, and by the time you realize a project is over budget, it’s too late.
The Business Budget Template by ClickUp brings order to the chaos. This template provides a clear structure for your income projections and planned expenses, allowing you to track your budget vs. actual spending across different departments or projects. It helps you catch overspending before it becomes a major problem.
Get a live view of your company’s financial health. With ClickUp Dashboards, you can create a high-level overview of your budget. Use Calculation Cards to show total revenue, total expenses, and net income, all updated in real time as your team logs data. You can even use ClickUp Brain to analyze your budget, generate quick summaries for leadership, or identify patterns of overspending across the organization—joining the 85% of CFOs who expect AI tools to reduce manual analysis.
Your finance team is drowning in a sea of disconnected tools. You use one app for invoicing, another for expense tracking, and a dozen spreadsheets for budgeting and reporting—contributing to the problem where 30% of SaaS licenses go unused or underused. This tool sprawl creates data silos, forces constant context switching, and makes routine processes like the month-end close a painful, manual ordeal.
Consolidate your financial operations into a single workspace with the Finance Management Template by ClickUp. It’s designed to handle multiple financial workflows—including budgeting, expense tracking, invoicing, and profitability reporting—all within a single, unified workspace. This allows finance teams and small businesses to consolidate their financial operations and stop wasting time juggling different applications.
Adapt your workspace to any financial task. With ClickUp’s multiple views, you can see your data in whatever way makes the most sense. Use List View for a detailed, task-based approach to accounts payable, switch to ClickUp Board View for a visual way to track invoice statuses, and use Table View for quick, spreadsheet-style editing of your budget. You can also use ClickUp Automations to handle recurring financial tasks, like sending reminders for overdue invoices or creating a checklist for the monthly close process.
📮 ClickUp Insight: 1 in 4 employees uses four or more tools just to build context at work. A key detail might be buried in an email, expanded in a Slack thread, and documented in a separate tool, forcing teams to waste time hunting for information instead of getting work done. ClickUp converges your entire workflow into one unified platform. With features like ClickUp Email Project Management, ClickUp Chat, ClickUp Docs, and ClickUp Brain, everything stays connected, synced, and instantly accessible. Say goodbye to “work about work” and reclaim your productive time.
💫 Real Results: Teams are able to reclaim 5+ hours every week using ClickUp—that’s over 250 hours annually per person—by eliminating outdated knowledge management processes. Imagine what your team could create with an extra week of productivity every quarter!
Trying to understand your company’s profitability with scattered data is like trying to navigate with a torn map. Profitability analysis templates fix this by eliminating the chaos of disconnected spreadsheets and manual calculations. The templates we’ve shared cover every angle of financial analysis, from high-level overviews to granular cost breakdowns, so you can always find the right framework for your needs.
When your financial data lives in the same place as your work, your entire team gains clarity. You can spot margin leaks faster, make more confident decisions, and stop waiting for finance to run a report. A converged workspace eliminates context sprawl—the hours wasted searching for information across disconnected apps and platforms—and gives you clear, real-time insights.
Get started for free with ClickUp and start using these profitability analysis templates today.
A profitability analysis template is a flexible tool used to calculate margins and understand the drivers of profit for a specific project, product, or department. In contrast, an income statement template is a formal financial report that follows strict accounting standards to show a company’s total revenue, expenses, and net income over a specific period.
Absolutely. Product teams use these templates to evaluate the unit economics of their products and make pricing decisions, while operations teams use them to track cost efficiency across different processes or production lines. They are valuable for any team whose decisions impact the bottom line.
Most teams find it helpful to review their profitability analysis on a monthly basis to catch trends and address issues early. However, for project-based teams, it might make more sense to review at key project milestones or at the conclusion of the project./

© 2026 ClickUp

There’s an easier way. Try a free AI Agent in ClickUp that actually does the work for you—set up in minutes, save hours every week.