


Still downloading templates?
There’s an easier way. Try a free AI Agent in ClickUp that actually does the work for you—set up in minutes, save hours every week.
Sorry, there were no results found for “”
Sorry, there were no results found for “”
Sorry, there were no results found for “”
Have you ever struggled to understand a complex project plan, only to come across a diagram or visualization that suddenly made everything crystal clear?
It’s amazing how a clear picture quite literally paints a clearer picture, right?
A process map brings life and clarity to every function and even an organization’s vision. Guess what magnifies its impact? Process map symbols.
These fundamental elements take visual understanding to the next level, and the 9.84 billion dollar visualization tools industry nods in agreement.
This article is a comprehensive guide to process map symbols. We’ll explain what they are, provide specific and common process mapping symbols, and discuss the main types.
We’ll also cover a six-step guide to creating process maps and how ClickUp, a project management platform, can help you create one.
Process map symbols are visual elements used to represent the different steps, operations, and decisions within a process. They help illustrate how a process flows from start to finish.
The primary goal of process map symbols is to make complex procedures easier to understand and analyze. They are extensively used in business, engineering, and process management to indicate how information flows, is stored, and executed.
Now that you have a brief overview of process map symbols, here are the standard process mapping symbols based on their usage.
Here are the main symbols that indicate how data is processed and organized:
| Shape | Name | Function |
|---|---|---|
 | Collate symbol | Represents the merging of two or more data sets |
 | Sort symbol | Indicates the order data will arranged in |
For representing data storage, these are the process map symbols you need to use:
| Shape | Name | Function |
|---|---|---|
 | Stored data symbol | Indicates that that data gets stored here |
 | Database symbol | Represents a list of information with a standard structure |
 | Direct access storage symbol | This is a symbol for a hard drive |
 | Internal storage symbol | Represents data stored in a system’s internal memory |
Here are process map symbols that show a step carries out a task, operation, or logic:
| Shape | Name | Function |
|---|---|---|
 | Process symbol | Represents an action, task, or operation |
 | Subroutine symbol | This symbol shows a series of actions related to a larger task, which may also have a separate process map |
 | Alternate symbol | This shows that there is an alternative step that could be taken |
 | Delay symbol | Represents a waiting period or delay |
 | Preparation symbol | This step shows preparation before the next operation |
 | Manual loop symbol | Shows a sequence of commands that repeats until stopped manually |
Every process map must indicate the type of information. These symbols help communicate input and output:
| Shape | Name | Function |
|---|---|---|
 | Input or output symbol | Represents material or information entering or leaving the process |
 | Document symbol | Indicates a process step that uses or generates a document or report |
 | Multiple documents symbol | This is a step that shows multiple documents are used or produced |
 | Display symbol | Shows that some information is displayed or presented |
 | Manual input symbol | A manual input symbol represents that a step requires human input and is not automated |
To help your business visualize the direction of information flow, these process map symbols are essential:
| Shape | Name | Function |
|---|---|---|
 | Arrow symbol | Indicates the direction of information or process. This is mainly for reading purposes |
 | Terminator symbol | Represents the start or end of a process |
 | Decision symbol | Shows the step where a decision must be made |
 | Connector symbol | This symbol connects two process maps. Usually, for continuing mapping on a different page |
 | Off-page connector symbol | This symbol shows where it connects when a process continues on a page outside of the sequence |
 | Merge symbol | Shows where multiple processes merge |
 | Extract symbol | Symbolizes taking a specific piece of data from a more extensive data set |
 | OR symbol | A branching point where one of multiple paths can be taken |
A standardized process map ensures each shape represents a similar type of task or operation. Here’s a glossary to help you understand common shapes in a process map and their key function:
| Shape | Function |
|---|---|
| Circle | Indicates the beginning or end of a process |
| Oval | Represents a step or activity within a process |
| Rectangle | Indicates a point where a choice is made |
| Diamond | Represents data entering or leaving a process |
| Parallelogram | Indicates a place where data is stored |
| Cylinder | Represents a data store that is accessed sequentially |
| Triangle | Shows a manual step or a delay in the process |
| Hexagon | Represents an external data source |
| Pentagon | This is a reusable block of steps within a larger process |
| Trapezoid | Represents a document or report |
What symbols to use depends on the process map types that fit your needs. Here are six standard process map types based on specific purposes and best-use cases:
A detailed map provides an in-depth view of the process, including every step and decision. It’s ideal for understanding complex processes or identifying bottlenecks.
Here are the most frequently used symbols:
Here’s where you should use a detailed process map:
A high-level process map offers a broad overview of significant milestones and decision points. It helps understand the overall flow of a process or communicating with stakeholders.
Here are frequently used advanced process map symbols:
Here are the best situations for which a high-level process map:
A VSM helps identify waste and inefficiencies within a process, focusing on the flow of value. This approach is often used in dedicated VSM software for lean process improvement.
Here are the symbols involved in a VSM:
A VSM is best applied for the following purposes:
A swimlane process map visualizes a process across different departments or teams using clear sections. These sections often represent the departments or functions responsible for the task.
The process map symbols unique to the swimlane are horizontal or vertical bands. These bands visually separate the responsibilities of different teams, departments, or individuals involved.
A swimlane is perfect for the following purposes:
A decision tree represents decision-making processes and their potential outcomes. It branches out like a tree to help readers understand what could happen after performing a task.
Here are the symbols that are involved here:
Here are the best situations a decision tree is suited for:
A process flowchart focuses on the sequence of steps. It’s a basic but effective tool for visualizing processes.
Here are some of the basic flowchart symbols:
Here are the best situations a flowchart is suited for:
In addition to these types, chart-based process types, such as data flow diagrams, workflow diagrams, and cumulative flow diagrams, are gaining traction in project management.
Here’s a two-part walkthrough that covers process map creation and analysis. ClickUp’s process mapping tools can make this a lot easier.
Here are the six steps you need to follow for an effective process map:
The first step is to involve stakeholders and establish the process map’s focus and approach.
Here are two steps to do so:
While this sounds extensive, ClickUp offers numerous visualization tools to help finalize the scope and approach in the very first meeting.
ClickUp Whiteboards are collaborative digital canvases ideal for brainstorming and visualizing ideas. When defining the intent, expectations, and needs of a project or process map, this tool always delivers.
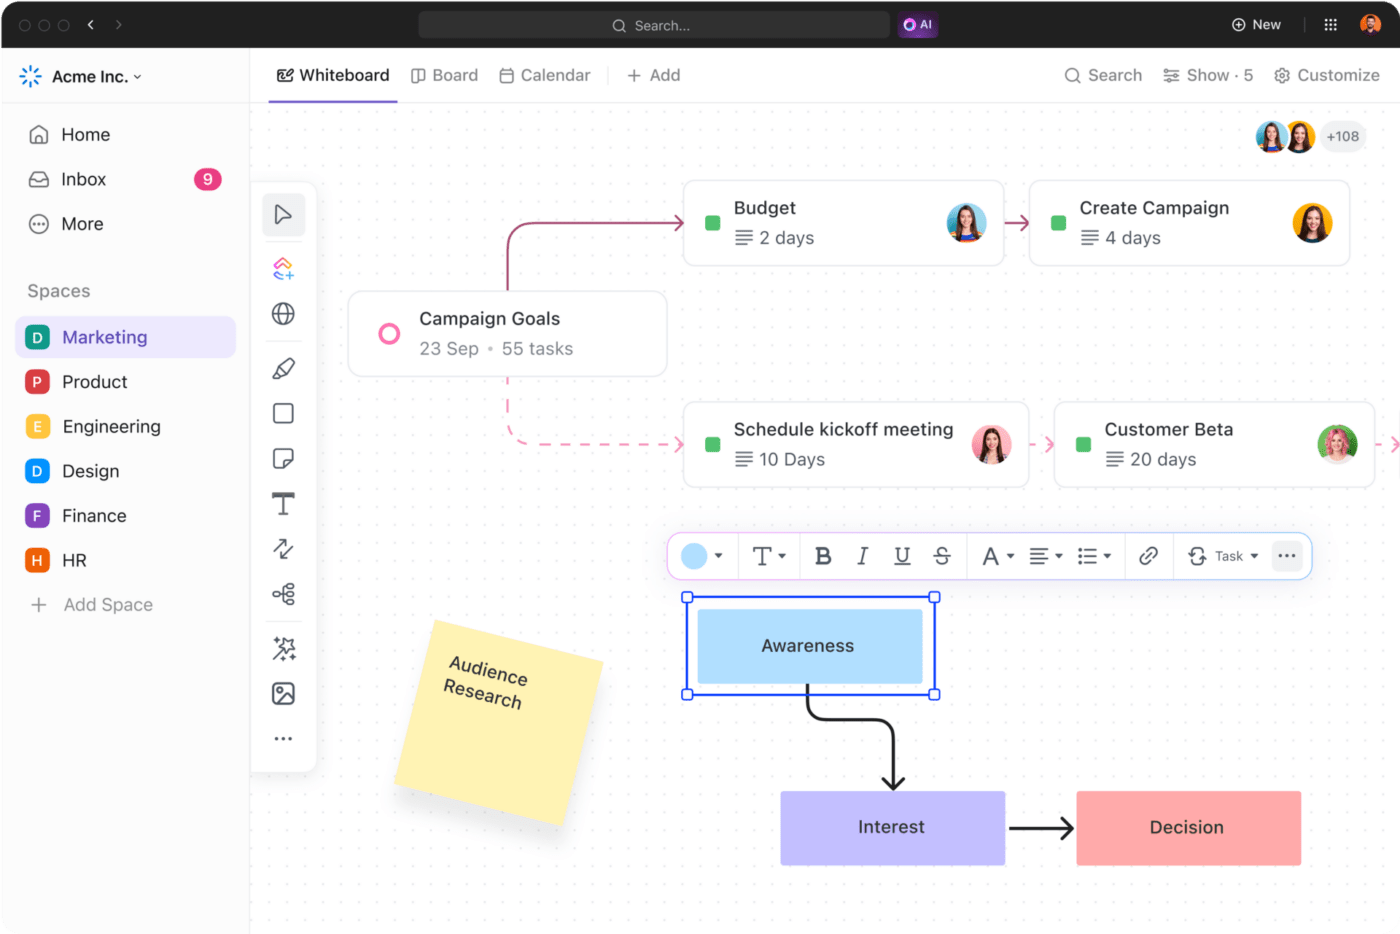
Here’s how ClickUp Whiteboards helps define a process map’s scope and approach in a stakeholder meeting:
With the expectations clarified, the next step is for functional heads to document every step, handling process, and methodology involved.
This requires extensive brainstorming, mapping, and sharing. ClickUp facilitates this with a dedicated set of brainstorming and visualization tools.

ClickUp Mind Maps is a visual tool for brainstorming, organizing ideas, and creating connections between concepts. When you’ve set the scope and approach, this tool transforms how you document and connect each step and operation.
Here are a few features of ClickUp Mind Maps that facilitate detailed process map documentation:
Even with these awesome tools, creating a customized solution from scratch may be time-consuming. To address this, you can access several ClickUp templates that are ready to use and easily customizable.
The ClickUp Process Map Whiteboard Template is the ideal framework for collaborative process mapping and documentation. Its basic yet visually striking structure ensures all observations lead to a clear and organized visualization.
Here are some features that make step documentation and visualization seamless:
Once the steps and processes are defined, you must finalize what symbols apply.
Here are a few key facts to keep in mind when selecting your process map symbols:
With the set of process mapping symbols mapped against each step, placing them together as a process map becomes seamless.
Projects, logical solutions, and departments tend to have numerous but similar processes. Once your process map is ready, standardize it as a template. This will become your reference for quickly creating fresh process maps.
ClickUp has multiple process mapping frameworks, such as the ClickUp Process Flowchart Template and several other value stream mapping templates, to supercharge your creation process.
If you’re looking for a framework that can easily adapt to your business needs, the ClickUp Process Mapping Template is your go-to solution. Right from workflow creation to team collaboration, this template empowers you to visualize it all.
Here are some features that highlight its capacity to become your default standardized solution:
While you may have all your business processes mapped, they are subject to change. Optimizing and automating your process maps helps you keep them updated through any change. This is especially helpful when reviewing new challenges or deploying improvements horizontally.
This step usually requires adopting technology and advanced tools. This often leads to financial and competency-related challenges. ClickUp simplifies all that with its dedicated AI platform tool.

ClickUp Brain is ClickUp’s built-in AI tool that drives automation and provides in-depth data insights. When incorporated into your process maps, it simplifies creation and helps keep your visualizations up to date.
Here are a few benefits of ClickUp Brain in process maps:

Now that you know how to create a process, let’s analyze and interpret an example.
We’ve created a flowchart with a logical flow, decision-making elements, and rework loops.
Identifying the type of process map helps break down how to read it.
This visualization maps how sales and logistics teams should address increased customer demand projection. It outlines the steps involved in demand verification, customer communication, and how to work towards capacity increase.
After going step by step, it’s important to note what you understand.
Here’s an analysis of the flowchart example:
Now you know how to create a process map with symbols, let’s show you how it transforms your business. Here are five benefits of using process map symbols:
Process map symbols aim to simplify a complex process. With a standardized set of symbols, information flow is quick and effective. This makes understanding the process flow simple, even for stakeholders without technical expertise.
The improved visualization also helps teams spot potential areas for improvement.
Process map symbols are a language on their own. Visualizing your processes with a common language fosters better communication and understanding. The right symbols also simplify discussions and facilitate efficient teamwork.
One of the top reasons businesses adopt process maps is to improve their operations.
Process map symbols efficiently highlight bottlenecks, redundancies, and inefficiencies in your processes. This results in streamlined workflows and overall efficiency.
A process map with the right symbols makes it easier to evaluate different options. This data-driven and logical approach is crucial for improving decision accuracy.
By visualizing the potential outcomes of different choices, you can identify the best course of action and avoid costly mistakes.
Process map symbols clarify who is responsible for each action or step. They also simplify the task delegation process and boost performance by informing employees of their work scope.
While process maps give meaning to a business’s complex operations, process map symbols are the key to simplifying its complexities and improving efficiency. Knowing how to use a process map is vital to facilitating communication, collaboration, and decision-making,
With the comprehensive guide and standard process map symbol examples we’ve covered, you’re almost ready to transform your productivity levels.
All that’s left is to choose ClickUp and its extensive range of tools to streamline your process mapping journey. So, sign up on ClickUp to give it a try!

© 2026 ClickUp

There’s an easier way. Try a free AI Agent in ClickUp that actually does the work for you—set up in minutes, save hours every week.