You’re trying to become a more efficient team, so what do you need to do to improve?
Process mapping might be the tool you don’t yet know you need.
A process map makes what’s happening within a business visual—whether that’s operations, how projects are managed, how your procurement systems are set up, or even how you’re handling incoming customer support tickets.
It’s a surefire way to pinpoint inefficiencies, gaps in your thought processes, and fixable bottlenecks. But creating a process map that’ll help you improve requires that you get familiar with all things process mapping.
Once you nail the mapping symbols and best practices down, you’ll see how easy it is to create handy process maps from scratch (or use a premade template can really help too!) Buckle up and take a deep dive into the world of process mapping below.

What is Process Mapping?
Process mapping is a visual representation of a process that helps to identify its most important components and potential inefficiencies. It provides an overview of the process, outlining the sequence of events, tasks, and steps involved in achieving a particular outcome.
Businesses use this approach to identify bottlenecks in their workflow and ultimately improve their results. Process maps should essentially work as an outline of how your team will get projects across the finish line.
6 Process Mapping Examples
Process maps can be used in a variety of ways. It all depends on your team goals and the current structure of your business processes. But for the most part, there are six common types of process maps. Let’s take a look at each one and how they work.
1. Flowcharts
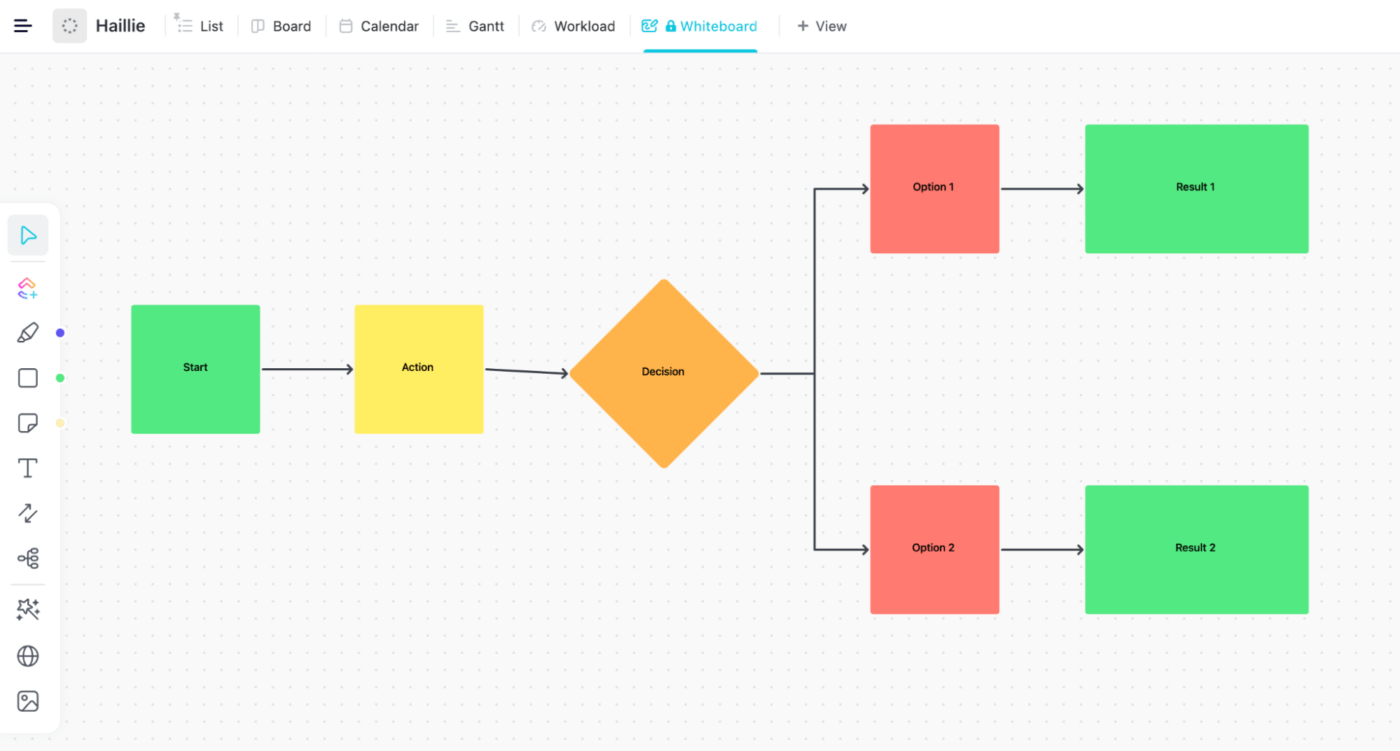
In this standard process map, shapes and symbols represent different tasks and events. Process mapping from start to finish typically relies on flowcharts.
When you’re mapping out your entire process, flow charts are useful visual tools to represent a series of steps. Out of the various types of process maps, this one clarifies complex procedures or systems and makes it easier to identify areas for improvement or optimization.
Additionally, you can use ClickUp’s Whiteboards feature to help with communication and collaboration among team members, particularly when working on projects that require multiple steps or involve multiple stakeholders.
2. Swimlane diagrams
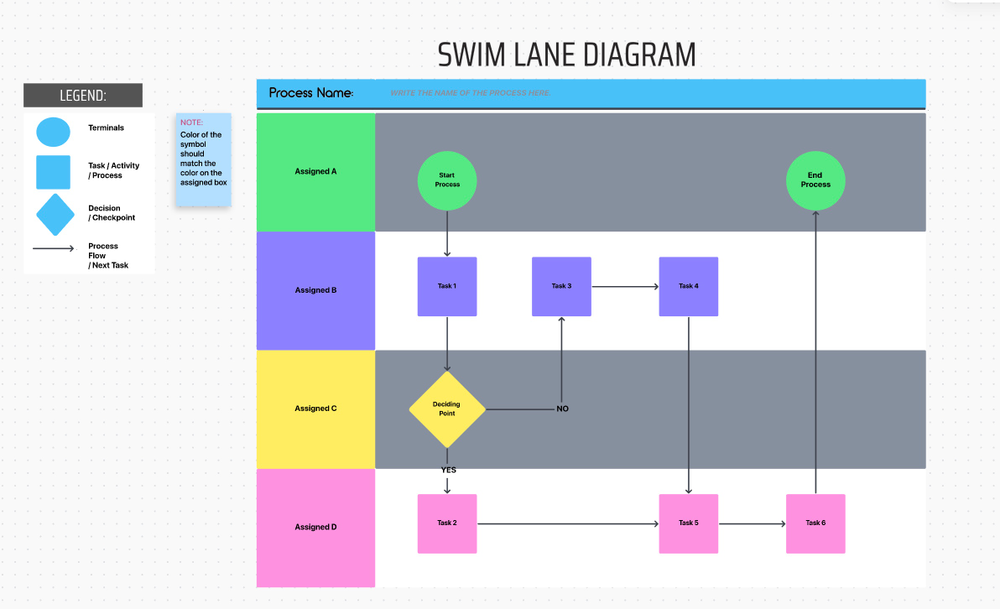
The lanes in a swimlane map represent the responsibilities of different individuals or departments involved in the process. Diagrams with swimlanes are useful for mapping out complex processes involving multiple departments.
Use the ClickUp Swimlane Flowchart Template to clarify who on your team is responsible for each step—whether it’s multiple individuals or entire teams. By organizing information by lanes, swimlane flow charts make it easier to see potential bottlenecks or delays so you can improve your business processes with a detailed process map.
3. Process activity map
As the name implies, this map does exactly what it says. The map shows which activities in a process have the most impact on your business processes and which have the least. It’s useful when determining which activities provide the best return on investment to refine your budget accordingly in your process mapping stage.
4. Value stream map
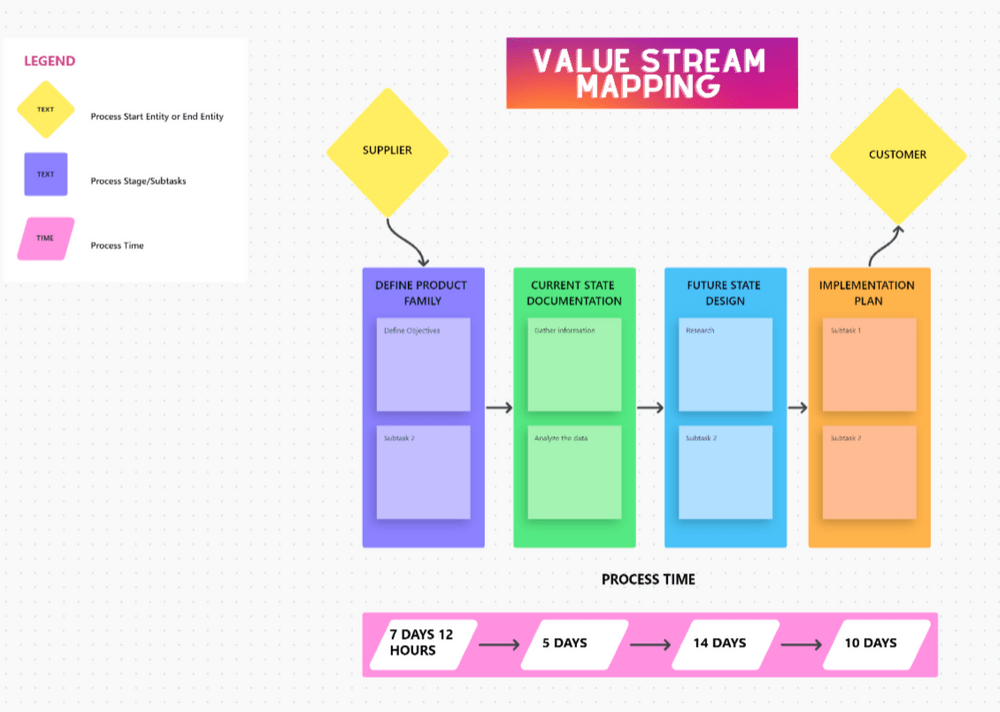
Value stream maps are also known as material and information flow mapping. It outlines the steps in a process and the resources it uses at each stage. In fact, value stream maps visualize how information and materials move through process mapping from beginning to end.
Use the ClickUp Value Streaming Map Template to maximize the efficiency of your operations and thoroughly analyze your current state. This value stream map template helps you develop an optimized implementation plan, so you can enhance your processes and drive your organization toward success.
Bonus: Check out the top 10 Value Stream Mapping Templates to Improve Team Processes
5. Process flow diagram
This diagram makes the decision-making process easier. That is, it helps teams drive improvements because it clearly outlines how processes flow to achieve desired results—which is great for project management. Think of it like a Mind Map or a Whiteboard to detail your overall flow.
You can make it even easier to build or update your process flow with a template. Use the ClickUp Process Flow Whiteboard Template to visualize your project workflows and enhance your process mapping procedures.
6. SIPOC diagram
This diagram stands for Suppliers, Inputs, Processes, Outputs, and Customers. It lays out the key elements of a process in a chart-like form that’s easy to digest. A SIPOC diagram is a useful map when you’re trying to determine the scope of a project.
And no surprise here, but ClickUp has a template for it to help with process mapping. The ClickUp SIPOC Template uses the board view easily detail the important aspects of your process so it’s simple to dissect and understand.
How to Create a Process Map
Creating a detailed process map requires that you have a good understanding of your business operations. We’ve broken it down into a few helpful steps to give you a head start in process mapping.
Step 1: Define the Process Scope
First, select the process you want to analyze and make sure it significantly impacts your business operations. You also want to consider the scope of the process—decide whether to analyze a single department, cross-functional processes, or even processes spanning multiple locations.
For instance, you may want to map your sales process, focusing on how it interacts with your marketing and customer support departments.
Step 2: Assemble a Process Mapping Team
Gather a team! The more heads you put together to create one consistent process map, the better. Tap the people who have expertise in different parts of the process mapping procedure.
This makes sure you capture the complete picture. Plus, it’s also a way to get buy-in from stakeholders. Encourage open communication and collaboration within the team. 🤝
Step 3: Collect In-Depth Information
This is where the rubber hits the road. It’s time for thorough research on the process. This may involve interviewing employees, observing the process in action, and reviewing relevant documents like standard operating procedures, work instructions, and key performance metrics.
Aim for a clear understanding of each step involved in the process, along with the inputs, outputs, and resources required for your process steps.
Step 4: Identify the Start and End Points
Where does the process begin and where does it end? Be sure the process boundaries are clear. Establish all preconditions, triggers, and postconditions relevant to the process.
For example, in an order fulfillment process, the starting point could be receiving the order, while the endpoint could be shipping the order or delivering it to the customer.
Step 5: Break Down the Steps
Break down the process into its individual steps. Identify all tasks, decisions, and events that occur from the start all the way to the end of the process.
Be as detailed as possible while considering sub-processes, dependencies, and exceptions that may arise during the process. This way, you create a comprehensive process map that truly showcases the intricacies of the business process. 💪
Step 6: Sequence the Steps and Identify Roles
Have your process steps? Now it’s time to arrange the steps in the order they occur and assign roles or departments responsible for reviewing each step for accuracy.

Document any handoffs or communication points between roles or departments to ensure a smooth process flow. This takes collaboration.
Which means you’ll need collaborative tools. With ClickUp Whiteboards, teams easily sketch process maps, label symbols, and share their maps with the whole company so everyone is in the know.
Step 7: Add Process Symbols and Notations
Use standard process symbols and notations to represent the different elements of the process. Consistency is key for easy reading and understanding.
Some common symbols include:
- Oval: Start or endpoint
- Rectangle: Task or activity
- Diamond: Decision point
- Arrow: Flow direction
- Circle: Connector or continuation point
Here’s a hint: Add swimlanes to your process map to represent roles or departments. It’ll help you visualize the division of responsibilities and interactions within the process.
Step 8: Validate the Process Map
Review the process map with the process mapping team and other relevant stakeholders. You’re looking to validate its accuracy here to make sure it accurately draws out your most updated process.
Encourage feedback and incorporate any necessary changes to refine the map. This step helps create a process map that everyone involved agrees upon.
Step 9: Optimize the Process
Analyze the process map to identify areas for improvement, such as bottlenecks, redundancies, or inefficiencies. This is where teams are able to use the process map to facilitate discussions, streamline workflows, or automate repetitive tasks.

The Benefits of Process Mapping for Your Team
Process mapping provides several benefits that help businesses improve their operations and process management key elements.
Process mapping uses your resources more efficiently
Especially if you’re a project manager, you need to ensure your team is getting the most out of their resources. This means less time wasted and more energy directed at results-oriented tasks that give your team the best return on their investment.
Unclear expectations are a nightmare for everyone involved. Your team doesn’t know what to aim for and milestones are more likely to be missed. Process mapping helps fix that by leveling expectations across teams.
A process flowchart improves team communication and documentation
Process maps ensure teams work from one source of truth. This leads to less confusion, miscommunication, and missed deadlines. It’s critical for teams to be on the same page about something as foundational as processes to a business.
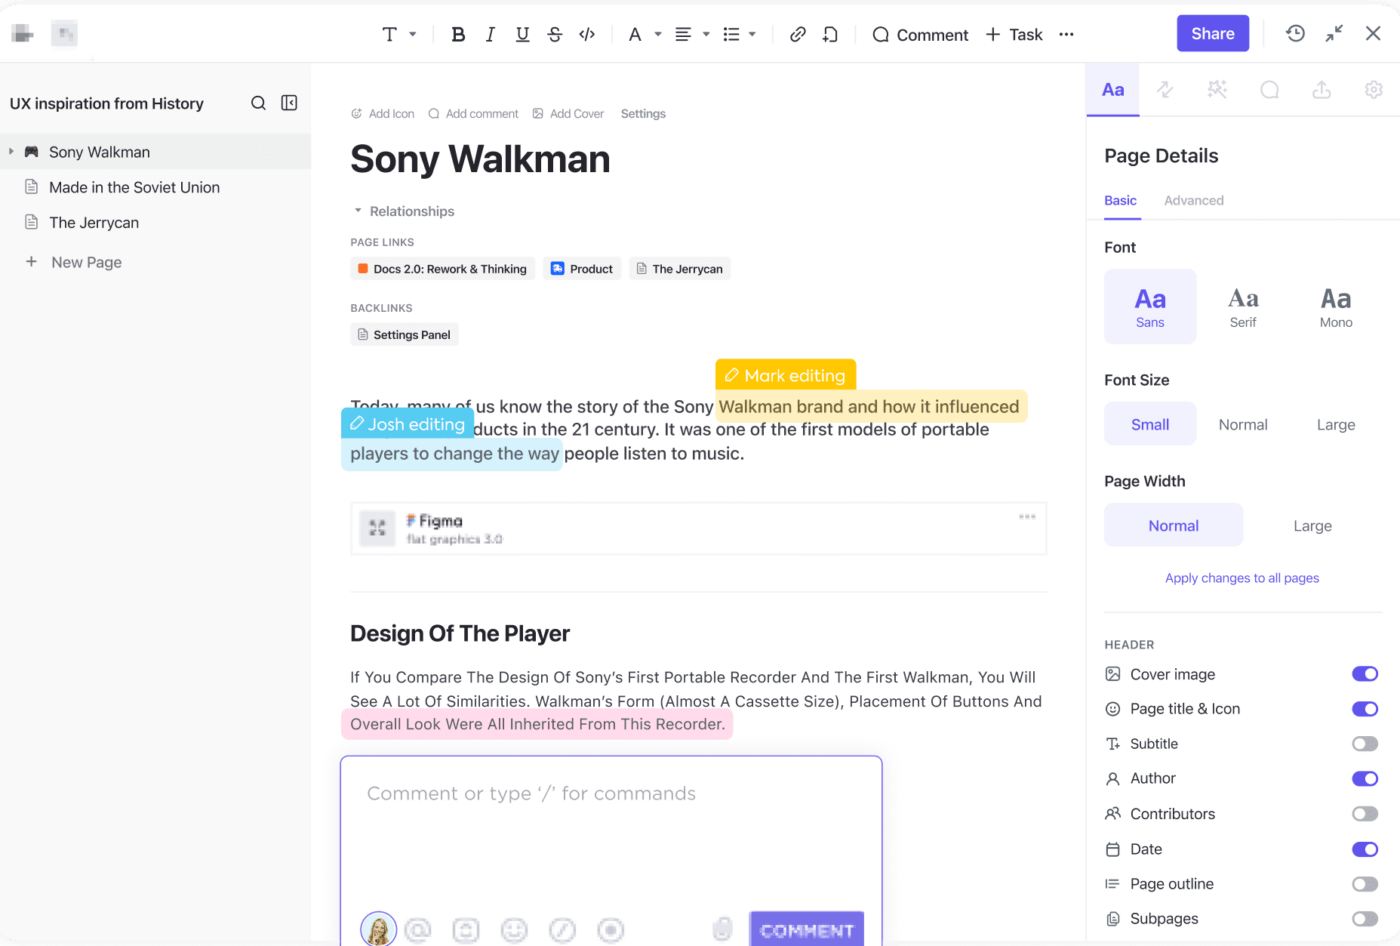
Creating one process document that lives in one dashboard and that’s easily shareable leaves little room for error and missed opportunities in your process mapping creation. Processes and workflows evolve over time as new data comes, a new person joins the team, or net-new projects need to be tackled.
Consider that documenting past processes help in the creation of new ones. You can also help employees understand their roles and responsibilities with a detailed process map.
They need to see how their tasks fit into the bigger picture and understand how their work contributes to the overall process. Process mapping is a proactive way to improve team communication across departments—including external partners or customers.
Work With More Agile Workflows
Process mapping enables businesses to become more agile by identifying areas where changes may be applied quickly.
With a clear understanding of the process, businesses identify areas to streamline operations, automate tasks, or even outsource certain activities. Responding to changing market conditions or customer needs more effectively becomes that much easier. ⚙️
Process Mapping Best Practices
Consider some pointers that’ll improve your next process mapping initiatives:
- Establish clear objectives from the beginning: Before starting, identify the specific goals you want to achieve with your process map. This helps you maintain focus on what’s important and drives meaningful improvements.
- Use different levels of granularity: Create process maps with varying levels of detail to suit different audiences. High-level maps for strategic planning and more detailed maps for operational improvements make sure you address the entirety of your team’s needs.
- Don’t be afraid to Incorporate data: Enhance your process map by adding relevant data! Consider adding process performance metrics, cycle times, or even resource usage metrics. This enables informed decision-making and highlights areas that may require more of your attention.
- Integrate process documentation: Link your process map to existing process documentation, such as standard operating procedures or work instructions. This creates a single source of truth for your team and simplifies process management changes in the future.
- Capture decision-making criteria: When mapping decision points, including the criteria, used to make decisions. It’s a way to establish consistency and clarifies the rationale behind each choice.
- Visualize cross-functional interactions: Use swimlanes or other visual techniques to represent the interactions between roles or departments. This highlights potential points of friction and encourages collaboration.
Optimize Workflows with Process Maps
By creating a visual representation of a process, businesses identify potential inefficiencies, reduce errors, and improve quality. Using a platform like ClickUp helps your process mapping efforts through templates, interactive Whiteboards, and even Mind Mapping tools to elaborate everything for your team.
Creating a process map that’ll improve operations and help teams visualize areas of improvement is simple. Your process map shouldn’t be overly complicated, and neither should the software you use to create it.
With this detailed guide, you’re well-prepared to create a comprehensive process map that helps your team understand, analyze, and optimize crucial business operations.


