

Ever wonder how people navigated before the invention of maps? With the help of the position of the sun and stars.
In the middle of the project, if you feel like you’re seeing stars, you need a map—a process map. Let’s see a few process mapping techniques and how you can use them to improve business efficiency.
How to Use Process Mapping Techniques for Business Efficiency
What are Process Mapping Techniques?
Process mapping techniques are systematic approaches used to visually document, analyze, and improve the steps involved in a business process. There are various process mapping techniques, such as workflow diagrams, data flow diagrams, business process modeling notations, SIPOC diagrams, etc. Before we get to the details, let’s understand the basics.
What is business process mapping?
Business process mapping is the visual representation of the sequence of steps involved in any business process. It provides a consolidated picture of a process from start to finish.
The most straightforward process mapping technique is a flowchart that graphically represents a process’s sequence of actions or steps. The process flowchart for a customer complaint resolution might look like this.
Receive customer complaint > evaluate complaint > set priority > assign to customer service executive > resolve complaint > close ticket > collect feedback.
What does a process map include?
Typical process maps include the following.
- Actions that users perform to further a process
- Decision points where users decide the course of action
- Direction of flow based on decisions
- Start and end points that denote the beginning and end of the process
Depending on the complexity of your project, you might have several more components, but these four represent the basics.
How is process mapping different from business process modeling?
While the two terms sound similar and have some overlap, business process mapping is distinct from business process modeling.
Business process modeling is a quantitative and data-driven approach to outlining complex processes, whereas process mapping is a qualitative view of how the stakeholders perceive their processes.
Moreover, modeling tends to be detailed and comprehensive, looking at the process from multiple perspectives, whereas mapping is generally more straightforward, focusing on the sequence of activities.
Business process mapping sets the foundation for understanding current processes and how each stakeholder believes it should be. This offers several benefits.
Importance and Benefits of Business Process Mapping Techniques
Business process mapping can be done using various techniques, each suitable for specific purposes. Whichever route you take, the benefits are plenty.
Better visibility: Business process mapping clearly visualizes how processes work within an organization. This way, everyone knows what’s expected to happen.
For instance, if the senior developer is expected to perform a code review immediately after coding is complete, the process map will make it clear to both.
Identifying inefficiencies: In business process management, maps identify inefficiencies, redundancies, and bottlenecks in their processes.
For instance, if a procurement process map shows multiple approvals for routine purchases, the company might streamline this by setting higher thresholds for managerial review, thus speeding up procurements.
Streamlining communication: Good process mapping tools lay bare any communication gaps or redundancies from a lack of information flow. You can use this data to set better communication protocols.
Employee satisfaction: When team members know the steps before and after their work, they are likely to be more thoughtful of their output. For instance, when the business analyst knows the feature will go for testing, they write clearer user stories and acceptance criteria.
Automation: This is the most important benefit. Process mapping enables business process automation by:
- Outlining process flow and sequence of steps
- Identifying dependencies and overlaps
- Calculating time and effort for each step
- Measuring the impact of one step on the next
- Organizing steps into a repeatable and automatable sequence
With all this information, businesses can automate processes intelligently, freeing up team members to focus on more strategic activities.
With theory about business process mapping out of the way, let’s get into the practice of it. Here are the top business process mapping techniques you can apply to your needs today.
Business Process Mapping Techniques
Depending on the nature of your process, its complexity, the stakeholders involved, its impact on the business, etc., you can choose from several advanced process mapping techniques. Here, we discuss the top few.
1. Workflow techniques
A workflow is a sequence of steps people or machines follow to complete a task or achieve an objective. This can be simple, like withdrawing money from an ATM, or complex, like assembling a smartphone.
Workflow-based business process mapping techniques could be used for the entire process, however complex. Organizations also use this technique to map the workflow of workflows.
For example, the development team might have a programming workflow. The engineering team might have a deployment workflow connected to the programming workflow. The DevOps team might have an application maintenance workflow that includes both these.
Here’s how you can use workflow techniques to map your business process.
Identify workflow type
Workflows are of four types. Begin your business process mapping by identifying what kind of process yours is.
Sequential: In sequential workflows, tasks are performed in a particular order, one after another. Take the example of withdrawing money from an ATM; you perform the steps in a sequence from inserting your card to taking your card back.
State-machine: State-machine workflows are when the process goes back and forth. For instance, while developing UX for a mobile app, you might conduct multiple user tests and research going back and forth before making the final design.
Rules-based: These are if-this-then-that workflows, though not as simple. Some decisions might have multiple choices, each branching into multiple process flows.
Parallel: When a workflow is parallel, the processes/tasks happen simultaneously. Lean manufacturing has several parallel workflows.
Recognize various components
Every workflow includes various components such as:
- Tasks: Each step/activity performed in the workflow
- Relationships: Dependencies and connections between the tasks in the workflow
- Roles: Who is responsible for each task (this needn’t be individuals, it can also be roles such as project manager, developer, etc.)
- Direction: Flow of information (this is critical especially in state-machine workflows)
- SOPs: Standard operating procedures for tasks within the workflow
Include all these details in the workflow documentation.
Create a workflow diagram
With the various components of your process, create a workflow diagram, outlining the tasks, who will do them, in what order, and to what standards. Here are some workflow diagram examples for inspiration.

2. Data flow diagrams
If workflows are about action/activities, data flow is about information. Data flow diagrams illustrate how data moves from input to output through a process, highlighting the sources, destinations, storage points, and paths.
They help map information systems, making them especially useful in software and data-intensive processes.

To draw a data flow diagram, use the following components.
- Circles or rounded rectangles for processes that show how data is transformed within the system
- Open-ended rectangles or lines for data stores, such as files, databases, or warehouses
- Squares or rectangles for external entities like data sources or destinations outside the system boundary
- Arrows for the flow of data, connecting processes, data stores, and external entities
While using data flow diagrams, it is important to note that there is no control flow. This means this diagram has no conditional flows, decision rules, or loops. These can be represented as flow charts connected to the data flow diagram.
3. Business process model and notation (BPMN)
A business process model and notation is a set of guidelines for creating a graphical representation of processes in an organization. It provides a comprehensive suite of symbols and notations easily understandable by all business stakeholders.

BPNM is best suited for processes that need to be understood by technical teams, business analysts, leaders, and clients. Here are the recommended notations and how you can use them.
Identify your flow objects: These represent tasks, events, or work done in the process. For instance, a task node might represent checking a customer’s credit in an order-to-cash process.
Draw the connecting objects: These represent the flow of information or action—a solid line with solid arrowhead points from one activity to the next. Dotted lines represent message flow or association.
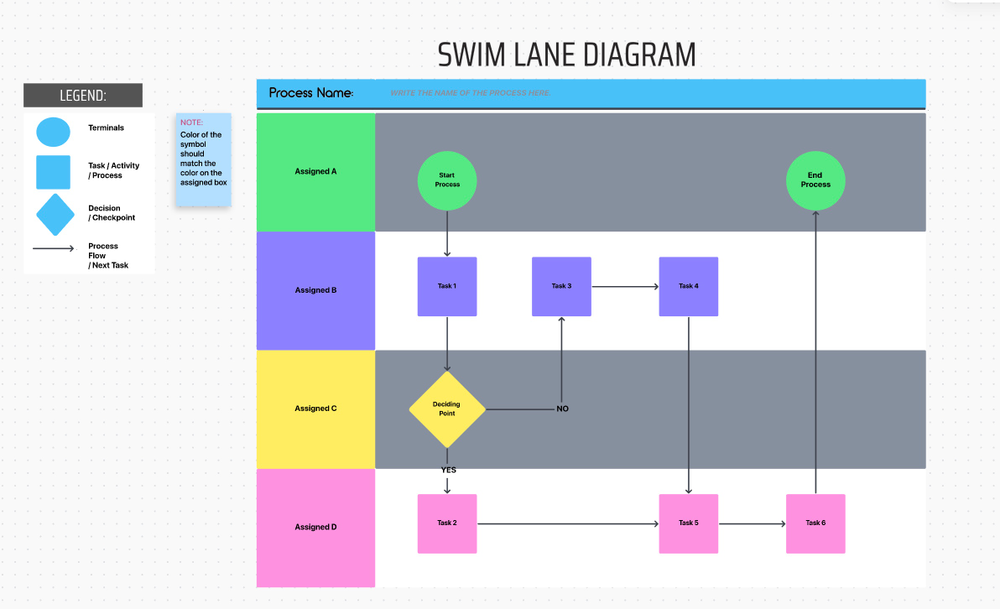
Organize into swimlanes: These refer to categories or stakeholders who perform the various tasks in the process. For example, in an invoice processing system, tasks may be divided into lanes for vendors, customers, finance teams, sales teams, etc.
Use artifacts: Show how data is required or produced by activities. For example, a data object might be an order created and then updated through various process steps.
Bonus: Learn about AI process mapping!
4. Unified model language (UML) diagrams
Unified Modeling Language (UML) is a modeling language that is used to visualize the design of a system. UML is used extensively in software engineering to depict the structures and behaviors of various components.
Though called so, it is not a programming language but a set of guidelines and vocabulary for visualizing systems. Each UML diagram focuses on a different aspect of the system, making it easier for stakeholders to understand complex software designs.
While mapping business processes, use the kind of UML that suits you. There are two categories within UMLs.
Structural diagrams
Structural diagrams are best for the static aspects of a system, such as the source code structure, including the components, classes, objects, and their arrangements.
For instance, a class diagram for a social media platform might detail how user profiles, posts, comments, and messages are structured and interlinked.
Behavioral diagrams
Behavioral diagrams are best for the dynamic aspects of a system, illustrating how the elements within the system interact and change over time. These diagrams outline the flow of control from one activity to another, the interactions between objects, and the system’s responses to events.
For example, a sequence diagram for a bug-tracking system could illustrate the process of reporting a bug, including interactions between the user, the system interface, and the database, highlighting how the system behaves in response to user actions and system events.
5. SIPOC diagrams
SIPOC stands for Suppliers, Inputs, Processes, Outputs, and Customers. It is a tool used in manufacturing, retail, supply chain, and related industries to map out a high-level process overview.
SIPOC diagrams are best for creating a bird’s eye view of the business landscape. It covers end-to-end, including:
- Suppliers who provide the inputs necessary for the process, who can be internal to your organization or external vendors
- Inputs, including the materials, information, or resources needed to execute the process
- Process and the high-level activities that transform input into output. SIPOC diagrams are typically made of 5-7 steps to maintain simplicity and clarity
- Outputs, such as the products, services, or information the process generates
- Customers, both internal and external to the business
With any of these techniques, you can reap the benefits of streamlined business processes, optimization, and automation. Irrespective of which one you use, here is how to create an efficient business process map.
How to Create an Efficient Business Process Map
You need research, clarity, and a purpose-designed tool like ClickUp to create a process map. Here’s a step-by-step guide on using them to map your processes.
Define the scope and objectives
Every process involves several steps. To map the process effectively, you need to define its scope, the level of detail required, and what you hope to achieve with it. For example, if you’re mapping the procurement process, the scope can be end-to-end or just a part of it, like vendor selection.
A good value stream mapping software can help identify the level of granularity you need. Before you begin work, use ClickUp Docs for process documentation, including the scope and guardrails for your efforts.
Collect data
Collect all necessary information about the process, including the steps, tasks, inputs, outputs, decision points, and roles involved.
Interviewing team members and stakeholders is a great way to gather this information. You can also use ClickUp Forms to survey stakeholders to collect pointed data.

Identify start and end points
Clearly define where the process starts and ends. This sets the boundaries of your detailed process map and ensures we include all relevant activities.
For the procurement example, the process might start with identifying a need and end with receiving goods and paying the supplier.
Fill in the gaps
Place the start and end points on any of the process mapping tools. Then, sequentially add each step and decision point you have documented. Ensure the use of standard process mapping symbols for consistency and clarity.
ClickUp Whiteboard gives you a clean canvas to map your process as you see fit. If you see inefficiencies and would like to brainstorm ideas, use ClickUp Mind Maps to build scenarios.

If you’re new to process mapping, try some of ClickUp’s templates:
- ClickUp’s Process Mapping Template is ideal for beginners. With custom statuses and lists, it allows you to track tasks and activities effectively
- For a more advanced version, try ClickUp’s Process Map Whiteboard Template
- ClickUp also offers plenty of value stream mapping templates for efficient mapping, saving time
Assign responsibilities
Incorporate swimlanes into your process map to delineate responsibilities across different roles or departments. For example, separate swimlanes for the procurement team, finance department, and vendors can show which entity is responsible for approval, payment, and delivery at a glance.
Validate the process
Once the initial draft of the process map is complete, review and validate it with stakeholders involved in the process. This step ensures that the map accurately reflects the real-world process and includes all necessary details.
It’s also an opportunity to identify discrepancies or inefficiencies we overlooked.
Analyze and optimize
Analyze the process for inefficiencies, bottlenecks, or redundancies with a validated process map. Seek feedback and shortlist ideas for improvement, such as reorganizing steps, eliminating bottlenecks, reassigning responsibilities, or introducing new tools.
Implement these process improvements and continuously monitor progress.
Steer Your Business in the Right Direction With Process Mapping on ClickUp
A good process map does precisely what it says on the can—give direction to everyone using it. This is why it is one of the most popular techniques businesses use worldwide.
As effective as it is, process mapping can be challenging without the right tools. ClickUp’s project management software is designed with such needs in mind.
With whiteboards, mind maps, task lists, checklists, and templates, ClickUp gives you everything you need to build comprehensive process maps with whatever technique you prefer.
Start your business process mapping small. Try ClickUp for free today.
FAQs About Business Process Maps
1. What are the four steps to effective process mapping?
The four steps to effective mapping are:
- Defining scope
- Collecting data
- Mapping the process
- Analyzing and improving
2. What are the five levels of process mapping?
The five levels of process mapping, based on granularity, organized from the broadest overview to the most detailed documentation, are:
- Value stream map: Bird’s eye view of core business functions or processes
- High level: Broad view of the main processes within each core function
- Activity level: Zoomed in view of each activity within the process, including the sequence of tasks and decision points
- User level: Organized by tasks/activities that each user is responsible for
- Task level: The most detailed level, providing step-by-step instructions for performing each task in the process
3. What is an example of process mapping?
Consider a simple example of process mapping for a customer service inquiry.
Start: Customer submits an inquiry. This could be through any channel, such as email, phone, or a web form.
Inquiry logging: The inquiry is logged as a ticket into a tracking system with a unique identifier and priority. This is often automated.
Responsibility assigning: A representative gets assigned to the inquiry based on availability, ticket severity/priority, etc.
Resolution: The assigned representative reviews the inquiry, performs required actions, and then responds to the customer. This step may involve multiple sub-steps depending on the complexity of the inquiry.
Closure: The representative marks the ticket as closed after customer confirmation.Feedback: A survey is automatically sent to the customer to collect feedback.


Everything you need to stay organized and get work done.

Recent Articles
Claude Skills for Project Management: A Practical Guide 
Claude Skills for Project Management: A Practical Guide
How to Write a Scope of Work (+ Examples & Templates)
How to Write a Scope of Work (+ Examples & Templates)
What Are Project Goals? Definition, Examples & How To Write Them 
What Are Project Goals? Definition, Examples & How To Write Them
