Sorry, there were no results found for “”
Sorry, there were no results found for “”
Sorry, there were no results found for “”
The best part of History courses used to be the hand-drawn horizontal lines with major events squeezed between them. Ancient civilizations were on the left, world wars somewhere in the middle, and independence movements on the right.
Everything was plotted on one long line that somehow made history feel organized.
Now, when you need to map out project phases or report milestones, that same idea applies. Of course, you’ll need more than a pencil-lined notebook.
In this blog post, we explore how to create a timeline in Word without touching complicated design tools (so it still feels like you’re drawing!). 💁
A timeline is a visual representation that organizes events, tasks, or milestones in chronological order. It helps you understand the sequence and duration of activities within a project or process, providing a clear snapshot of when things start, progress, and finish.
In project management, timelines serve as roadmaps that outline key deliverables, dependencies, and critical milestones, allowing teams and stakeholders to stay aligned. They reduce confusion, facilitate communication, and enable better decision-making.
🧠 Fun Fact: The modern horizontal timeline graphic is actually a fairly recent invention. According to design researchers, the form didn’t become widely adopted until the mid-18th century with Joseph Priestley’s ‘A Chart of Biography’, which used horizontal bars to represent lifespans in 1765.
Microsoft Word gives you different ways to build a timeline. Some are quick, while some are more customizable.
Let’s look at the main options to pick from:
🔍 Did You Know? The logic behind the timeline format reflects a philosophical shift. As seen in a 2010 study, the timeline form helped thinkers see history as a sequence of interrelated events rather than isolated incidents, changing how we conceptualize time.
Here’s a simple, step-by-step breakdown to help you create a timeline in Word without any formatting headaches. 🗓️
Launch Microsoft Word and open a new blank document.
If your timeline has multiple milestones or spans a long period, switching your page to Landscape (via the Layout tab) gives you more horizontal breathing room.
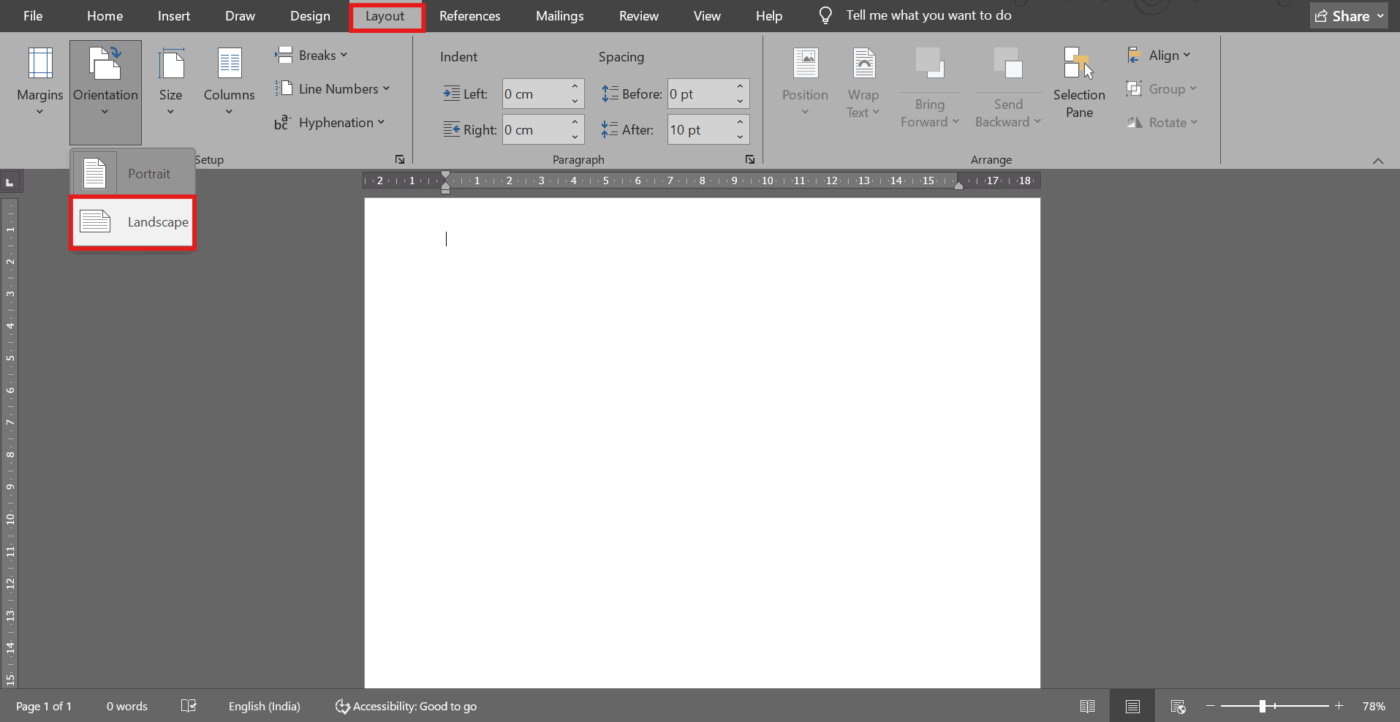
💡 Pro Tip: A Microsoft Word hack is to use the Landscape orientation, which is particularly helpful for timelines that stretch across months or years.
Head to the Insert tab and choose SmartArt.
A menu will pop up with different categories, from which you have to pick Process. This is where you’ll find Word’s built-in timeline layouts, like Basic Timeline or Circle Accent Timeline.
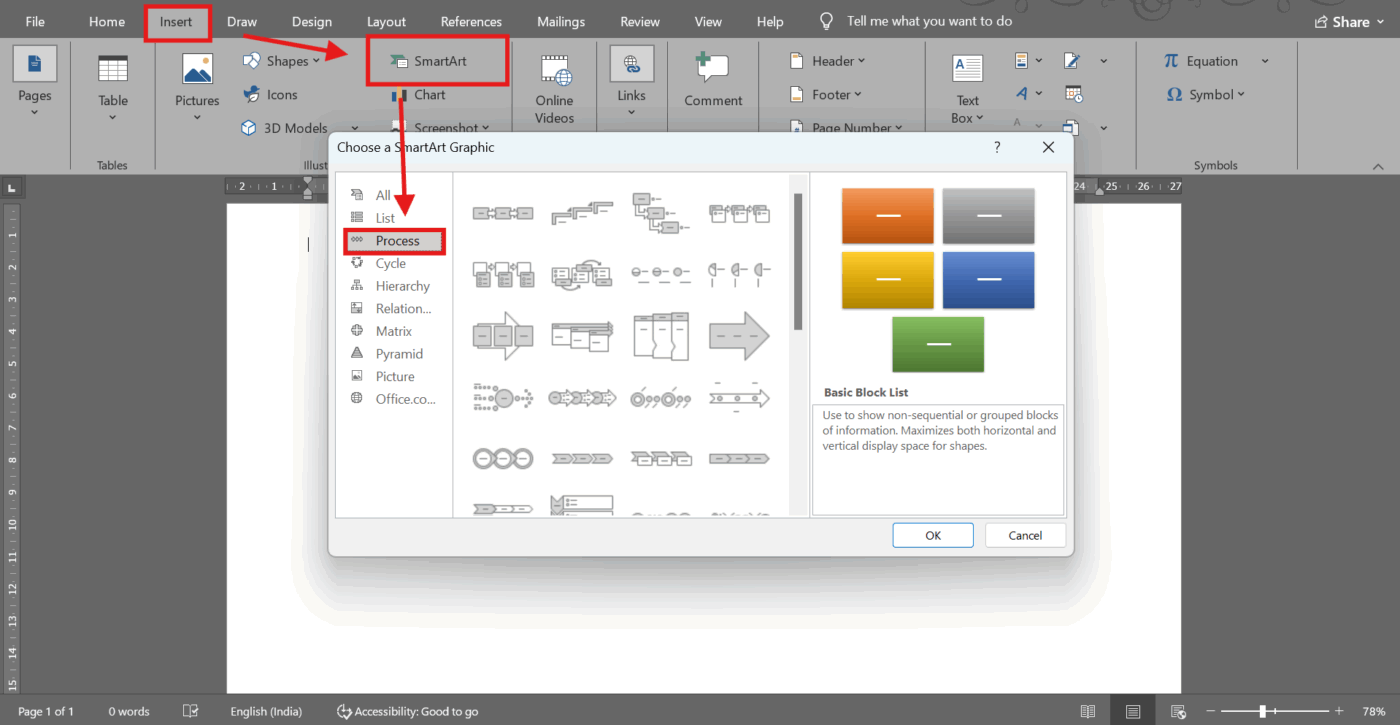
These predesigned graphics are great when you want structure without manually placing every line and shape. For instance, if you’re mapping out a product rollout, SmartArt instantly gives you a professional base to work from.
🤝 Friendly Reminder: Don’t overthink which SmartArt layout to start with. Pick one that looks close to what you want; Microsoft Word lets you change the style later without redoing your content.
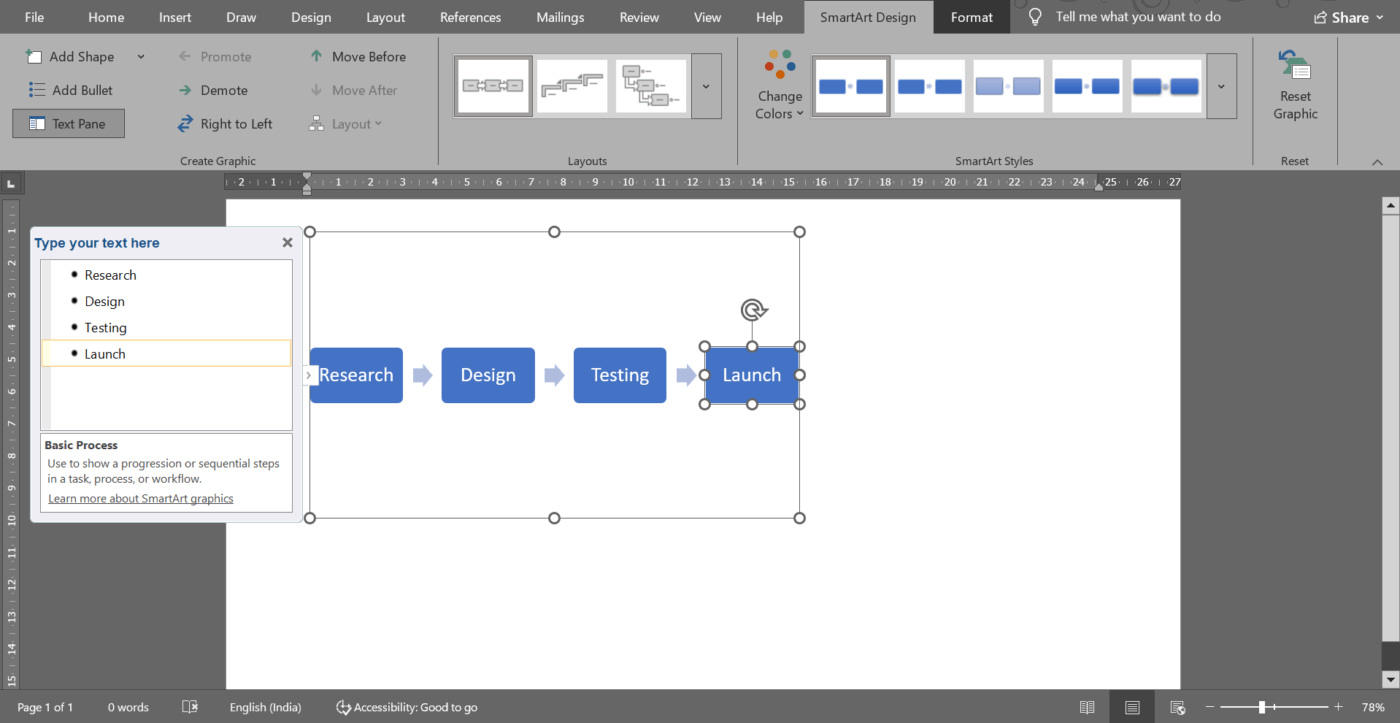
Once your timeline appears, a text pane opens on the left. This is where the real story unfolds. Click on the placeholder text and type in your milestones: dates, event titles, and short descriptions. Press Enter to add a new milestone or Shift + Enter to add extra lines within the same entry.
If you’re creating a project timeline, you might list phases like Research, Design, Testing, and Launch.
💡 Pro Tip: Lead with dates. It makes scanning easier and helps your audience follow the sequence instantly.
Your timeline is now functional, but a few tweaks can polish it further.
Use the SmartArt Design tab to change colors, switch styles, or add more shapes for additional milestones. Fonts can be adjusted for emphasis, clarity, or brand alignment.
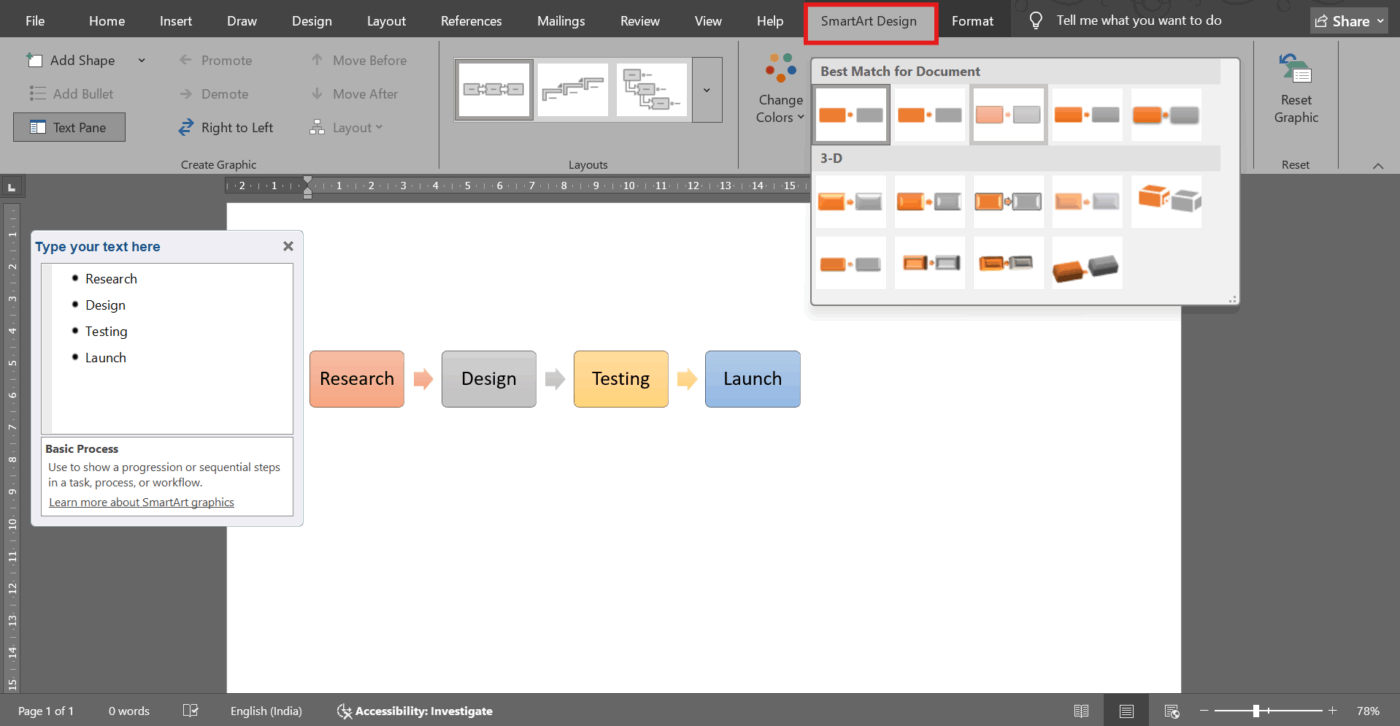
If you’re preparing something for a client or a teacher, a consistent style helps it feel intentional rather than thrown together.
💡 Pro Tip: Stick to two or three colors at most. Too many colors can distract readers from timeline events.
If your timeline needs more detail or visual separation, head to Insert > Shapes. You can add lines to mark intervals or text boxes to expand on certain events. This is helpful if some moments need a bit more explanation.
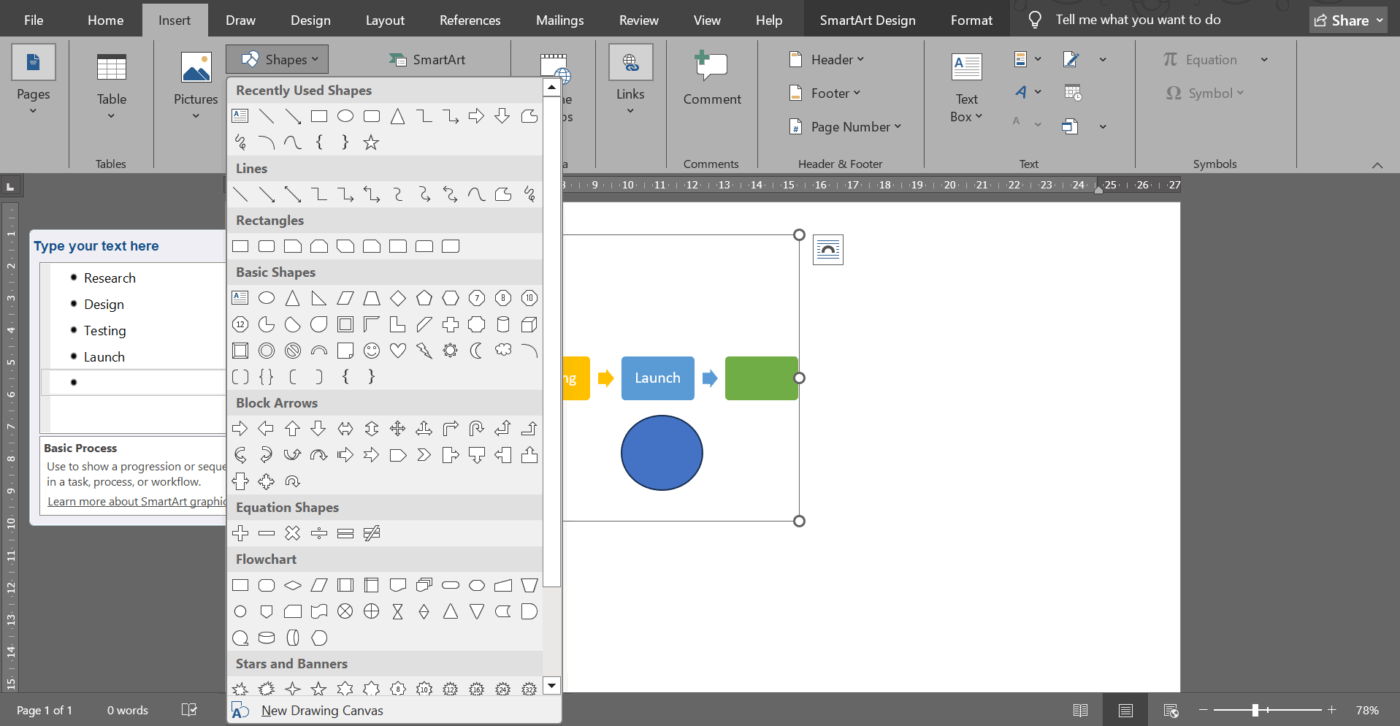
For example, in a project timeline, you might add a text box to highlight a deadline or deliverable.
However, ensure that you use text boxes sparingly. Too many floating labels can clutter your layout and make your timeline harder to read.
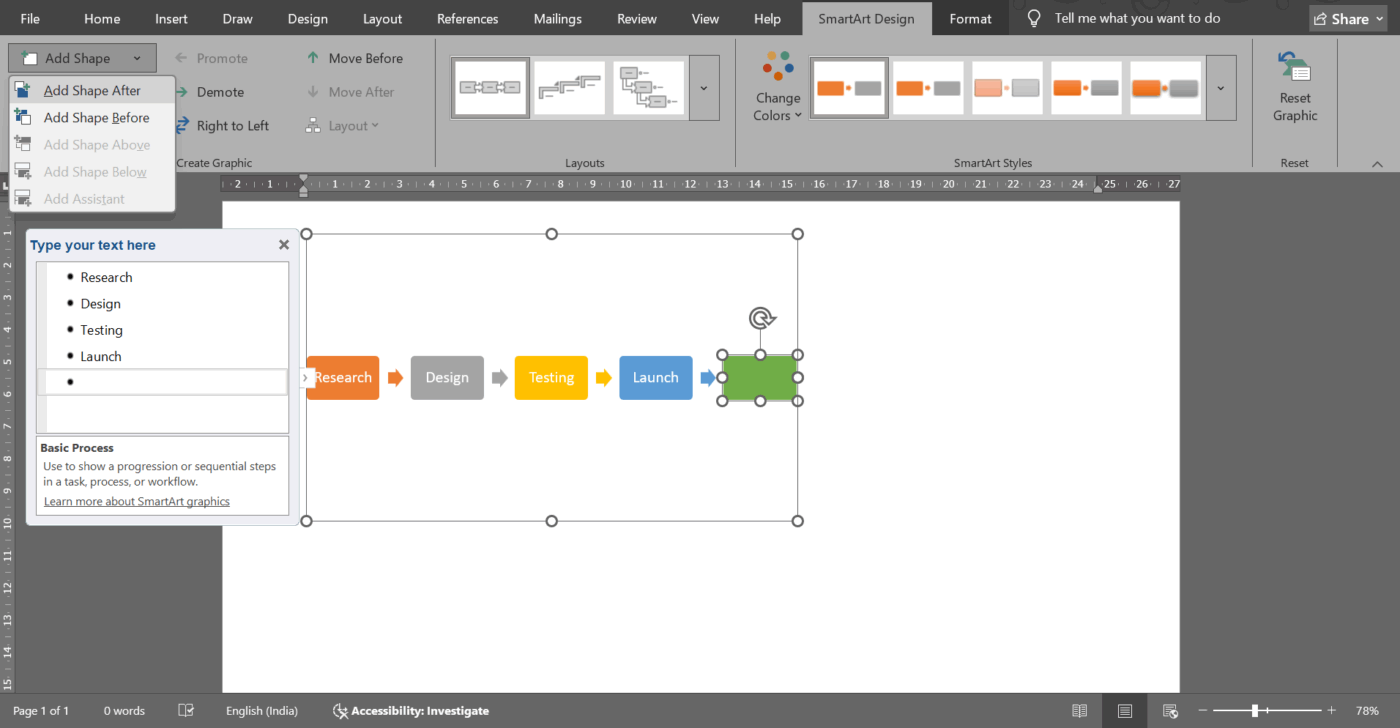
💡 Pro Tip: If you want to add more boxes to the timeline, just go to Add Shape. This way, any new elements you add have the same customizations.
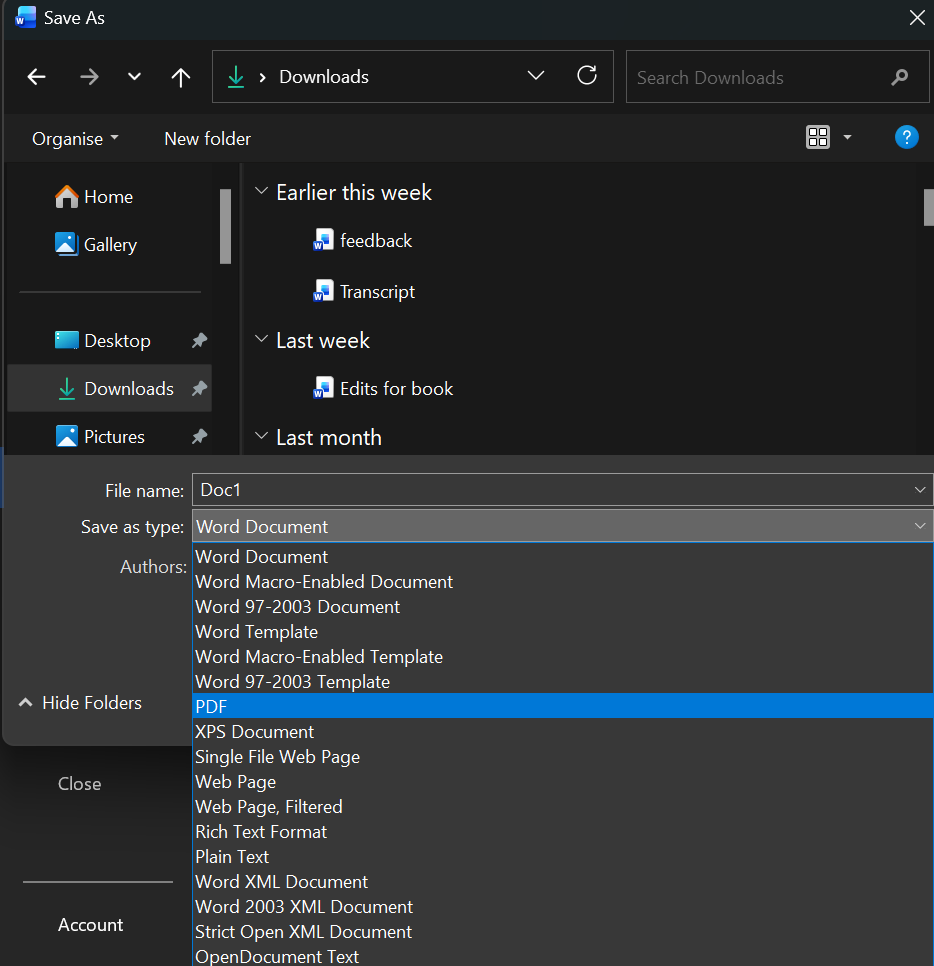
Once you’re happy with the structure and visuals, save your document and share it as needed. You can export it as a PDF for presentations, upload it to a shared drive for team collaboration, or print it for classroom use.
Don’t forget to save a copy before making big design changes. It’s much easier to revert to a clean version if your formatting experiment doesn’t go as planned.
📮 ClickUp Insight: 31% of managers prefer visual boards, while others rely on Gantt charts, dashboards, or resource views.
However, most tools require you to choose one. If the view doesn’t match the way you think, it just becomes another layer of friction.
With ClickUp, you don’t have to choose. Switch between AI-powered Gantt charts, Kanban Boards, Dashboards, or Workload View in a single click. And with ClickUp Brain, you can auto-generate tailored views or summaries based on who’s looking—whether it’s you, an exec, or your designer.
💫 Real Results: CEMEX sped up product launches by 15% and cut communication delays from 24 hours to seconds using ClickUp.
Now that the template for your project timeline is set, let’s make it clearer, sharper, and more engaging. Here’s how to enhance it visually:
🔍 Did You Know? When learners use timeline tools, which allow them to drag and drop events, their retention of cause-and-effect improves by nearly 20% compared to reading text alone.
Creating timelines in Word works well for simple visuals. However, once you try to build something more detailed (or worse, collaborative), you start to realize its limitations.
Here’s where things start getting tricky and why you often have to look for a Microsoft Word alternative:
🧠 Fun Fact: Historical research shows that creators developed multi-row timelines in the 1700s to display different rulers, states, and cultural threads side by side. This was effectively one of the first infographics showing ‘parallel histories’ instead of a single story.
Microsoft Word is great for simple timelines, but once your project grows beyond a few milestones, static layouts, limited customization, and rigid formatting come in.
ClickUp is the world’s first converged AI workspace that combines project management, documents, and team communication, all in one platform—accelerated by next-generation AI automation and search.
It gives you a fully interactive and automatically updating view of your work. Tasks move with you, dates adjust in real time, teams collaborate without version chaos, and your entire project lives in one place.
Let’s understand how to build a timeline in ClickUp! 📝
Before your timeline takes shape, everything starts with ClickUp Spaces. This is the dedicated space where all your project information will be housed. Then, add a List View, and start filling your to-do items in there as ClickUp Tasks.
Tasks are the building blocks of your ClickUp workspace, which hold assignees, due dates, comments, files, subtasks, checklists, dependencies, and even ClickUp Custom Fields tailored to your workflow.
So, your first move is simple: add the tasks you want to track.
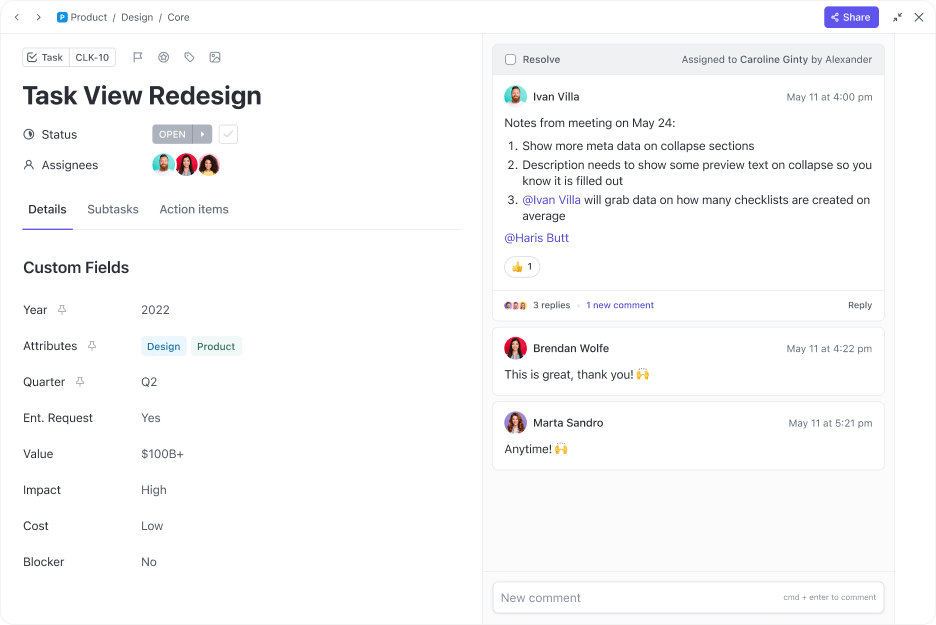
🚀 ClickUp Advantage: If your tasks need more context, like a project brief, research notes, scope outline, or requirements, the ClickUp Docs layer is in the narrative behind the work.
Instead of attaching random PDFs or linking out to scattered external docs, you can create a ClickUp Doc directly inside the same List or Folder and connect it to your Tasks. This way, your timeline is backed by living documentation that updates as your project evolves.
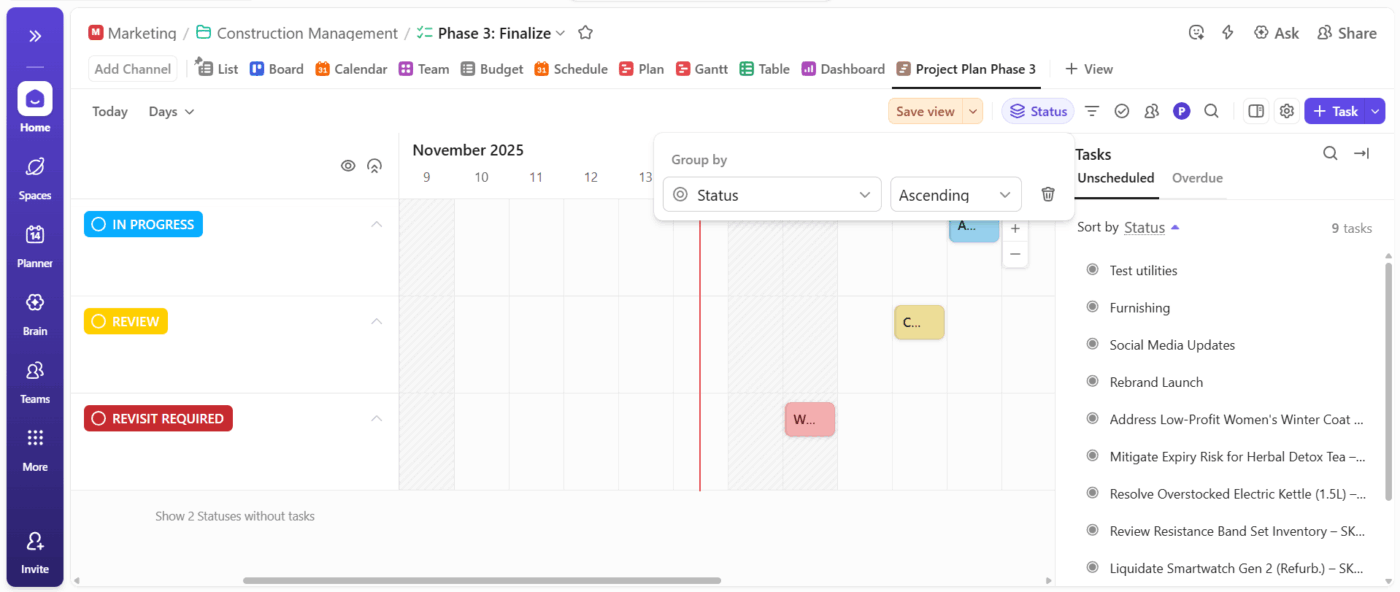
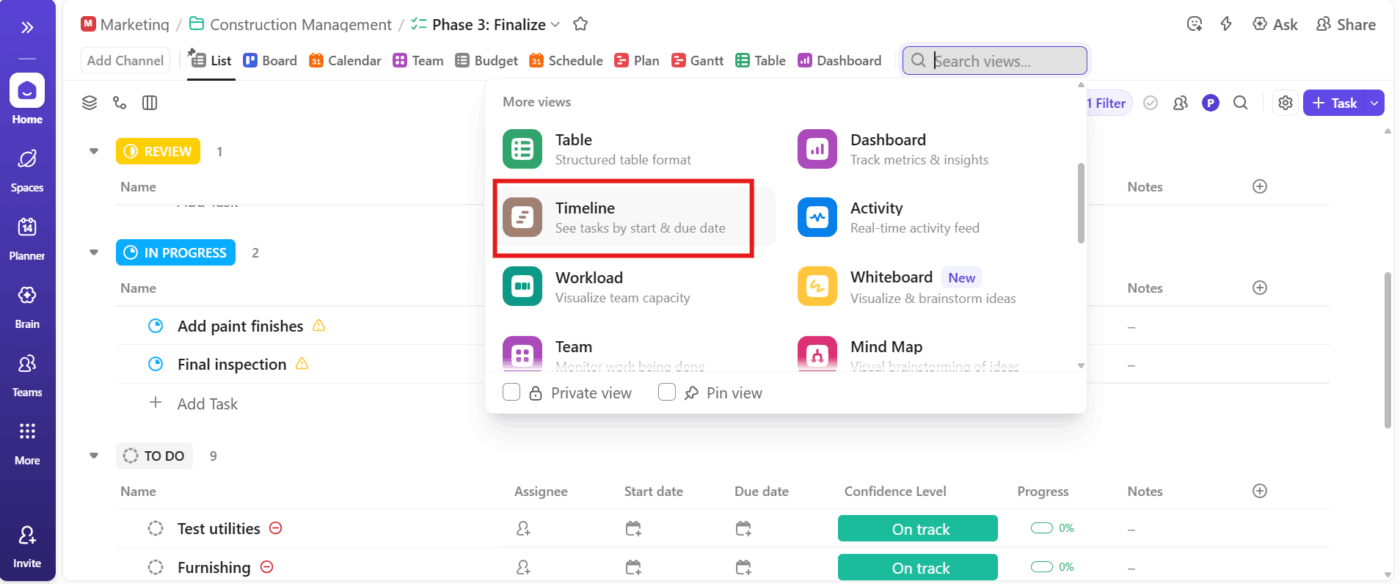
Head into the List, Folder, or Space where you want a bird’s-eye view of your Tasks. Hit + View, choose Timeline, and add it.
Your work instantly transforms into an actual visual flow you can manage at a glance with ClickUp’s Timeline View. If you handle long-running projects, set this as a default view so your team always lands on the big picture first.
🧠 Fun Fact: Joseph Priestley arranged the chart into six vertical categories like ‘Statesmen & Warriors’ or ‘Poets & Artists’, then plotted each person’s life as a bar stretched over time, so you could see who overlapped with whom and when.
Rename the timeline so it reflects what you’re tracking, like ‘Launch roadmap’ or ‘Hiring pipeline’.
Then tailor the layout: zoom into days for high-speed sprints or zoom out to months for long-term planning. Group tasks by assignee, priority, status, or department, depending on how your team thinks.
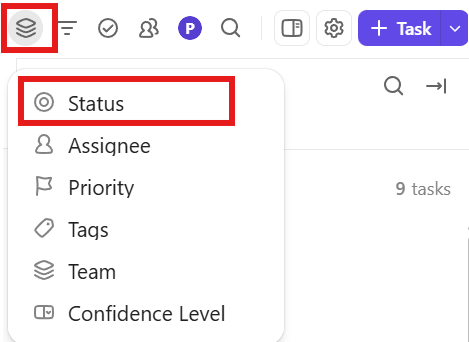
Grouping by status is ideal for progress reviews, while grouping by assignee is effective for workload balancing.
Here’s what Sam Morgan, Director of Web Operations, The Nine, had to say about ClickUp:
ClickUp has been an absolute game-changer for our team, the support they provided during our onboarding was amazing! It’s saved us countless hours of time, given us the data to allocate our resources more effectively, and kept our projects on a timeline while keeping our customers in the loop.
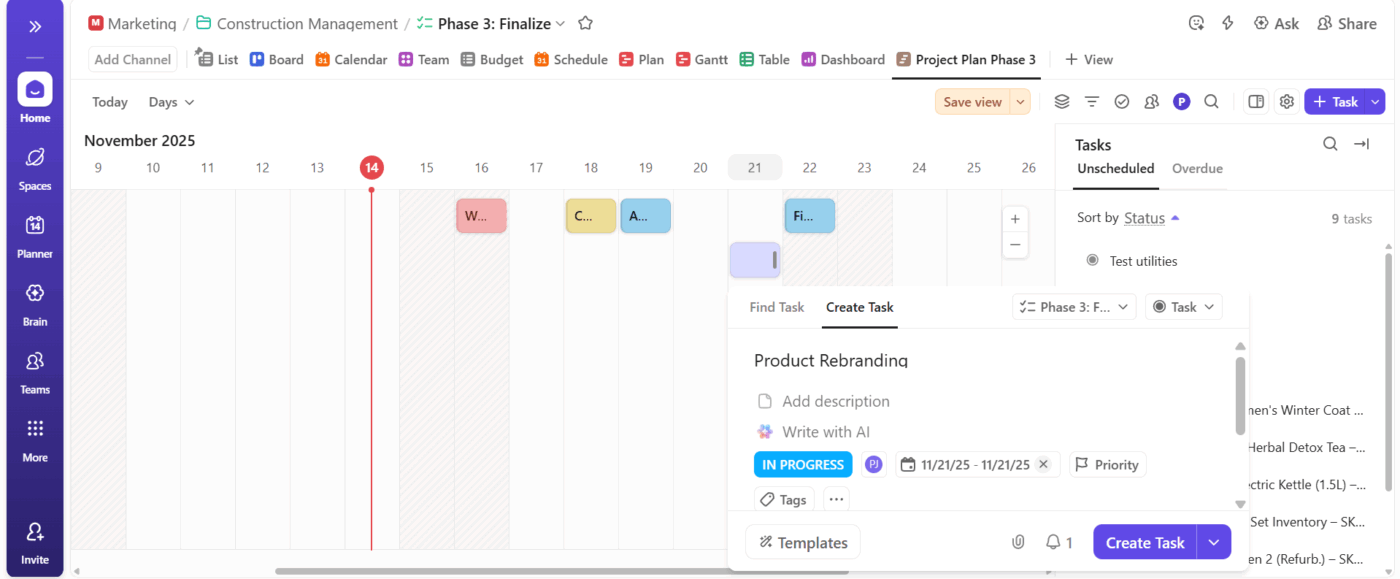
This part feels like placing magnets on a whiteboard. Just click anywhere on the timeline to add a new task. Set your start date, due date, and all other details (assignee, priority, tags).
When you need to adjust the duration, drag the edges of the taskbar to extend or shrink it without any menus.
Keep task names crisp and use Custom Fields to store details. Your timeline stays clean, and your tasks stay detailed.
Update statuses, shift dates, change priorities, or assign teammates, all inside the timeline. Drag Tasks to rearrange plans in seconds and use filters to focus only on what matters: overdue tasks, this week’s work, or one team’s workload.
💡 Pro Tip: If you’re working as part of a large team, turn on Me Mode to display only tasks assigned to you, while the assignee sidebar allows you to see others.
Once your timeline is set, turn to the ClickUp Gantt Chart View to take planning further if your work has dependencies, phases, or shifting deadlines. It lays out your entire project like a living roadmap.
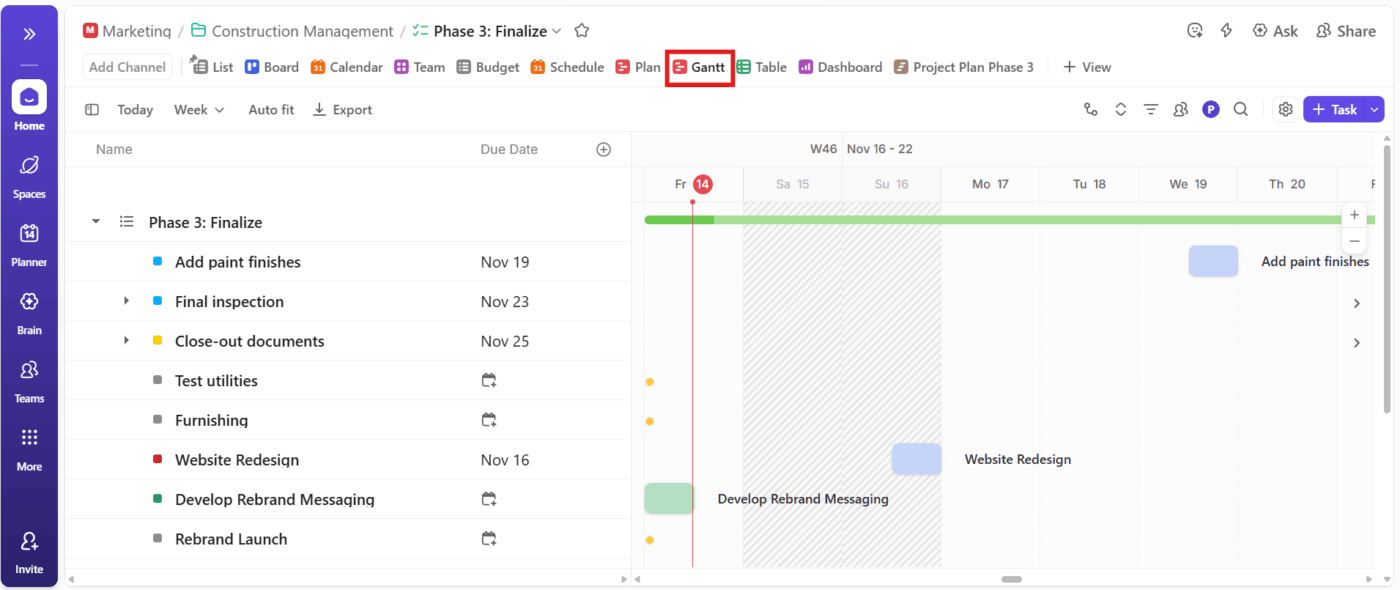
You can drag tasks, adjust dates, and watch the entire chain update automatically. Dependencies snap into place, critical paths highlight themselves, and you instantly see what needs to happen before something else can move.
Plus, watch this video to understand how timelines differ from Gantt charts:
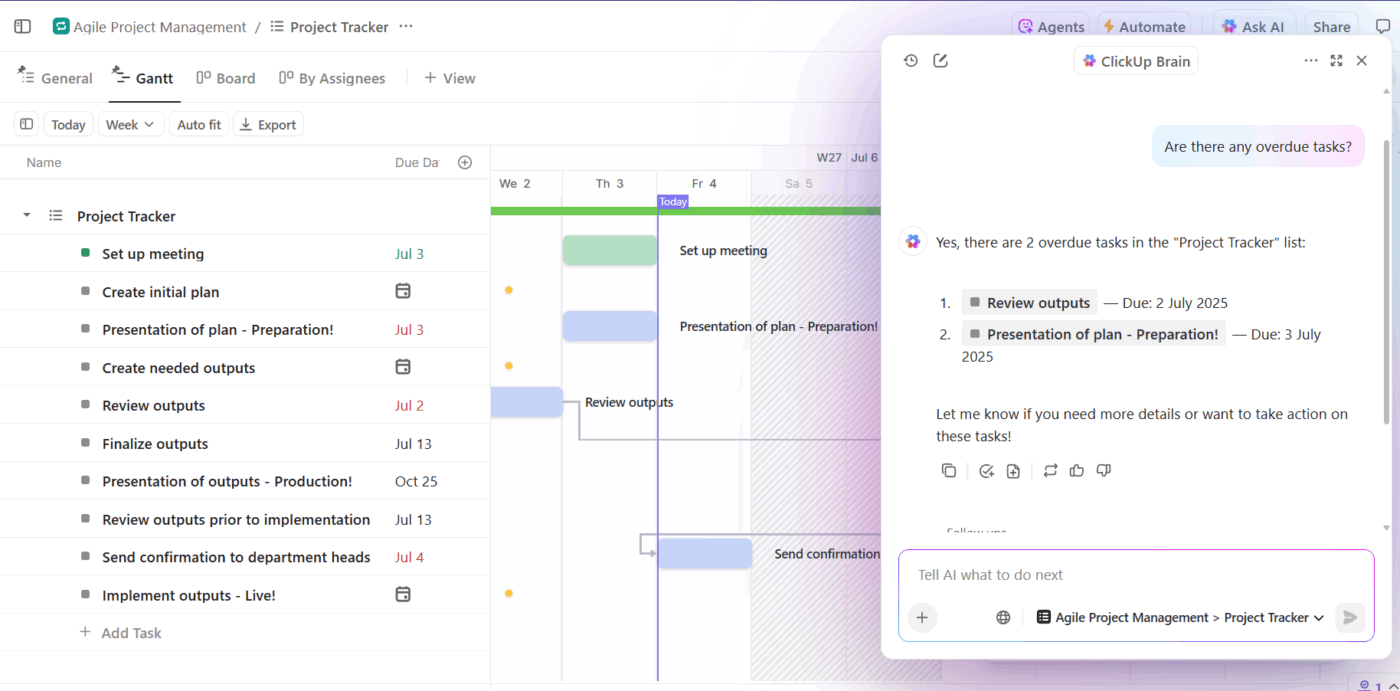
🚀 ClickUp Advantage: Connect tasks, docs, people, and knowledge with an intelligent AI layer using ClickUp Brain. It automatically tracks everything in real time so you always know what’s moving, what’s stuck, and what needs attention.
The workflow automation tool also generates standups and status updates instantly. Plus, even rough ideas, like a quick note you jotted down, can be transformed into structured project plans, complete with tasks, sub-tasks, owners, and timelines.
Here are some example prompts you can try:
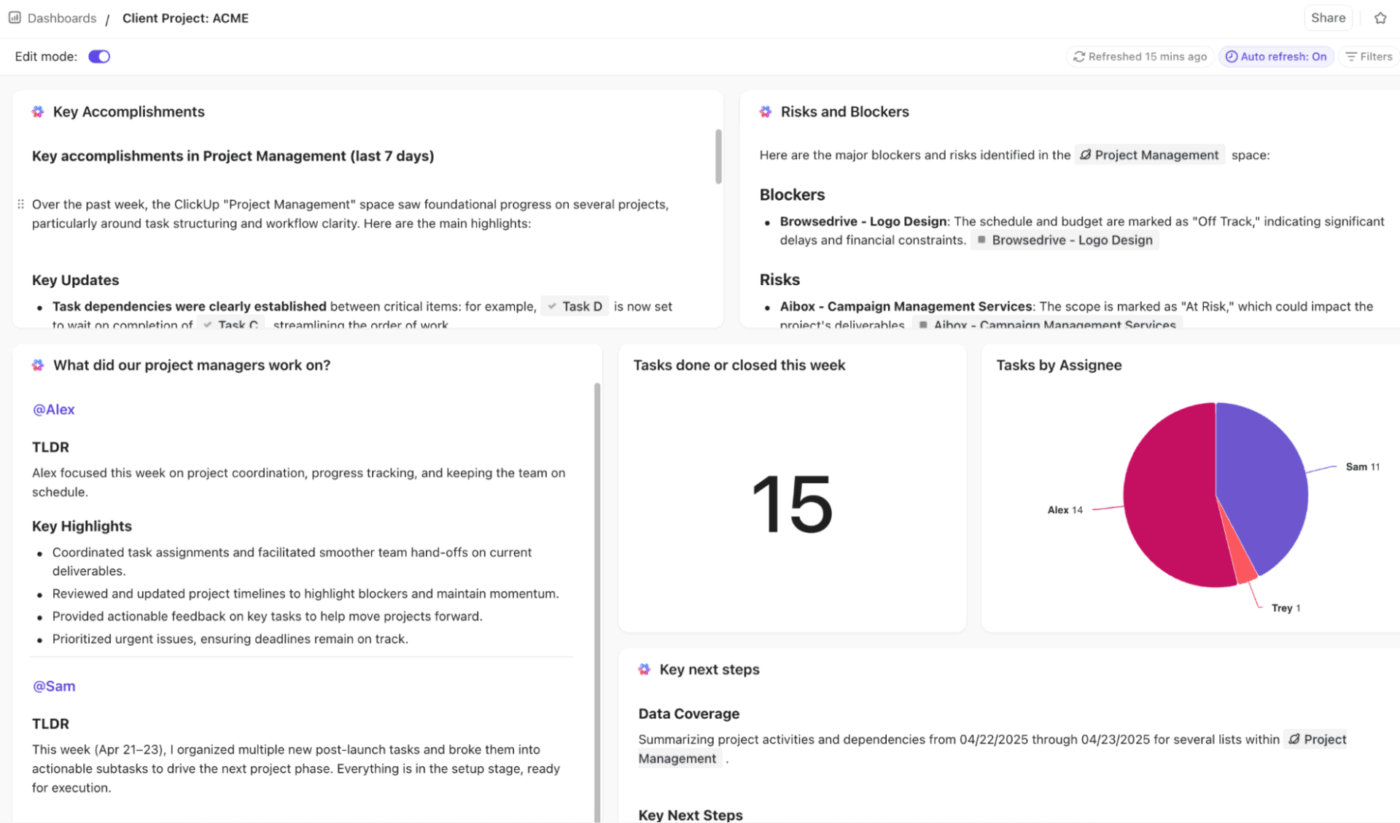
Once everything’s in place, ClickUp Dashboards centralize everything into a command center. They pull real-time data from your tasks, docs, goals, and timelines to give you a live snapshot of your entire project.
You can track workload, progress, budgets, time spent, blockers, upcoming deadlines, and even embed your ClickUp Timeline or Gantt inside the dashboard.
Here are some custom cards you can add:
And now, one of the most powerful additions: ClickUp Brain’s AI Cards. They summarize updates, flag risks, show project insights, and even highlight patterns you might miss. You can simply prompt it to send you AI-generated takeaways like ‘Tasks trending behind schedule’ or ‘Upcoming deadlines to watch.’
By now, we know how far you can push Microsoft Word to build a serviceable timeline. It works for quick, simple visuals, but once your projects get bigger, more layered, or require collaboration, Word starts acting like a roadblock.
ClickUp gives you a workspace built for real project movement with dynamic views, drag-and-drop timelines, Gantt charts, Dashboards, AI-powered updates, and documentation all in one place.
Create timelines that update with your projects by signing up to ClickUp for free today! ✅
Yes, you can create a vertical timeline in Word using SmartArt graphics or templates. Built-in templates allow events and tasks to be listed top to bottom in a linear fashion, which is easy to follow and takes up less horizontal space.
For project timelines in Word, the best SmartArt layout is often the ‘Basic Timeline’ found under the Process category in the SmartArt gallery. It’s simple and clearly displays milestones and dates in chronological order, making it great for showing project phases and key events visually.
To create a milestone timeline in Word, go to the Insert tab, click on SmartArt, select the Process category, and choose a timeline graphic like the Basic Timeline. After inserting it, customize the timeline by adding dates, task descriptions, and milestones in the text pane or directly on the graphic shapes. You can also format colors and styles to highlight important milestones.
No, you can’t export Word timelines into PowerPoint. However, you can copy the timeline graphic or content and paste it into PowerPoint.
Some of the best alternatives to Word for creating interactive timelines include ClickUp, Tiki-Toki, and Precceden. Design platforms like Canva and specialized timeline tools like TimelineJS, also work well.

Manasi Nair
Max 25min read

Praburam Srinivasan
Max 18min read

Arya Dinesh
Max 11min read

© 2026 ClickUp


