


Still downloading templates?
There’s an easier way. Try a free AI Agent in ClickUp that actually does the work for you—set up in minutes, save hours every week.
Sorry, there were no results found for “”
Sorry, there were no results found for “”
Sorry, there were no results found for “”

Ever felt like you’re leading an expedition through a dense jungle of spreadsheets, machete in hand, desperately searching for signs of project progress?
Your team is asking, “Are we there yet?”
Clients are sending increasingly pointed emails, and stakeholders are demanding a map.
You could spend hours hacking through rows and columns, translating raw data into understandable project updates. But there’s a better way!
If you’re already using Google Sheets for project management, why not transform those numbers into visual progress bars—like giving your spreadsheet a built-in GPS with colorful trail markers?
This guide will show you how to create progress bars in Google Sheets step by step.
A progress bar chart gives you a quick visual snapshot of task completion or goal achievement. Let’s walk through the steps to make a clean, clear, and useful progress bar chart in Google Sheets.
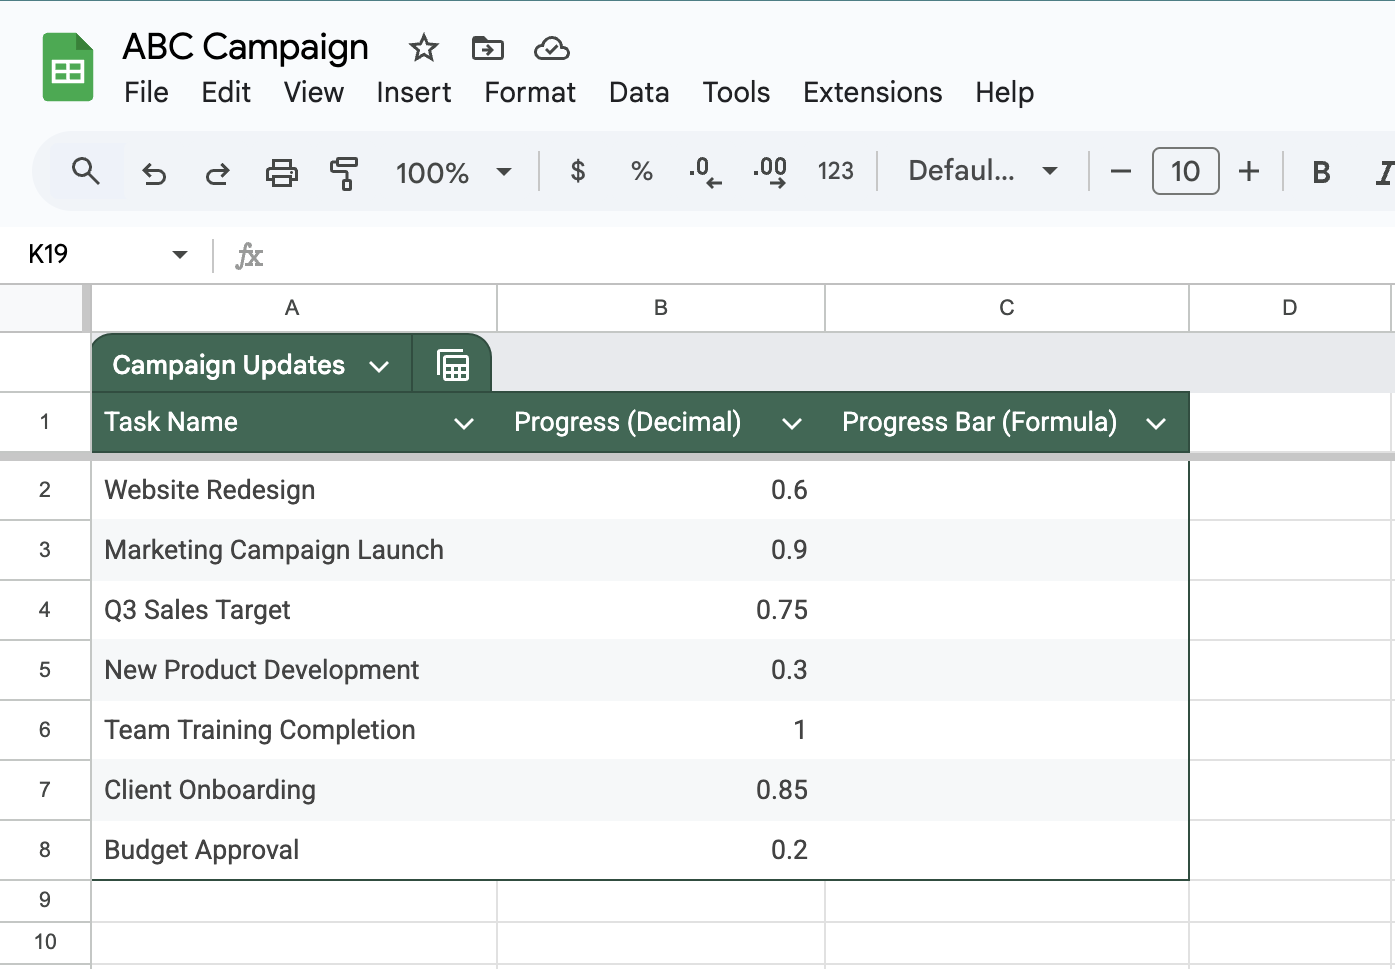
First, you’ll need to enter the numbers that your progress bars will show. These are usually percentages showing how far along different tasks or goals are.
👀 Did You Know? The human brain processes visual information 60,000 times faster than text, making visual progress trackers highly effective.
📖 Also Read: How to Create a Gantt Chart in Google Sheets
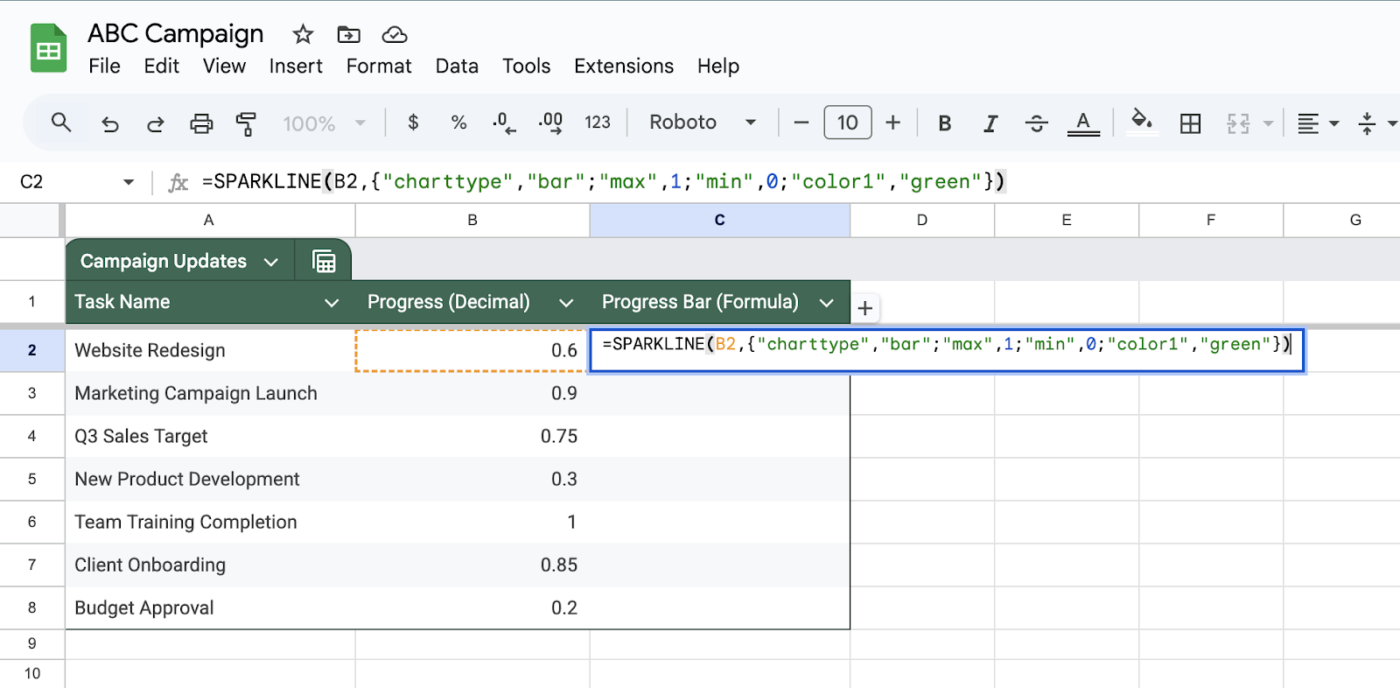
Here’s where the SPARKLINE function comes in. This nifty function creates mini-charts right inside your cells.
=SPARKLINE(B2,{“charttype”,”bar”;”max”,1;”min”,0;”color1″,”green”})
The formula breaks down like this:
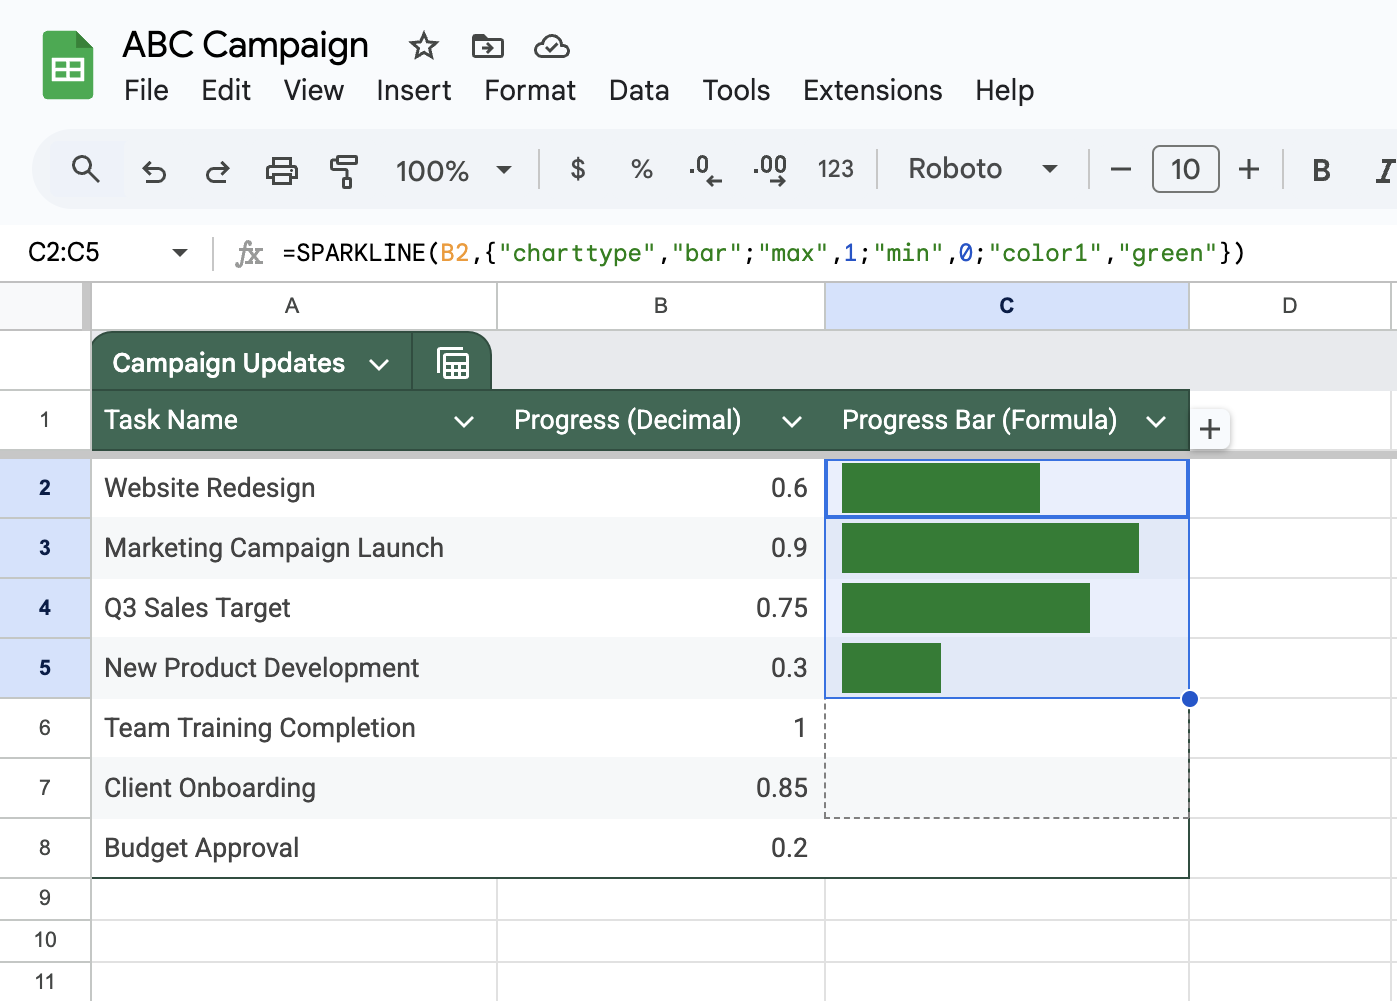
Now that you’ve got one progress bar working, copy it to the other rows in that column.
👀 Did You Know? After three days, we remember 65% of visual information, compared to just 10% of auditory information.
📖 Also Read: How to Create a Google Sheets Dashboard
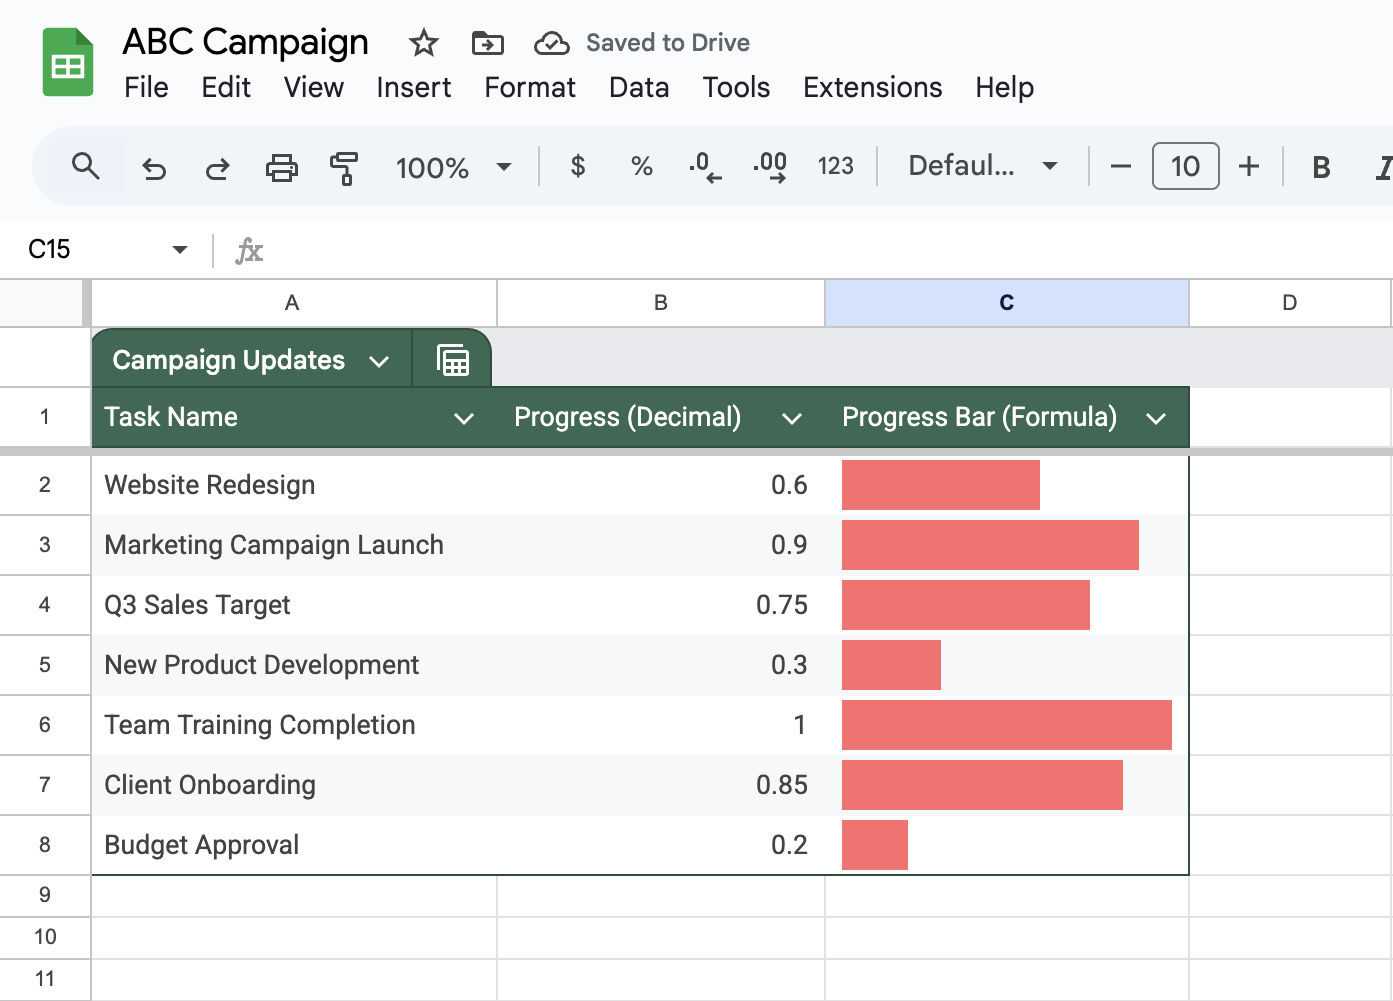
Want to make your progress bars more eye-catching? Try these tweaks:
=SPARKLINE(B2,{“charttype”,”bar”;”max”,1;”min”,0;”color1″,”#FF6B6B”})
Replace “green” with any color name or hex code
=SPARKLINE(B2,{“charttype”,”bar”;”max”,1;”min”,0;”color1″,”green”;”rtl”,false;”width”,4})
Change the “width” number to make bars thicker or thinner
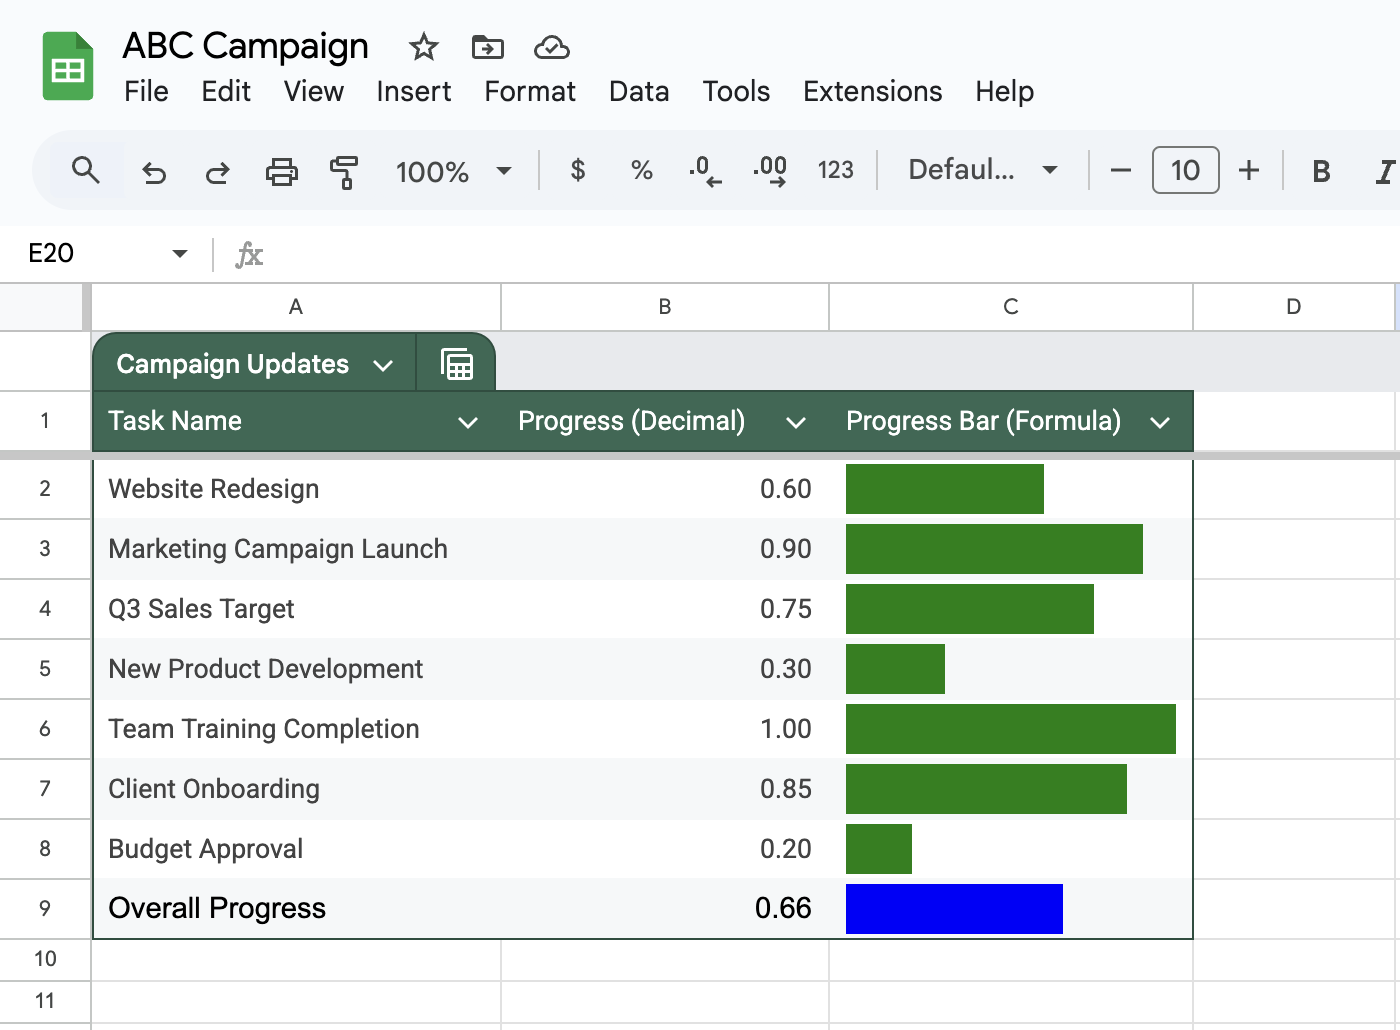
Want to see total progress across all tasks? Add an average progress bar:
=AVERAGE(B2:B8)
=SPARKLINE(B9,{“charttype”,”bar”;”max”,1;”min”,0;”color1″,”blue”})
🧠 Fun Fact: Individuals who monitor their progress are twice as likely to achieve their goals within a year.
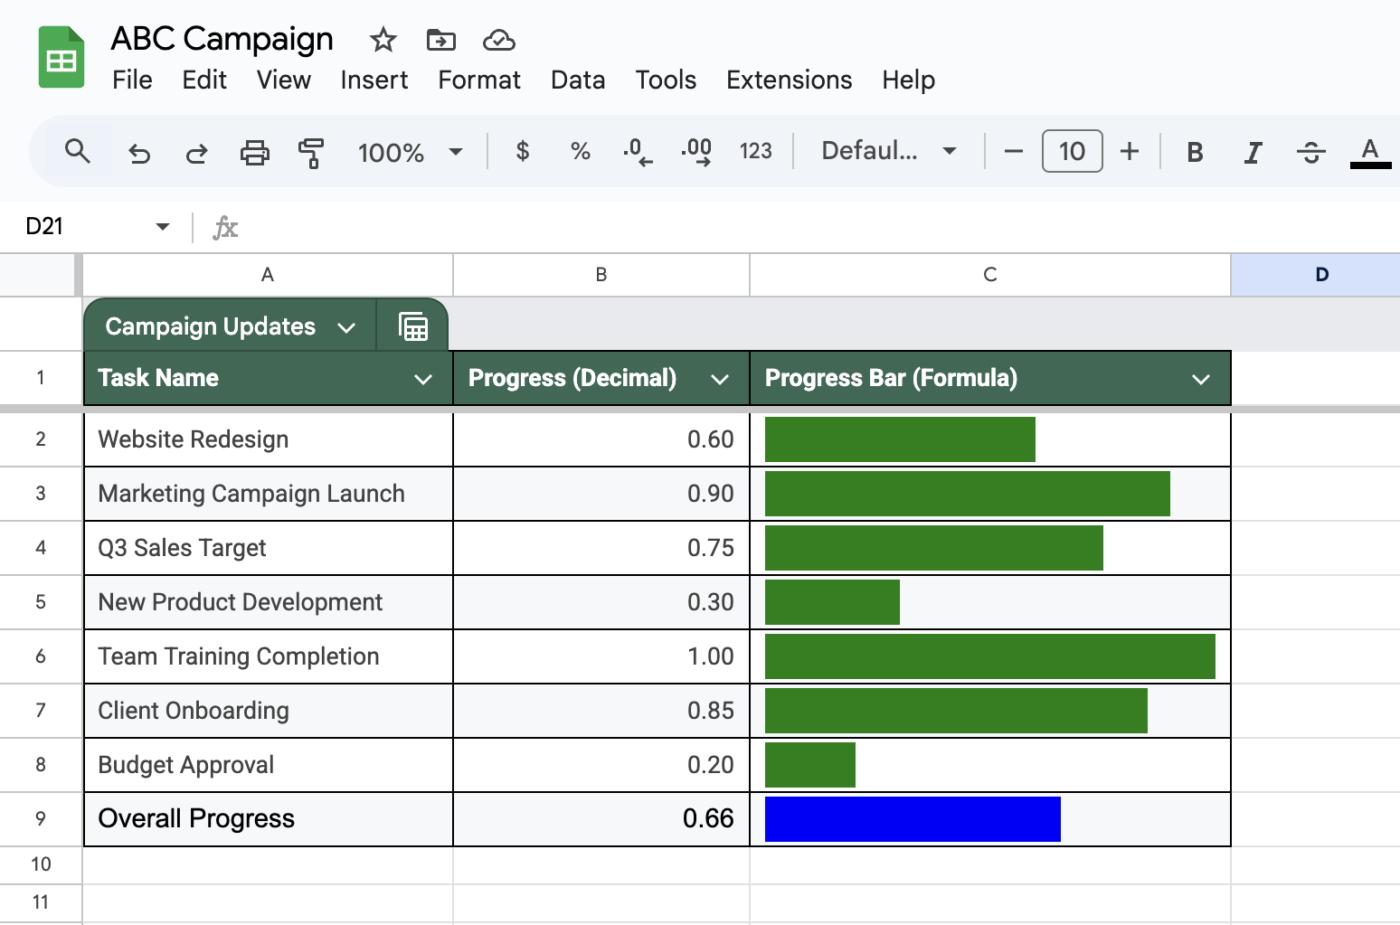
Make your progress tracker easier to read:
📖 Also Read: Top Project Management Charts
While making a progress bar in Google Sheets is handy, this approach comes with several key constraints. Let’s look at five main limitations you should know about before diving into your project:
📮 ClickUp Insight: ClickUp’s research shows that low-performing teams are 4 times more likely to juggle 15+ tools, while high-performing teams maintain efficiency by limiting their toolkit to 9 or fewer platforms.
But how about using one platform? As the everything app for work, ClickUp brings your tasks, projects, docs, wikis, chat, and calls under a single platform, complete with AI-powered workflows. Ready to work smarter? ClickUp works for every team, makes work visible, and allows you to focus on what matters while AI handles the rest.
Tracking tasks and project milestones can get messy without the right tools. But the good news? You don’t need to stick with Google Sheets.
ClickUp, the everything app for work, offers several powerful ways to monitor progress and keep everyone in sync.
ClickUp Dashboards simplify tracking progress on individual tasks and more significant projects. Here’s how to set up a progress-tracking system:
The field appears on each task, allowing team members to update percentages as work progresses—giving you clear visuals of task status at a glance.
This works great for tasks where progress is quantified. For instance, if you’re working on a lengthy report and have completed 60% of the first draft, you can visually represent that progress.
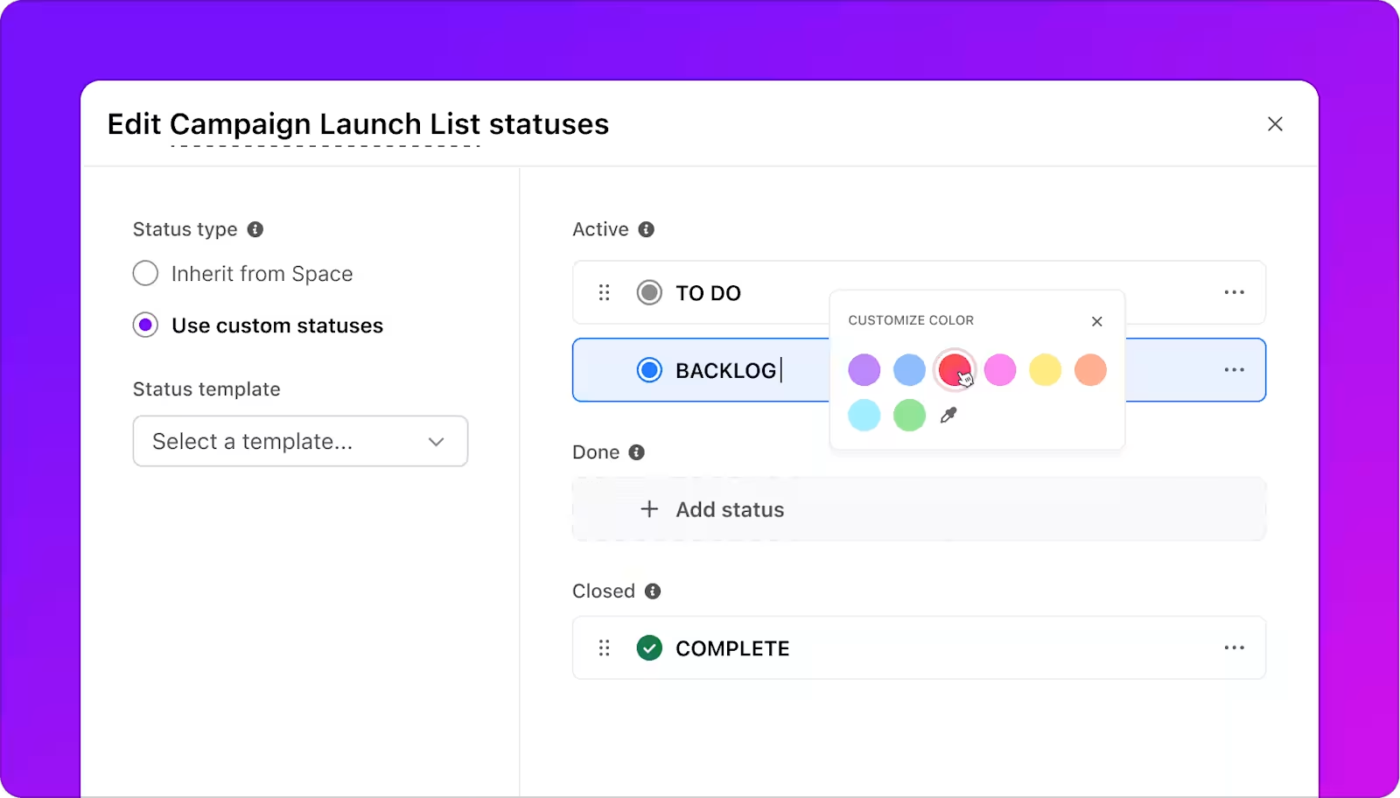
Want progress bars that update themselves? Set up status-based tracking:
Create custom statuses such as ‘Not Started’ (0%), ‘In Progress’ (50%), ‘Review’ (80%), and ‘Complete’ (100%) to track task progress.
As tasks move through statuses, progress bars fill automatically—eliminating the need for manual updates.
For example, when your designer moves a logo task from ‘In Progress’ to ‘Review,’ the progress jumps from 50% to 80% automatically.
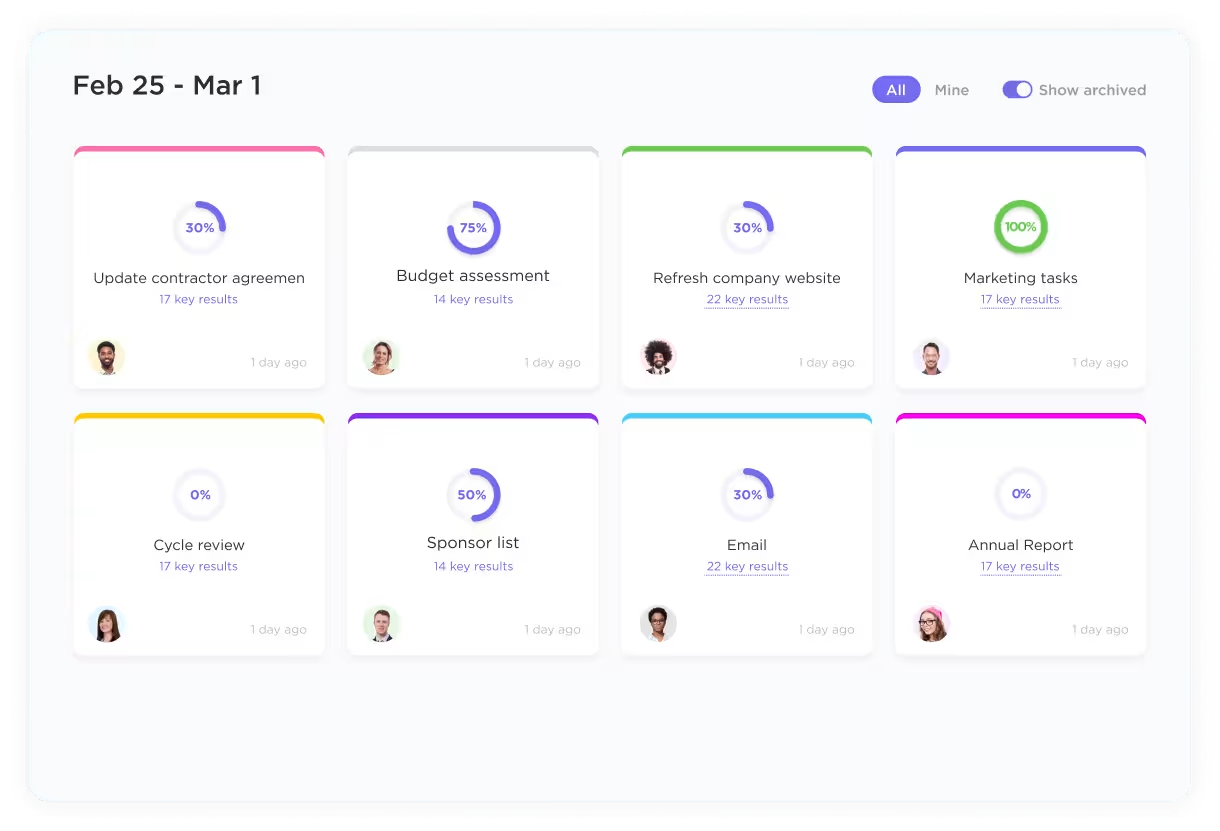
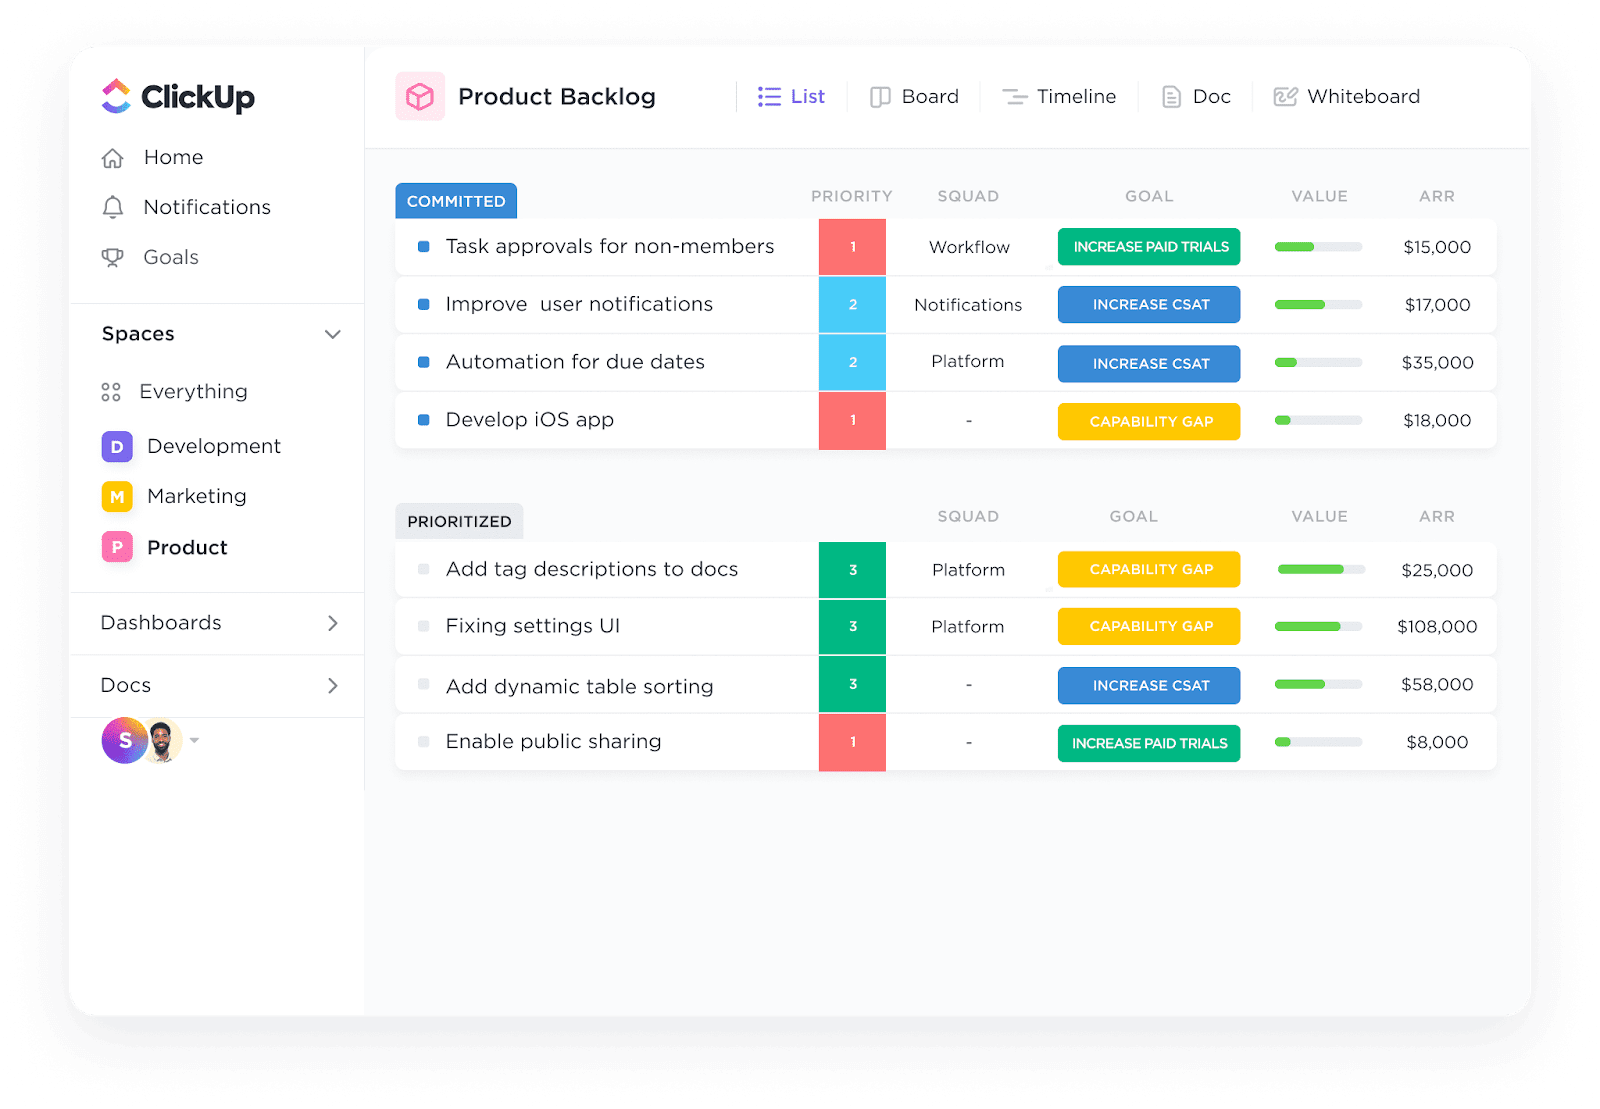
ClickUp Goals help track bigger-picture progress. Set up measurable targets that connect directly to your tasks:
Goals automatically update with linked task completion, showing percentages and helping you spot bottlenecks early.
Say you’re launching a new product. Create a goal with targets for design, testing, and marketing tasks. As your team completes each task, the goal progress updates automatically.
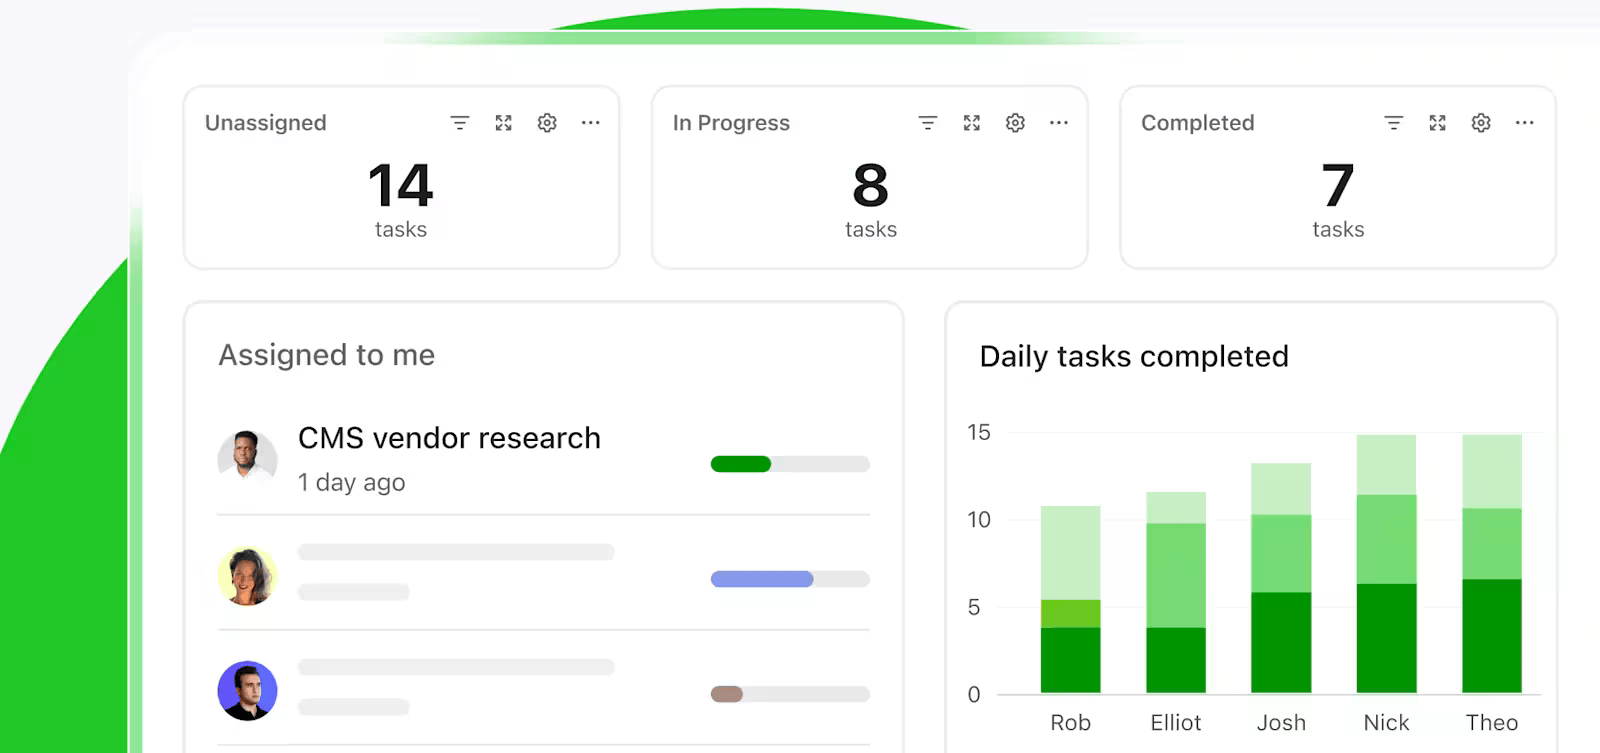
Create custom task dashboards with ClickUp Dashboards to see progress across projects at a glance:
For instance, a marketing team might set up a dashboard showing:
Without digging through multiple views, everyone gets a clear picture of where things stand.
💡 Pro Tip: Create saved dashboard layouts for different needs—like a daily task tracker for stand-ups, another for client updates, and a third for executive reviews.
Templates save you hours of setup time and ensure consistent tracking for project management. Let’s check out some handy templates that take the hassle out of progress tracking.
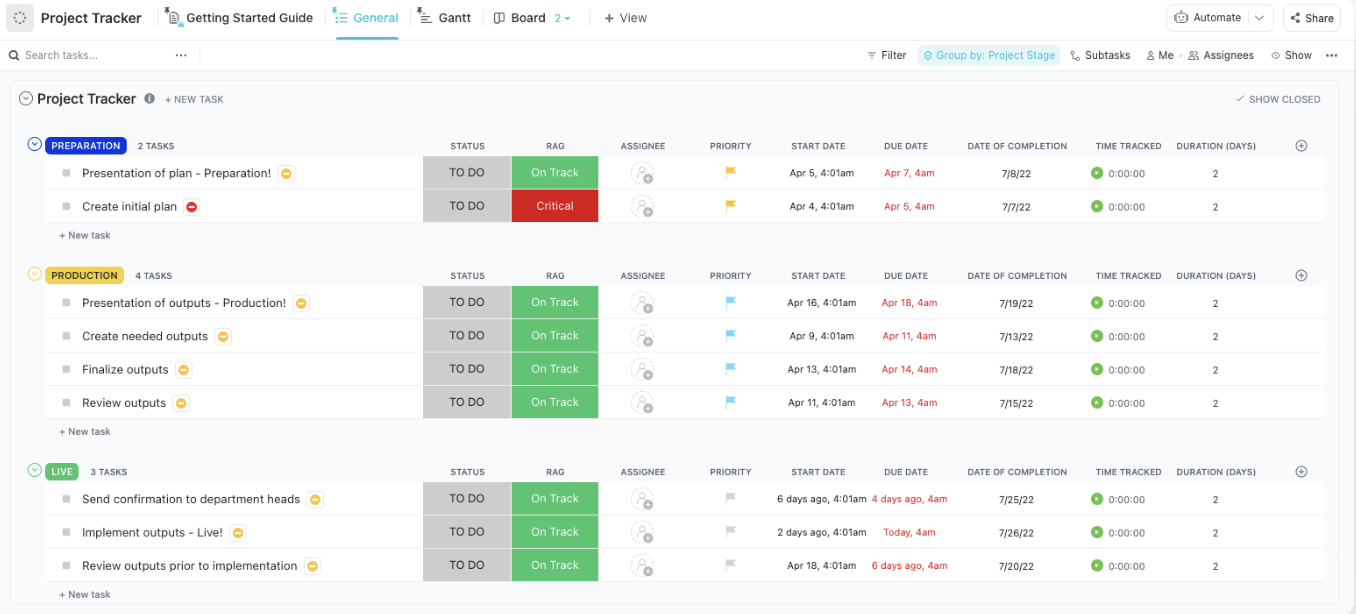
The ClickUp Project Tracker Template helps teams monitor project milestones and deadlines in one central spot. Here’s what makes it useful:
Teams can add their own Custom Fields to track metrics specific to their projects. For example, a software team might add fields for bug severity, test coverage, and quality scores.
The ClickUp Project Progress Report Template makes it easy to create stakeholder-ready updates. It’s got built-in sections for status overviews, milestone tracking, risk documentation, and resource allocation.
Ideal for monthly or quarterly reviews, the template lets teams add charts, graphs, and status indicators to communicate progress clearly.
Meanwhile, the ClickUp SMART Goals Template helps break down big objectives into measurable targets—perfect for tracking goals like ‘Increase website traffic by 25% in Q2’ with due dates, priorities, and success metrics.
For project timelines, the ClickUp Simple Gantt Template offers a visual overview of tasks, dependencies, and critical paths. Teams can easily drag and drop tasks to adjust schedules and spot conflicts early.
💡 Pro Tip: Save your customized templates for future projects to maintain consistency across your team.
Google Sheets progress bars get the job done—until they don’t. ClickUp makes tracking progress seamless with automated status updates that instantly adjust progress bars as tasks move forward, without any formulas or manual updates.
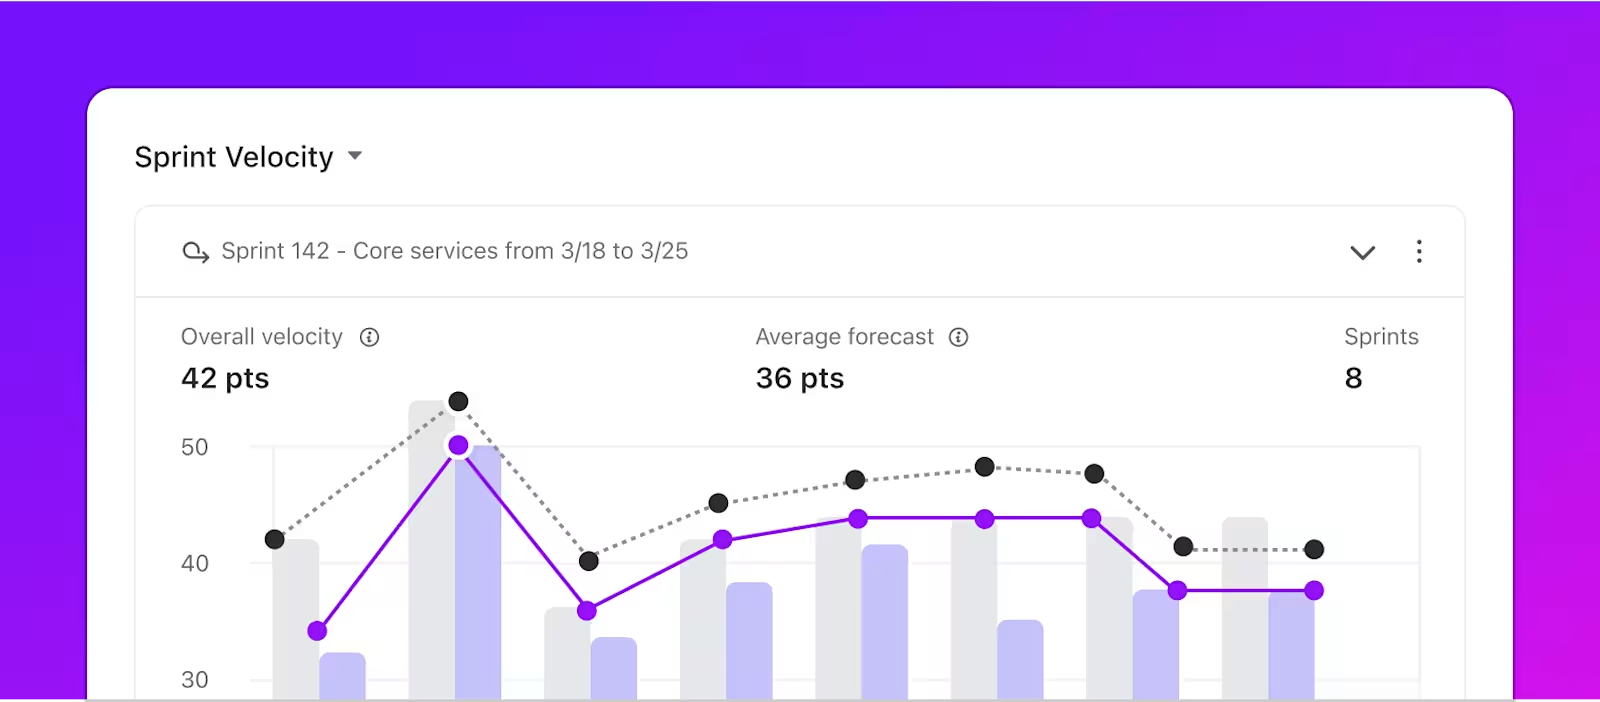
ClickUp offers circle indicators, burndown charts, and custom widgets that match your brand and make progress crystal clear. Visualize progress your way, whether you’re using task lists, Kanban boards, or timelines.
With Custom Fields, you can track story points, budgets, or any metric that matters—while ClickUp syncs updates from multiple team members in real time. Why wrestle with spreadsheets when you can let ClickUp do the heavy lifting?
“Tracking and organization of company projects is very easy and effective with ClickUp software. From simple lists to complicated projects, ClickUp software has been used to get things done as expected. It is a very effective software when addressing task management problem and tracking the progress of organization ongoing tasks and projects.”
Creating Google Sheets progress bars opens up exciting possibilities for tracking project progress, but why stop there? When managing complex projects and keeping everyone aligned on goals, you’ll want a tool that goes beyond basic data visualization.
That’s where ClickUp comes in. Built for teams who need crystal-clear progress tracking, ClickUp offers powerful features that make project management a breeze. In real time, you can create custom dashboards with over 50 widgets to monitor project health, view team capacity, and track milestones.
The best part? You’re not locked into rigid systems. ClickUp gives you the freedom to customize everything—from automation rules to task templates—ensuring the platform grows with your team’s needs.
Ready to take your progress tracking beyond basic spreadsheet bars? Try ClickUp for free today and see why teams love having all their project management tools in one place.

© 2026 ClickUp

There’s an easier way. Try a free AI Agent in ClickUp that actually does the work for you—set up in minutes, save hours every week.