


Still downloading templates?
There’s an easier way. Try a free AI Agent in ClickUp that actually does the work for you—set up in minutes, save hours every week.
Sorry, there were no results found for “”
Sorry, there were no results found for “”
Sorry, there were no results found for “”

You might be thinking client reporting is one of those agency-life evils nobody warned you about.
But it’s also one of the fastest ways to build trust, keep decisions moving, and make ROI obvious.
When reporting becomes inconsistent, everything gets harder: you spend more time fixing reports than improving results, approvals stall, and clients start questioning what they’re paying for.
Below, we’ll break down the hidden costs of inconsistent client reporting—and how to fix them with standardized templates, automated dashboards, and smarter reporting workflows.
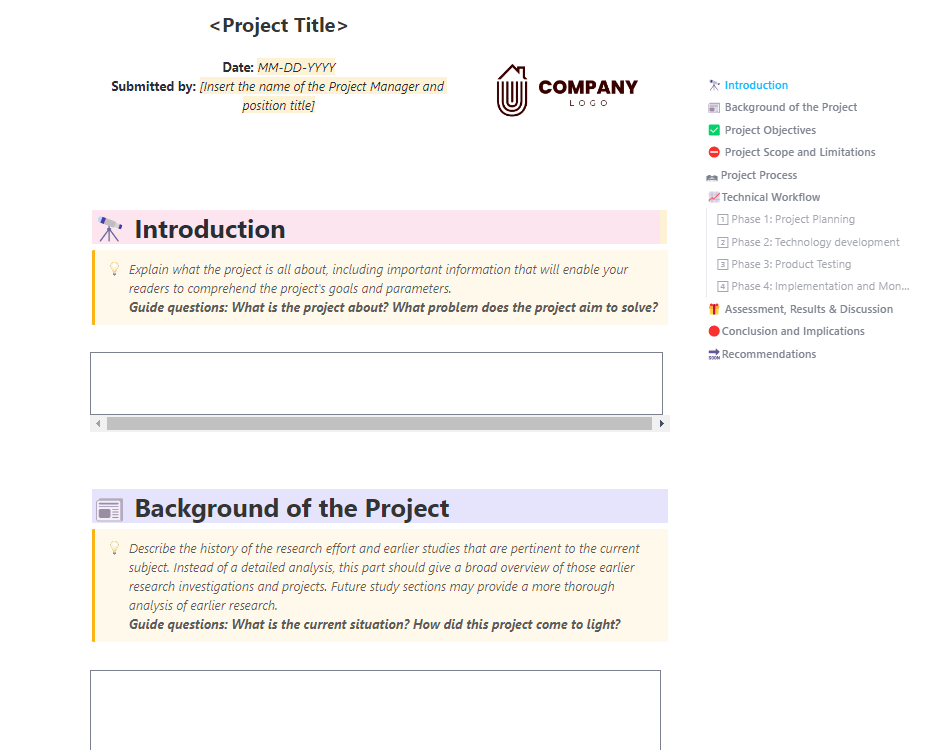
When you kick off a new project, you shouldn’t be reinventing your reporting structure from scratch. ClickUp’s Professional Report Template gives you a ready-made framework for documenting goals, scope, workflows, and results—so every report looks consistent and client-ready.
If you still think of reporting as an afterthought, here’s what it’s costing your brand reputation:
Clients lose transparency into agency activities and results when they have to chase reports. When those reports (already late) arrive unstructured, incomplete, and incorrect, your clients will probably question the agency’s ability to deliver results.
✅ What to do: Decide the cadence—will you be sending weekly/bi-weekly/monthly reports and set the day or date for the same. And which KPIs (key performance indicators) will be included
Mention this during client onboarding so that the client knows what to expect and when.
Inconsistent formatting makes it difficult for your clients to track progress and compare data over time. Say one month you highlight leads, the next highlights MQLs, and the next focuses on impressions.
The client might assume the agency is hiding poor performance behind changing formats.
✅ What to do: Create a standard reporting dashboard that tracks the same KPIs every month so clients see progress consistently.
Use this client dashboard as the single source of truth across all reports and reviews.
Watch this video to see how to create a project dashboard in under 15 minutes.
Without a standard reporting process, your team ends up reinventing the wheel every month.
Account managers chase screenshots, analysts patch together inconsistent data, and project managers spend hours clarifying why two reports don’t match.
Add this to all the accounts your agency is managing, and the effort multiplies.
All that time spent cleaning up reports is time your team could use to focus on strategy, optimization, and client management.
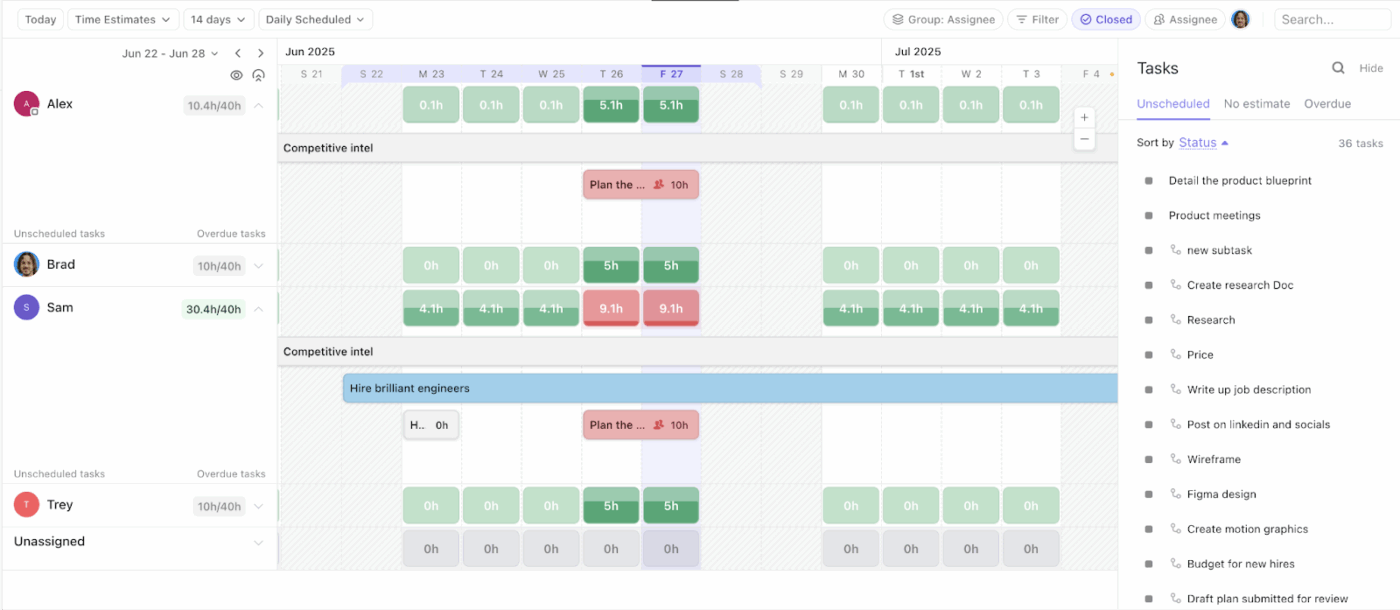
✅ What to do: Create a unified reporting process using ClickUp’s Workload View to see exactly who is handling reporting tasks and where capacity is stretched. This helps you assign reporting responsibilities evenly and avoid overloading specific team members.
📮 ClickUp Insight: 21% of people say more than 80% of their workday is spent on repetitive tasks. And another 20% say repetitive tasks consume at least 40% of their day.
That’s nearly half of the workweek (41%) devoted to tasks that don’t require much strategic thinking or creativity (like follow-up emails 👀).
ClickUp AI Agents help eliminate this grind. Think task creation, reminders, updates, meeting notes, drafting emails, and even creating end-to-end workflows! All of that (and more) can be automated in a jiffy with ClickUp, your everything app for work.
💫 Real Results: Lulu Press saves 1 hour per day, per employee using ClickUp Automations—leading to a 12% increase in work efficiency.
Clients depend on reports to make informed decisions about budgets, campaigns, creative direction, and prioritization. If reports arrive late, it impacts both sides:
✅ What to do: Build client dashboards that update in real time so clients have access to verifiable data whenever they need it.
Picture this: Your marketing agency has been improving the client’s cost per lead (CPL) for six straight months. Since each report uses a different layout and highlights different KPIs, the client never sees the complete improvement trajectory.
What they see are isolated and disconnected snapshots.
✅ What to do: Create quarterly or annual summary reports that show cumulative progress over time. Highlight the strategies that worked and compare the key metrics to baseline goals. Schedule a 30-minute call with your client and walk them through the report. This is an opportunity for stakeholders to ask questions and get answers quickly.
👀 Did You Know? Nearly 15% of agency-client relationships end due to misaligned expectations and communication gaps.
Client reporting doesn’t have to be painful. Here’s how to build a consistent reporting system that saves time, improves decision-making, and strengthens client trust.
Clients expect their weekly and monthly reports to follow consistent formats. Start by standardizing that.
A report, regardless of its nature, should answer these three basic questions:
Now, design your template with scannable layouts that answer these questions. Make the KPIs instantly visible (easy to spot). Add space for visuals such as charts and graphs. And leave space for narratives and key insights.
Within ClickUp, you get pre-built KPI and reporting templates. All you need to do is plug and play your data.
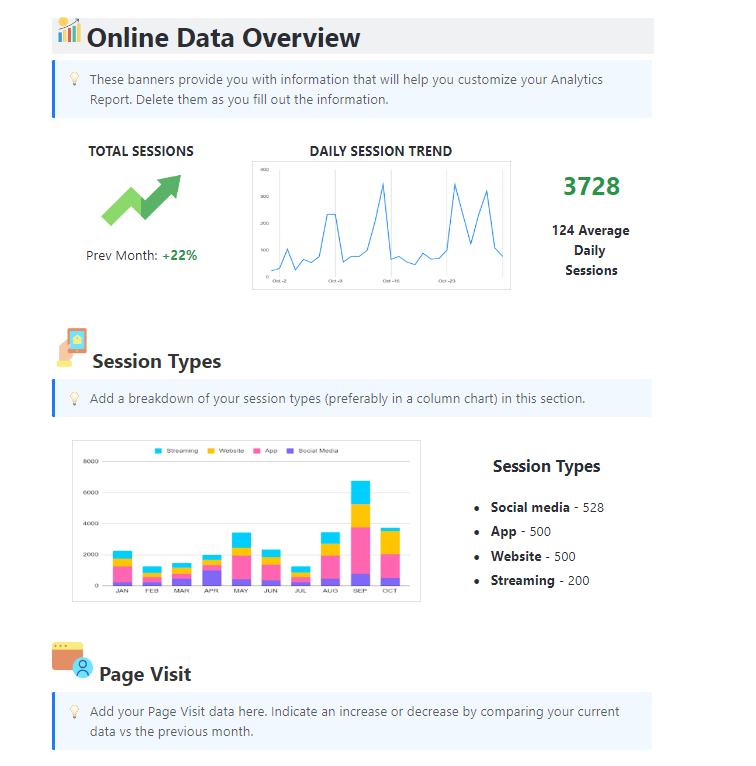
ClickUp Analytics Report Template gives you pre-built sections for a data overview, depending on the metrics you want to report.
Let’s take an example. Create a client portal to show website efficiency. Highlight session types, page visits, conversions, and other KPI.
Use ClickUp’s Professional Report Template to define a clear project scope from the beginning.
The template includes sections for project timelines, phases, limitations, reporting methods, and implementation plans so clients know exactly what to expect.
Use ClickUp Docs to store all information about your reports in one place. ClickUp Docs, powered by Brain, allows you to draft reports, create summaries, etc.
⭐ Bonus: Here are some other reporting templates you can use for your agency:
👀 Did You Know? A Deloitte member firm had to refund $290,000 to the Australian government after AI-generated errors led to fabricated references and non-existent research citations (bad data leads) in their report. The incident highlights that even sophisticated AI can’t replace human oversight yet.
To automate reports, data teams first need to gather clean, non-duplicated data from multiple sources.
For that, choose a reporting tool that seamlessly integrates with your data sources.
Next, set clear validation rules for data governance:
With these validation rules set, you can weed out poor data quality (bad data) and build reports on clean, accurate data. The reporting tool can then populate your templates with accurate numbers and generate reports with minimal intervention.
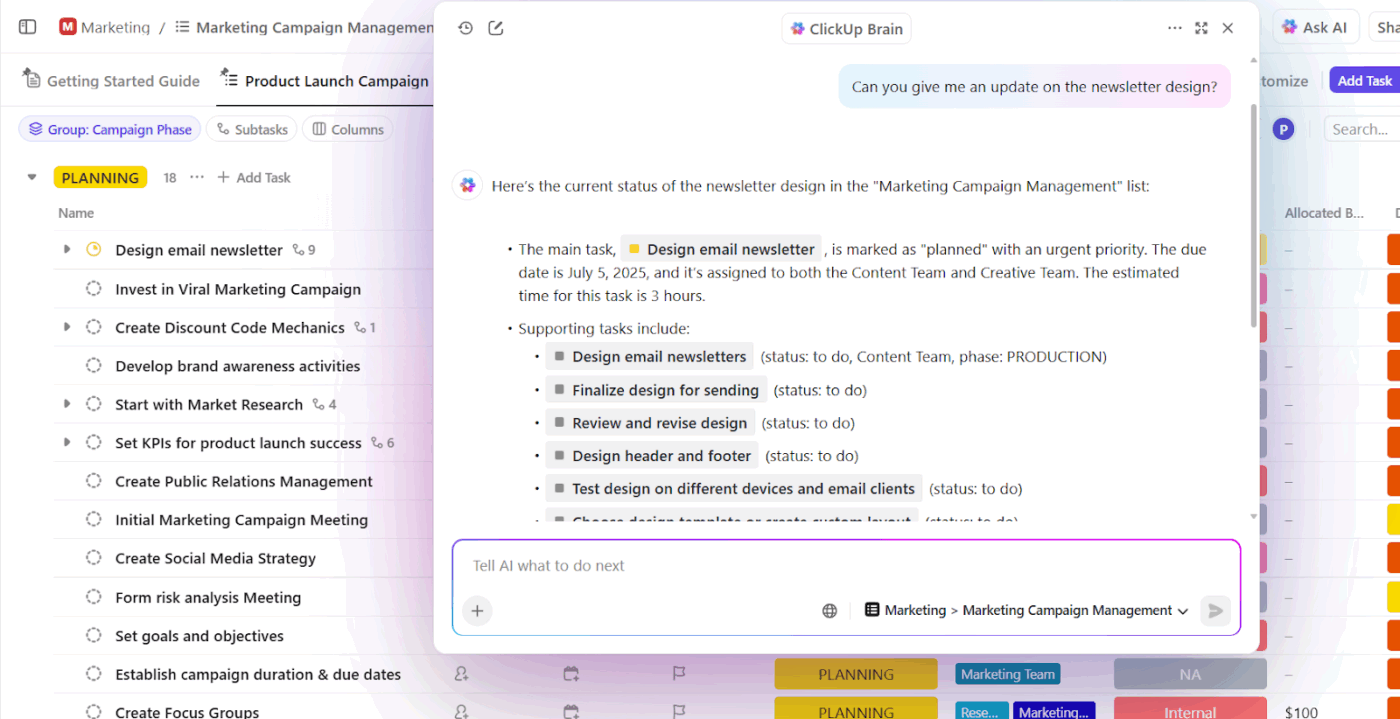
ClickUp offers ClickUp Brain (a native AI) that has a complete contextual understanding of your workspace and its connected tools.
Use this contextual AI to retrieve information on completed tasks, hours spent, blockers, ongoing tasks, and priorities from your specified lists and projects.
Here’s a pro tip: Use ClickUp Clips to record short video walkthroughs explaining key metrics in your reports.
Attach these clips directly to your reporting Doc so clients can watch your explanation while reviewing the data.
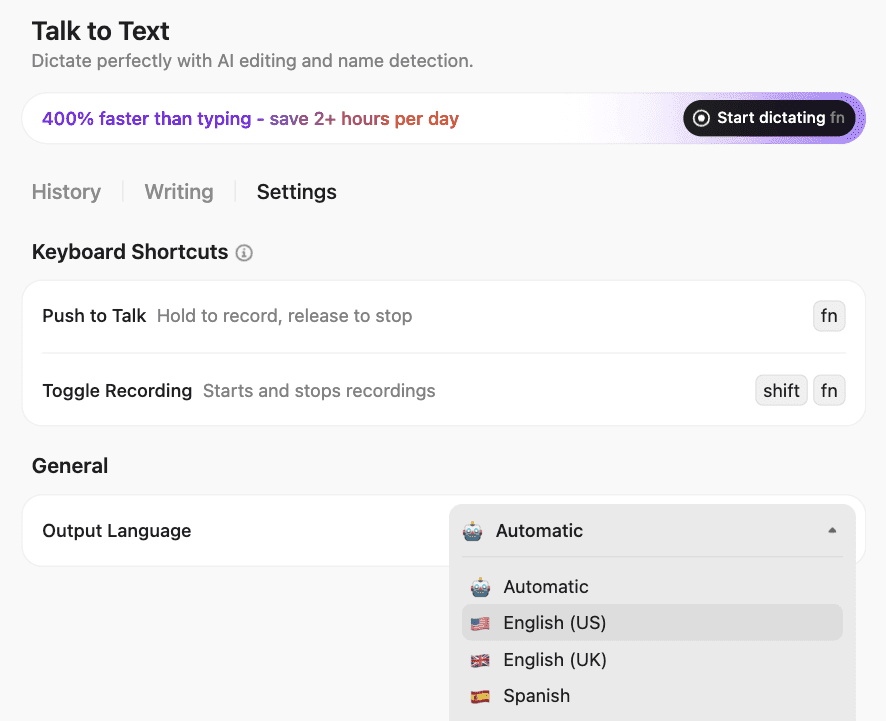
⭐ Bonus: Dictate the narratives and context that tie data points in your reports using ClickUp BrainGPT’s Talk-to-Text feature. This way, you won’t forget any important insight or overlooked trend and get your analysis transcribed at the speed of your thoughts.
👀 Did You Know? Nearly 94% of business spreadsheets have critical data errors—logical mistakes, inconsistent and unreliable data, and inaccurate data entries from human error.
When these flawed spreadsheets drive business decisions, they lead to poor business outcomes and inflated operational costs that could have been avoided with best practices for data validation.
Not every client needs the same reporting frequency. That is, a product launch campaign might require daily check-ins during the first two weeks, while an ongoing SEO retainer might only need monthly summaries.
So, depending on your client’s needs, establish a reporting schedule. Involve clients in this process for a better customer experience and lay out clear expectations for the granularity of different reports.
For instance, a client running paid ad campaigns might want weekly breakdowns of spend, impressions, and cost-per-acquisition. But for monthly reports, they’d prefer a high-level overview showing total budget utilization, top-performing channels, and ROI trends across the entire period.
At this stage, ClickUp Automations, AI Agents, and ClickUp Brain work together to ensure your reporting cadence runs on time—without manual follow-ups.
ClickUp AI Agents act as intelligent workflow partners. Instead of stacking multiple rules to remind teams, prepare data, or notify clients, you simply tell the Agent the reporting outcome you want. ClickUp Brain handles the logic behind the scenes. Your Agents can:
💡 Pro Tip: Set up a ClickUp Super Agent to track report deadlines across all clients. It flags overdue items, alerts managers, and drafts status updates automatically.
Pair this with ClickUp Automations for recurring tasks and reminders, and your reporting cadence becomes predictable, consistent, and entirely self-running.

To know more about building your AI agent in ClickUp, watch this video 👇
This is where you evaluate what’s working and what isn’t.
Are clients asking the same clarifying questions every month? Are certain metrics consistently missing? Are your teams spending too much time on parts of the report that should already be automated?
The three checks you should focus on are:
Make this an ongoing part of your reporting.
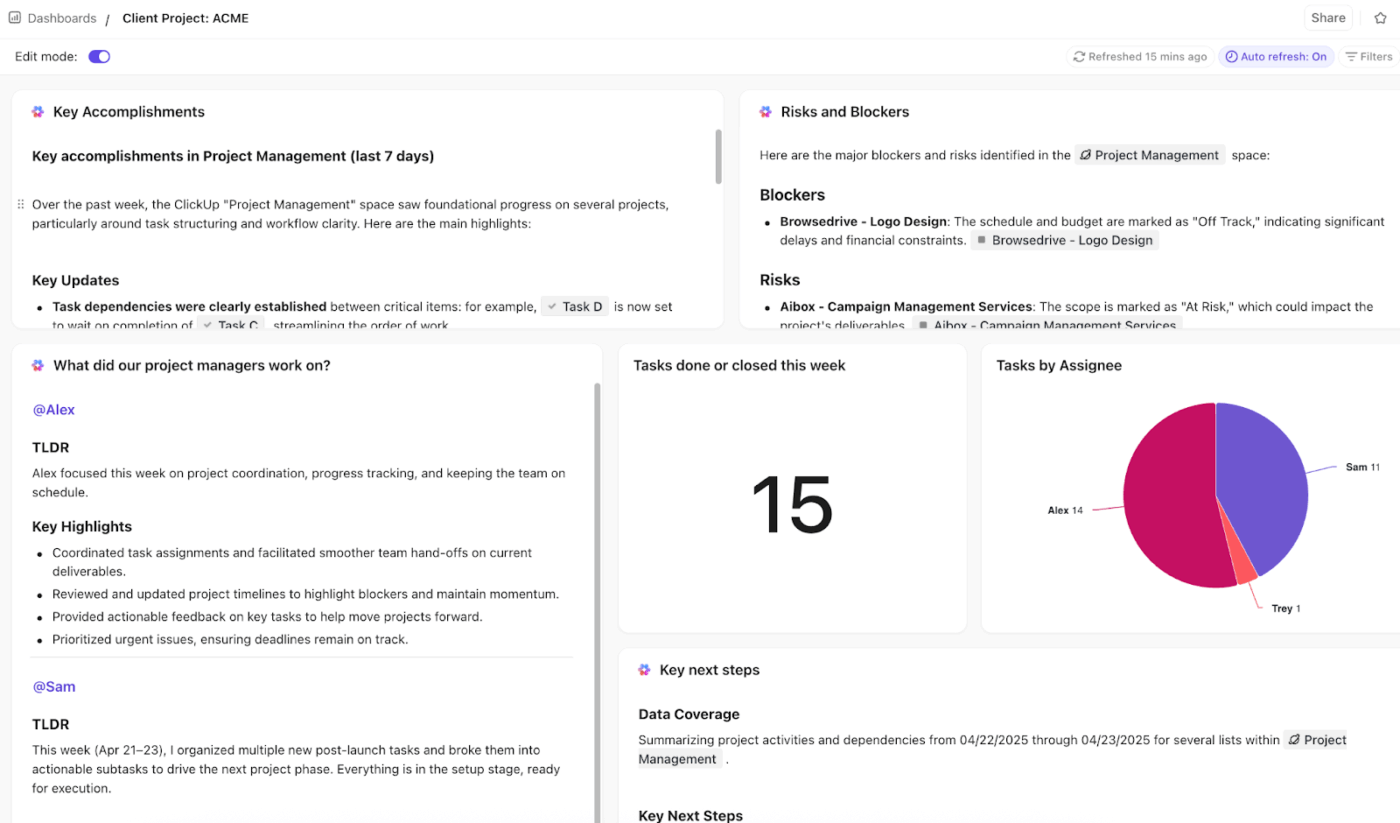
ClickUp Dashboards give you a real-time, at-a-glance view of key metrics across projects, clients, or campaigns—without having to compile data manually every time.
For client reporting, this means you can pull up a dashboard that shows all vital KPIs (traffic, conversions, ad spends, deliverables, status) instantly.
No more incorrect data entries or outdated data in your reports.
Trend lines and graphs help you show progress over time, making it easier for clients to see continuity, growth, and stability.
Here’s the best part: AI Cards.
They make it easy to build the narrative part of reports. Rather than manually writing a recap of what happened this period, you can rely on AI to draft first-pass summaries, highlight blockers or standout performance, and even suggest next steps.
🚀 ClickUp Advantage: ClickUp BrainGPT acts as your desktop AI companion, bringing all your work, data, and reporting context into one intelligent system.
If you’re already using too many AI apps, this video shows you how to fix it before things spiral.
📚 Read More: Project Dashboard Examples for Inspiration
👀 Did You Know? A study by Harvard Business School confirms that machine learning models are only as good as the data they’re fed. When automation tools receive inconsistent data, they produce flawed outputs that require constant manual fixes—defeating the entire purpose of automation.
Always start with clean, accurate data, if you don’t want your automation efforts to turn into wasted marketing spend.
ClickUp has all the tools you need to build client reports in minutes.
With ClickUp’s centralized workspace, you get all the client’s data, metrics, and progress updates in one place. Paired with a contextual AI and its automation capabilities, you can automate your reporting process without compromising consistency.
Sign up for free now and automate your reporting process with ClickUp.
Consistent client reporting builds transparency and trust amongst clients. It fosters ongoing conversations that position your agency as a true strategic collaborator.
Reports keep clients informed and assure them of your reliability. When clients stay in touch with what’s happening with their projects, it reduces room for misunderstanding and speeds up decision-making.
ClickUp centralizes data collection and automates report generation with customizable templates. It offers real-time Dashboards for visually rich reports and an integrated AI that has complete contextual understanding of your client’s work.
Inconsistent reporting erodes client trust and makes them question the value you deliver. It increases the risk of churn and can lead to delayed contract renewals or budget cuts.
Standardized templates ensure all reports follow a consistent format, so clients can compare metrics over time. Dashboards, on the other hand, provide clients with tailored, scannable visuals that enhance clarity. Real-time updates mean clients access current data whenever they need it, reducing the volume of status update requests your team handles.

© 2026 ClickUp

There’s an easier way. Try a free AI Agent in ClickUp that actually does the work for you—set up in minutes, save hours every week.