


Still downloading templates?
There’s an easier way. Try a free AI Agent in ClickUp that actually does the work for you—set up in minutes, save hours every week.
Sorry, there were no results found for “”
Sorry, there were no results found for “”
Sorry, there were no results found for “”
Is your project affected by delays, quality issues, or budget overruns? If so, you must be trying to find the root causes.
We understand that attempting to identify the source of a problem can sometimes feel daunting. But there’s a powerful tool waiting in your toolbox: Microsoft Excel!
This article explores how to create a fishbone diagram in Excel. This visual detective board will help you identify the contributing factors to your project’s woes, perform a detailed root cause analysis (RCA), and develop effective solutions to prevent future headaches.
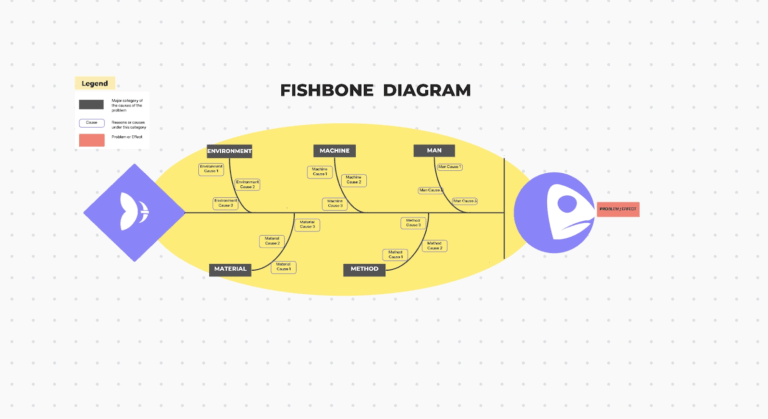
A fishbone diagram, also known as an Ishikawa diagram or cause-and-effect diagram, is a visual tool for solving problems. Shaped like a fish skeleton, it shows the problem at the head and potential causes along the bones. This structure makes it immediately clear how different factors contribute to the issue at hand.
The main goal of a fishbone diagram is to organize and explore possible causes of a problem. By laying out potential causes in a structured way, it helps teams dig deep to find the root causes, not just the symptoms. This organized approach transitions smoothly into the next benefit: encouraging teamwork.
A key feature of the fishbone diagram is that it promotes teamwork and diverse ideas through collaborative brainstorming and mind mapping. Bringing different perspectives together gives a complete picture of the problem.
The visual format of the diagram also simplifies complex problems, making them easier to understand and communicate. This structured approach naturally helps you identify issues and present solutions effectively.
As a result, using a fishbone diagram helps organizations tackle issues by focusing on the real causes, leading to better solutions and continuous improvement.
Spot problems fast with the free ClickUp Fishbone Diagram Template! Break down causes, find solutions, and keep your team aligned—all visually organized.
With its versatile drawing and formatting tools, Excel is a great application for creating a fishbone diagram.
You can follow these detailed steps to create a fishbone diagram in Excel:


Draw sub-branches and label them


By following these steps, you can create a detailed and visually appealing fishbone diagram in Excel.
Despite its strengths, Excel has several limitations when designing and managing these complex diagrams, which can impact the efficiency and effectiveness of the problem-solving process.
Here are some of these key limitations to consider when using Excel for fishbone diagrams:
Constructing a fishbone diagram in Excel requires significant manual effort. You must draw lines, shapes, and text boxes to represent the structure of the diagram, which can be time-consuming and cumbersome
Aligning and formatting elements to maintain a clear, readable diagram can be difficult. Excel is primarily designed for tabular data flow and standard charts, not for complex, custom diagrams
Once created, fishbone diagrams in Excel are relatively static. Making changes, such as adding or removing causes, requires manual adjustments to the diagram, which can disrupt the layout and require reformatting
Unlike dedicated diagramming tools, Excel does not offer features like dynamic linking of causes and sub-causes. You must manually update all related elements, increasing the risk of errors
Excel can become unwieldy when dealing with complex fishbone diagrams that involve many causes and sub-causes. The canvas size is limited, and managing a large number of elements can lead to a cluttered and difficult-to-read diagram
As the number of graphical elements increases, Excel’s performance can degrade, leading to slower response times and potential crashes, especially in older versions or on less powerful hardware
Excel does not provide built-in fishbone diagram templates or tools specifically designed for fishbone diagrams. You must create these diagrams from scratch, lacking the efficiency and ease of use offered by specialized diagramming software
While Excel is great for data analysis, it lacks the specialized analytical tools that can be integrated with fishbone diagrams to identify and prioritize causes more effectively
Sharing fishbone diagrams created in Excel can be less efficient than using cloud-based diagramming tools that support real-time collaboration. Excel files must be shared and updated manually, which can lead to version control issues
Interactive features, such as clickable elements or embedded notes, are not natively supported in Excel, limiting the ability to create engaging and informative diagrams that facilitate collaborative problem-solving
Creating an effective fishbone diagram in Excel requires proficiency with the software’s drawing and formatting tools. If you’re not familiar with these features, you may find it challenging and time-consuming to produce a professional-looking diagram
Due to Excel’s limitations for fishbone diagrams, let’s shift our focus to more powerful alternative solutions.
Let’s be honest, Excel isn’t just clunky; it’s part of a bigger problem.
Today’s teams are drowning in Work Sprawl, jumping between endless apps, spreadsheets, and chat threads just to solve one issue. Add AI Sprawl into the mix, disconnected tools that don’t talk to each other, and your so-called “efficiency” turns into chaos.
That’s where ClickUp steps in. It’s the single source of truth for your projects, docs, data, and now AI. With ClickUp Brain, you can instantly surface causes, summarize team insights, and turn findings into tasks, all without leaving your workspace.
You can overcome Excel’s limitations using specialized fishbone diagram software like ClickUp and use multiple additional features and functionalities, including fishbone diagram templates.
ClickUp’s Fishbone Diagram Template is more user-friendly, customizable, and collaborative than a simple Excel spreadsheet. It offers integrated project management and visual tools, facilitating a more efficient and effective problem-solving process.
Here are the steps to use this fishbone diagram maker in ClickUp:
Key features of this template include:
Here’s why ClickUp’s Fishbone Diagram Template can be a better alternative to Excel’s:
| Feature | ClickUp Fishbone Diagram Template | Excel |
| Ease of use | Ready-to-use template; easily set up in seconds | Requires manual creation from scratch |
| Customization | Fully customizable with custom statuses, fields, and views | Limited customization, and manual adjustments needed |
| Collaboration | Real-time collaboration with whiteboard software, task assignment, and feedback collection | Basic collaboration features; lacks robust real-time feedback and task management |
| Project management | Integrated project management features: tagging, nested subtasks, multiple assignees, priority labels | No built-in project management integration |
| Visual tools | Visual tools like Whiteboard View and Board View for brainstorming and organizing ideas | Basic visual tools, shapes, and lines |
| Tracking and updates | Real-time status updates, progress tracking, and monitoring tasks | No pre-built template is available |
| Template availability | Pre-built, fully customizable Fishbone Diagram template | Separate analysis tools or manual methods are required, disrupting workflow |
| Workflow integration | Seamless workflow integration from problem identification to solution development | Isolated tool; additional tools or methods needed for workflow integration |
| Analysis and solution development | Facilitates analysis and solution development through integrated features | Separate analysis tools or manual methods required, disrupting workflow |
You can also use ClickUp Mind Maps to create a fishbone diagram.
ClickUp has made asynchronous alignment much simpler and more effective. By building a framework in which to outline and structure objectives and results, remote teams are able to understand expectations and provide status updates fluidly. Brainstorming with whiteboards is easy, reorganizing priorities is easy, and adding reference images, etc., is all very fluid.
Set up your main problem and then start branching out with all the potential causes as illustrated in the picture. This is similar to how a fishbone diagram works. It’s also neat because you can see everything laid out clearly.

One of the best parts about using Mind Maps to create a fishbone diagram outline is the collaboration feature. Your whole team can jump in and contribute in real time, so you won’t miss out on any important causes while brainstorming.
Plus, ClickUp integrates these mind maps with tasks and projects. So, if you identify a cause that needs more investigation, you can instantly turn it into a ClickUp Task.

Another tool that can come in handy when creating fishbone diagrams is ClickUp Whiteboards. Whiteboards give you a clean canvas to connect causes to your problems.
You can use different colors, shapes, and text styles to make your diagram clear and visually appealing. It helps highlight the most important points and keeps everything organized.
These ClickUp tools will help you run your RCA well, create various project management charts, and make stellar presentations!
📮ClickUp Insight: When a goal falls short, only 34% of our survey respondents revise their strategy and 33% just give up. 🫢
But failure isn’t the end; it’s feedback.
You can easily unpack what went wrong with ClickUp Mind Maps and Whiteboards, explore new ideas, and chart a smarter course forward. Think of it as your built-in bounce-back plan.
💫 Real Results: ClickUp users say they can take on ~10% more work—because setting realistic goals means more wins and fewer meltdowns
Fishbone diagrams are powerful visual tools that help teams to systematically identify the primary causes of problems.
While Excel offers a way to create them, ClickUp’s Fishbone Diagram Template improves the process with features like customizable fields, real-time collaboration, and integrated project management. You can also support the template with built-in Whiteboards and Mind Maps that give you an infinite canvas for collaborative brainstorming and problem-solving.
This makes ClickUp an ideal solution for teams seeking a more efficient and collaborative approach to problem-solving. Sign up for ClickUp to know more!
Excel isn’t built for visual layouts, so maintaining structure and clarity can be tough. You’ll spend time aligning shapes, resizing text boxes, and manually formatting causes, especially as your diagram grows complex.
Not really. Excel lacks automation for diagram updates. Every time you add or edit causes, you’ll need to manually adjust shapes and connectors, making it tedious for teams that regularly run root cause analyses.
They visually map causes behind a problem, helping teams move from symptoms to root causes. This structure sparks collaboration, reveals hidden issues, and encourages data-driven discussions instead of vague brainstorming or guesswork.
If your diagram keeps breaking, collaboration is messy, or updates take longer than analysis itself—it’s time. ClickUp templates automate structure, link causes to tasks, and keep everyone aligned in real time.
ClickUp offers pre-built templates, real-time collaboration, and automation features. Unlike static spreadsheets, you can update, analyze, and track progress dynamically—helping teams move from identifying problems to fixing them faster.

© 2026 ClickUp

There’s an easier way. Try a free AI Agent in ClickUp that actually does the work for you—set up in minutes, save hours every week.