Airtable vs. Excel: Which Tool Is Better in 2026?

Sorry, there were no results found for “”
Sorry, there were no results found for “”
Sorry, there were no results found for “”
One of the biggest challenges for modern businesses is data readiness.
Whether you’re crunching numbers for a big project, tracking inventory, or just organizing your daily to-dos, a solid data tool is a game-changer. With so many options out there, it can be hard to pick the one that fits just right.
Lucky for you, we’re taking a closer look at two popular database management tools: Airtable and Excel. Both are packed with features to help you get things done, but they approach data management uniquely.
Ready to find out which one might be your new go-to? Buckle up for the ultimate Airtable vs. Excel showdown. We’ll also throw in a new tool that might tip the scales! 🏆
Airtable is a relational database tool that helps you organize data in rows and columns and connect different data points to manage your projects and workflows better. You can use it to bring all your business data into one place—whether it’s team OKRs, client projects, marketing campaigns, or customer feedback.
It makes collaboration easy, letting everyone stay on the same page with real-time updates and custom views that suit everyone’s needs.
Plus, Airtable templates help you get started quickly, whether you’re building a project tracker, a CRM, or a personal to-do list.
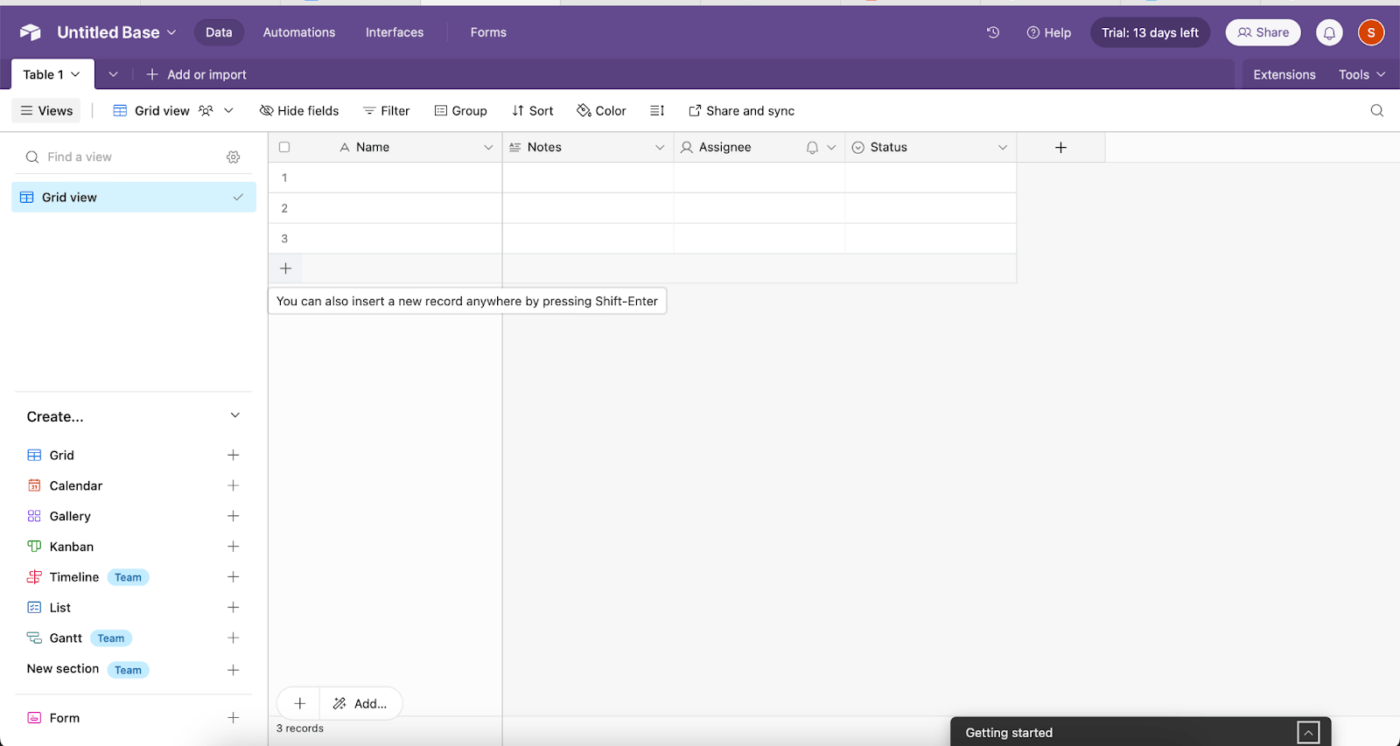
If you are looking for a user-friendly tool to track all business data and remove data silos across departments, Airtable offers some handy features. Let’s check them out!
Organize and visualize your data with custom views. Airtable lets you choose from various view types—such as a Grid view, Calendar, or Kanban—so you can display information in a format that best fits your project and team’s requirements.
Airtable’s Interface Designer allows you to build custom interfaces directly from your data. Create views tailored to specific needs, making it easier for teams to interact with data in a way that’s visually appealing and user-friendly.
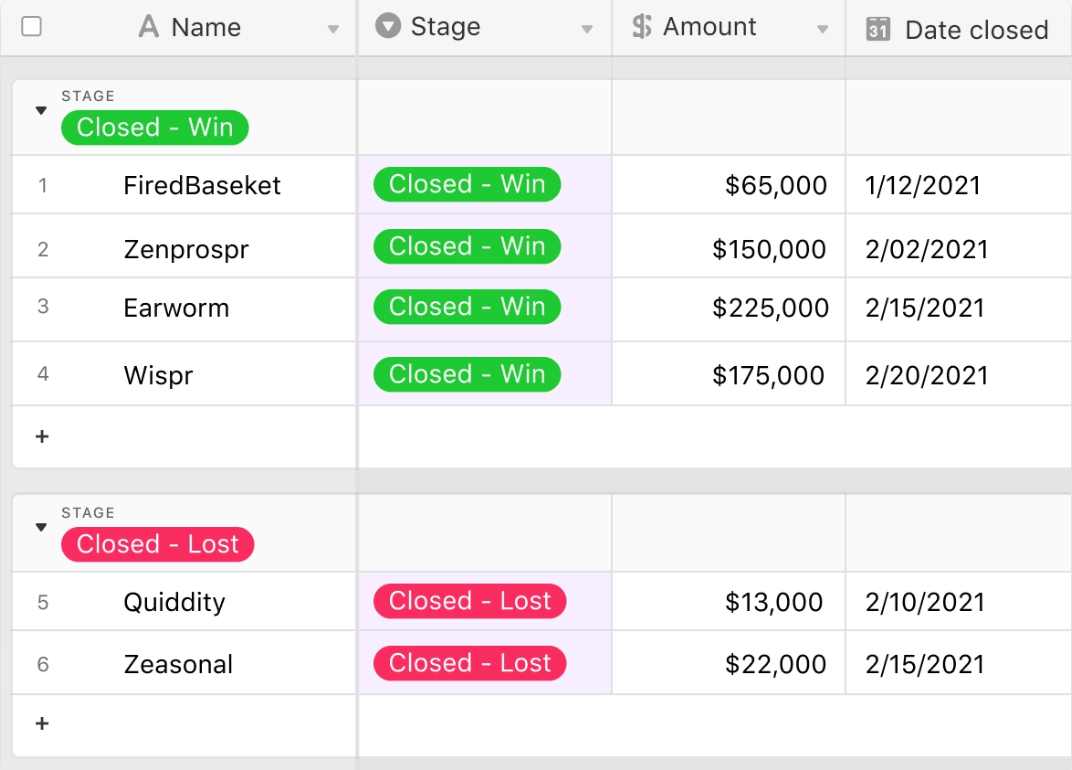
Airtable also comes with reporting capabilities. You can measure and analyze your data in Airtable with comprehensive reporting features to manage data like incidents, available assets by type, sales pipeline, and more. This helps you gain insights and track key metrics to keep your projects on course, helping you make data-driven decisions effortlessly.
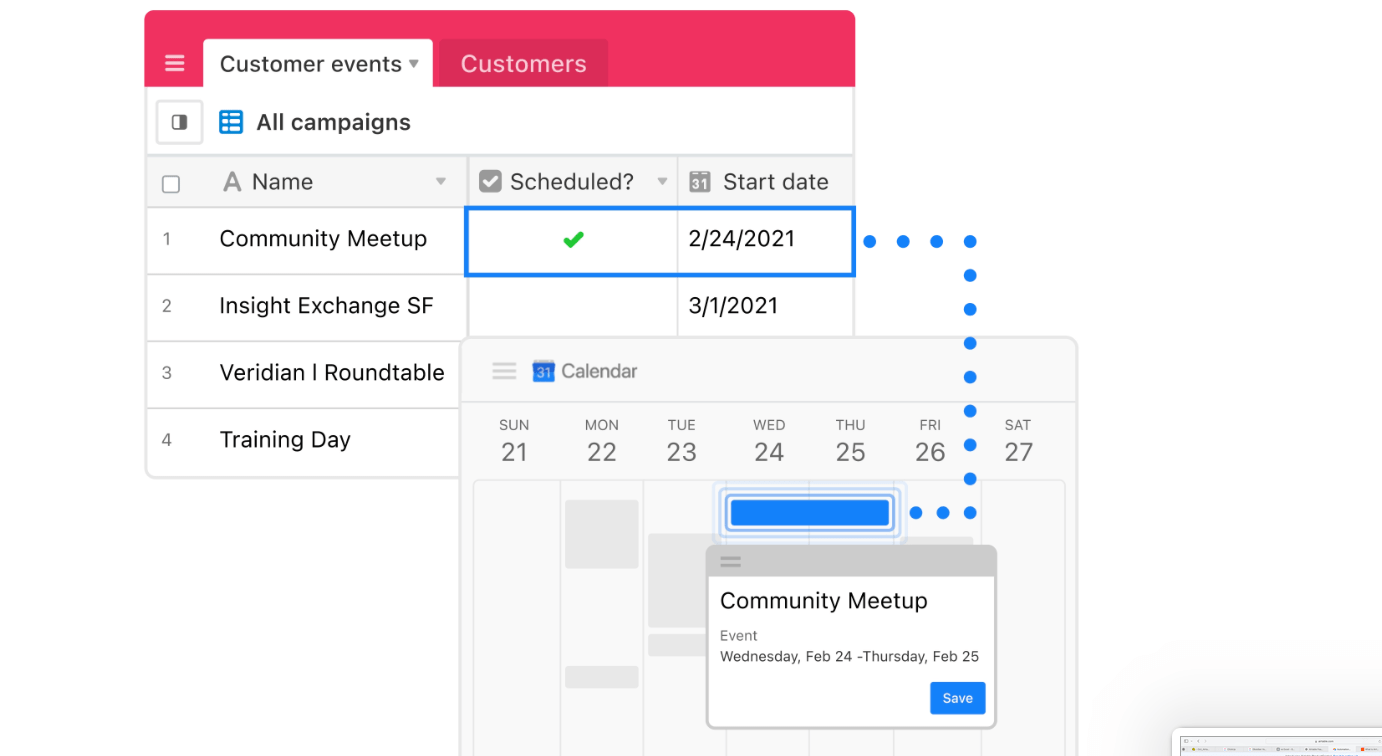
Airtable comes with a ton of automation capabilities. You can streamline repetitive tasks, create triggers for notifications, and integrate with external tools to ensure your workflow runs smoothly with minimal manual effort. If you need more functionality, you can connect your Javascript.
📖 Read More: How to Export Airtable to Excel
Excel is a popular spreadsheet software by Microsoft that’s widely used for data analysis, financial modeling, and data organization. It offers a grid of cells where users can input, manipulate, and analyze data using formulas, charts, and pivot tables.
Excel project management has powerful features designed to handle everything from basic data entry to advanced analytics.
Whether you’re managing a budget, creating reports, managing complex data structures, or building models, Excel provides practical tools to make your data more valuable.
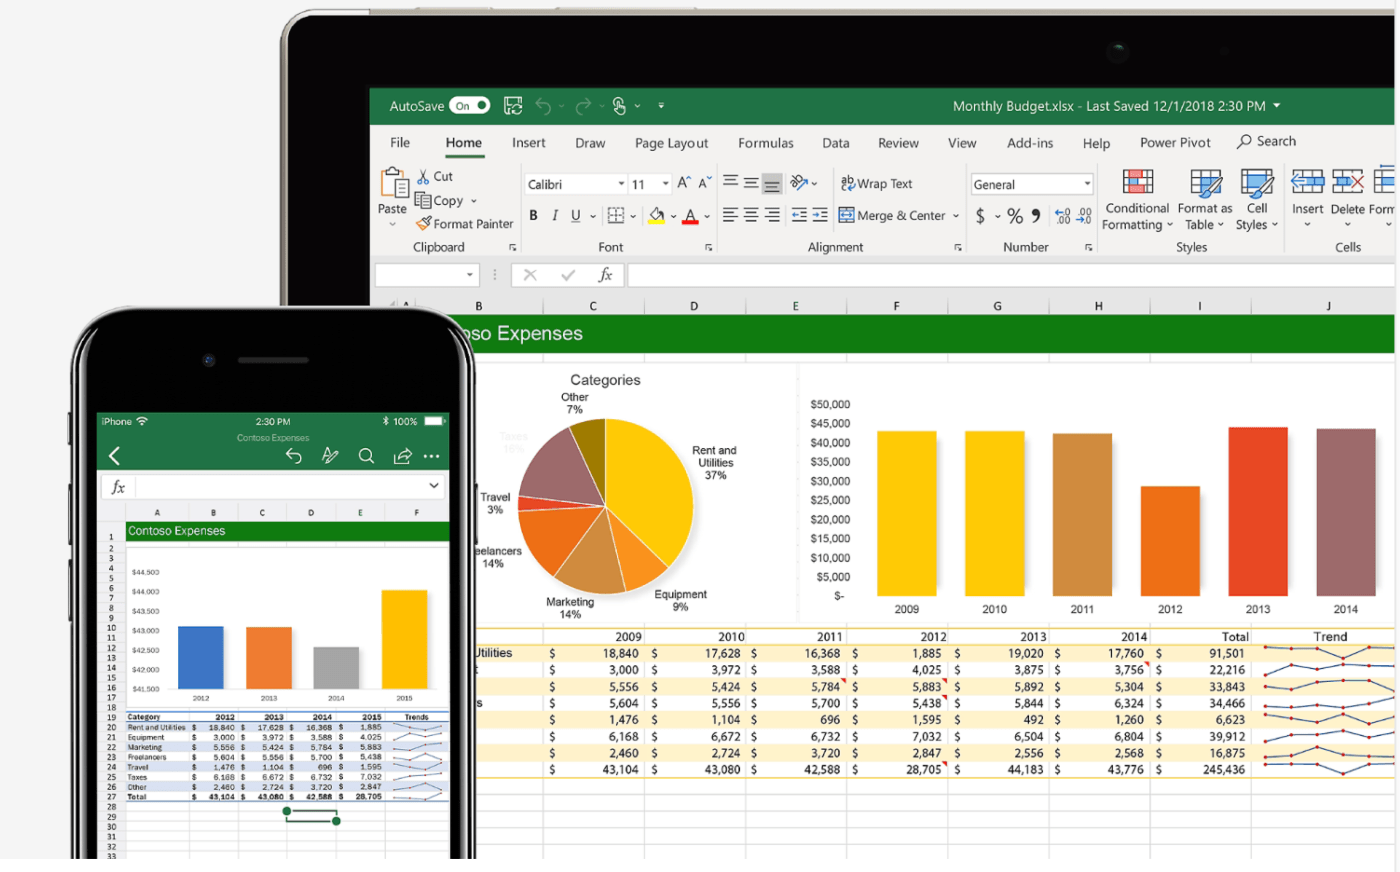
Here are some key advantages of MS Excel:
Excel offers an extensive library of formulas and functions, allowing users to perform calculations, data analysis, and logical operations with ease. Excel’s formula capabilities make it indispensable for many tasks, from simple math to complex statistical functions.
It helps visualize data patterns and trends through a variety of chart types, such as bar, line, and pie charts. You can also use conditional formatting to highlight data based on rules, making it easy to spot outliers or trends at a glance.
Excel offers powerful built-in data visualization tools like Solver, Analysis ToolPak, and Goal Seek for statistical analysis, simplified data entry, forecasting, and optimization. These tools simplify complex calculations, making Excel a good choice for data-driven decision-making.
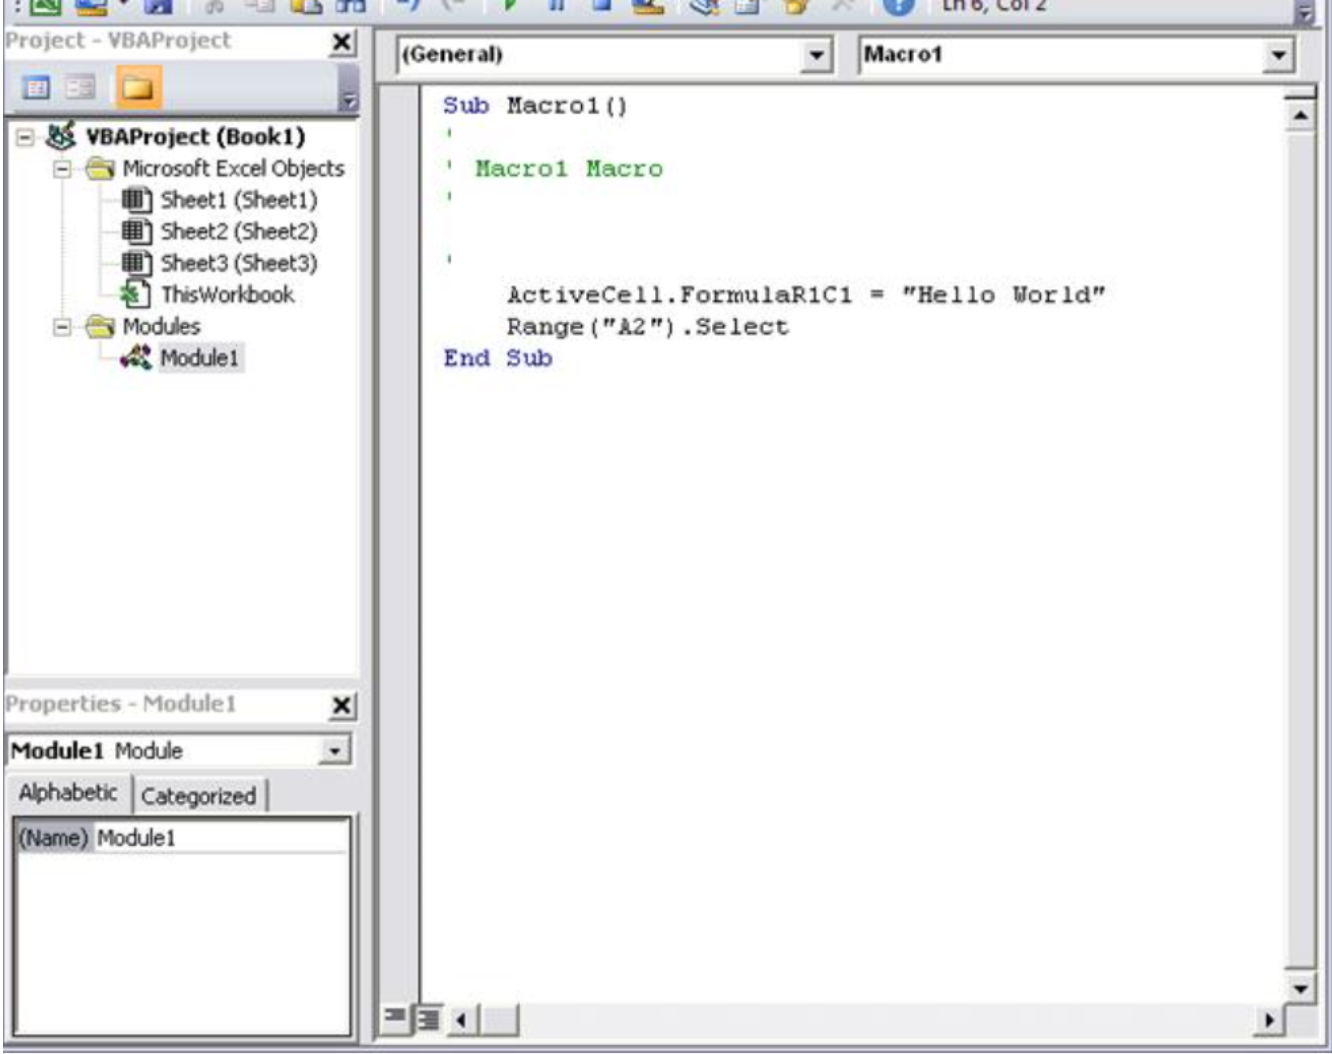
With VBA (Visual Basic for Applications), Excel users can create macros to automate repetitive tasks, streamlining workflows and saving time. This feature is particularly useful for creating customized reports and complex workflows.
📖 Read More: 10 Best AI Excel Tools in 2024
Let’s do a deep comparison of Excel and Airtable based on their capabilities:
When it comes to organizing your data, flexibility is everything. Whether you’re managing a basic list or dealing with a complex project, having a tool that can adapt to your needs makes all the difference. Here’s how Excel and Airtable handle data structuring and flexibility in their own unique ways.
Excel is a flexible, grid-based tool for managing data. You can handle massive datasets, customize cells, use formulas, and play around with formatting to make your data look how you want. It’s built to handle complex calculations, which is why it’s so popular for anything involving numbers and finances.
Airtable is like a mix of spreadsheet software and a database, giving you the best of both worlds. It’s set up as a ‘relational database,’ so you can link records between tables easily, which is handy for things like project management, monitoring sales pipeline, and content management. Plus, it’s more intuitive for non-technical users than a traditional spreadsheet app, making it easy for teams to stay organized.
🏆 Winner: Airtable for centralized data management
Formulas and calculations are at the heart of any powerful data tool. Whether you’re crunching numbers, analyzing trends, or just organizing data, having robust calculation options can make your work a whole lot easier. Here’s how Excel and Airtable perform:
Excel has powerful, advanced formula capabilities, including complex mathematical, statistical, and financial functions. You can create nested formulas, pivot tables, and complex data structures using analysis tools like Power Query, which are useful for detailed data analytics and financial modeling.
Airtable includes basic formulas but lacks more advanced features and the calculation depth of Excel. It’s designed better for data organization than heavy calculations. Simple formulas and functions for basic math, data manipulation, and text functions are available, but they don’t support complex formulas on the same level as Excel.
🏆 Winner: Excel for complex data calculations
Data visualization helps users quickly grasp insights, identify trends, and make comparisons. In tools like Excel and Airtable, this feature makes complex data more accessible, enabling you to see patterns and draw conclusions from numerical data at a glance.
Excel offers extensive data visualization tools, including charts, graphs, and conditional formatting. You can create line graphs, bar charts, scatter plots, and pie charts directly within spreadsheets. Excel also includes Power BI integration for more advanced, interactive dashboards.
Airtable includes visualization options, but they are more basic features oriented towards usability. Views such as Kanban, gallery, calendar, and grid are available in the ‘Apps’ section. These visualizations are functional for project tracking but lack the complexity of Excel’s charting tools.
🏆 Winner: Excel for detailed data visualization
There’s no point in a tool without automation and workflow management features. Automation and workflow management streamline repetitive tasks, making work more efficient and freeing time for higher-level activities. Here’s what Excel and Airtable have in store for these:
Excel has limited automation through macros and VBA (Visual Basic for Applications), allowing users to automate repetitive tasks and create custom functions. While powerful, macros require coding knowledge and are not user-friendly for everyone.
Airtable provides automation in a more accessible, no-code format. Its automation features allow setting up triggers, notifications, and integrations with other tools (like Slack, Google Calendar, etc.), making it great for team workflows and project management. This ease of use is ideal for collaborative work but lacks the depth of Excel’s VBA.
🏆 Winner: Airtable for no-code automation and advanced features
Collaboration and sharing features make it easy for teams to work together seamlessly. Tools like Excel and Airtable allow multiple users to access, edit, and comment on data in real-time, keeping everyone on the same page and improving team productivity.
Excel supports collaboration, particularly through Microsoft 365, where multiple users can work on a file simultaneously. However, tracking changes and managing permissions for multiple views can become complex, especially for large teams.
Airtable is designed with collaboration in mind. Users can comment on records, assign tasks, and work in real time on shared databases. Permissions can be set for each view, allowing for controlled access to specific data. Airtable’s user-friendly interface and sharing options make it more seamless for collaborative, team-based projects.
🏆 Winner: Airtable for seamless data collaboration
We took to Reddit to see what people were saying about Airtable vs. Excel. Here’s what we found:
Airtable, while powerful, has its limits when it comes to handling large-scale calculations like Excel.
I love the fact that I can add almost any feature I want in Airtable the moment after I realize I want it. It’s perfect for someone who wants a fully custom, tailored solution and finds enjoyment in executing it themselves.
Both Airtable and Microsoft Excel offer unique features and use cases for data management. However, they have basic collaboration features.
Regardless of which tool you choose, you need a separate platform for data analysis or communicating with stakeholders. Switching to a different tool for each data point is a hassle and can cause you to lose context.
To avoid this, it’s best to use a comprehensive platform like ClickUp that offers the best of Airtable’s flexibility and Excel’s data power
Let’s learn what makes ClickUp stand out as a top alternative in data management and analysis.
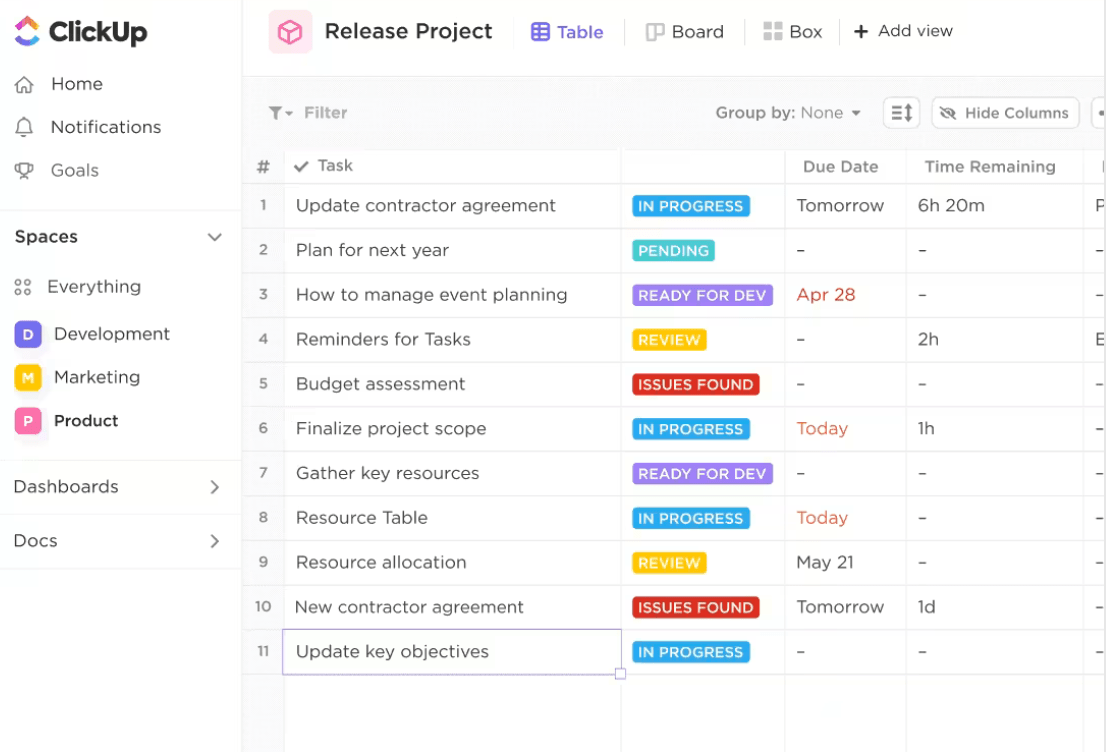
ClickUp’s Table View brings the functionality of spreadsheet tools to your project management, offering a familiar grid-based layout that’s customizable and packed with powerful features.
You can manage tasks, track data, and organize information in an intuitive and flexible way, perfect for teams used to working with spreadsheets.
With Table View, you are up for a no-code ride. Quickly draw relationships between tasks and organize your work by linking tasks, documents, and dependencies.
ClickUp offers a dedicated spreadsheet template that mimics the best parts of Excel and Airtable but within a project management environment—the ClickUp Spreadsheet Template.
With this template, you can easily set up project budgets, task trackers, or even data analysis sheets, all while keeping everything linked to your ClickUp workspace for seamless collaboration.
That’s not all. You can choose from six different views: List, Grid, Board Doc, Form, and Map. This template is beginner-friendly, so you might just forget about Excel or Airtable (haha)!
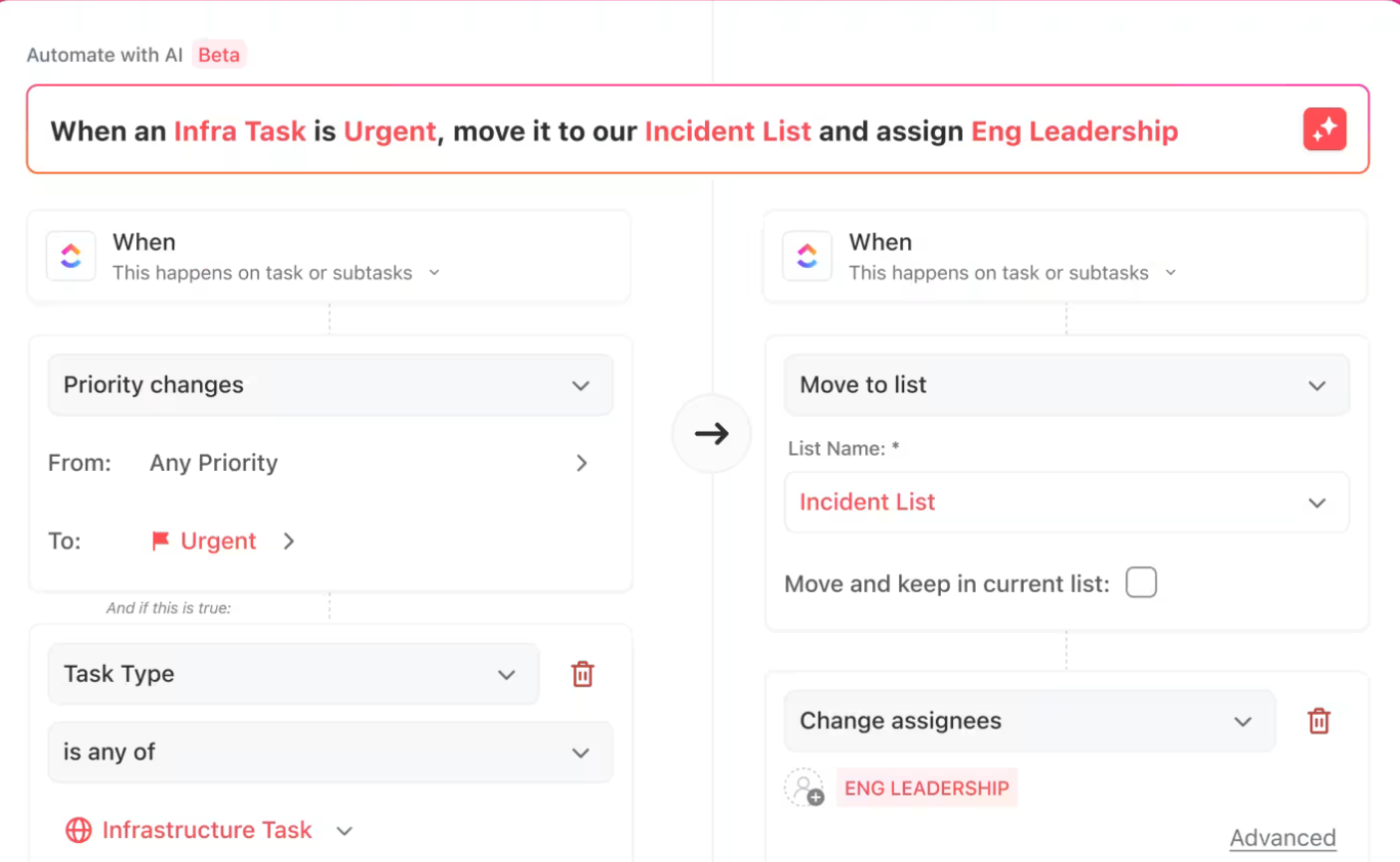
ClickUp’s Automation Features take workflow management to the next level. You can set up automations to trigger actions across tasks, projects, and notifications, cutting down on manual effort and keeping your team on track.
Whether you’re assigning tasks, updating statuses, or reminding team members about deadlines, ClickUp’s automations save time and boost efficiency.
You can also tell AI what you want to get done, and it will instantly build your automations. How cool is that? Plus, you can use it across your workflow, like for project shortcuts, dynamic assignees, email automation, AI-powered updates and analysis, and more.
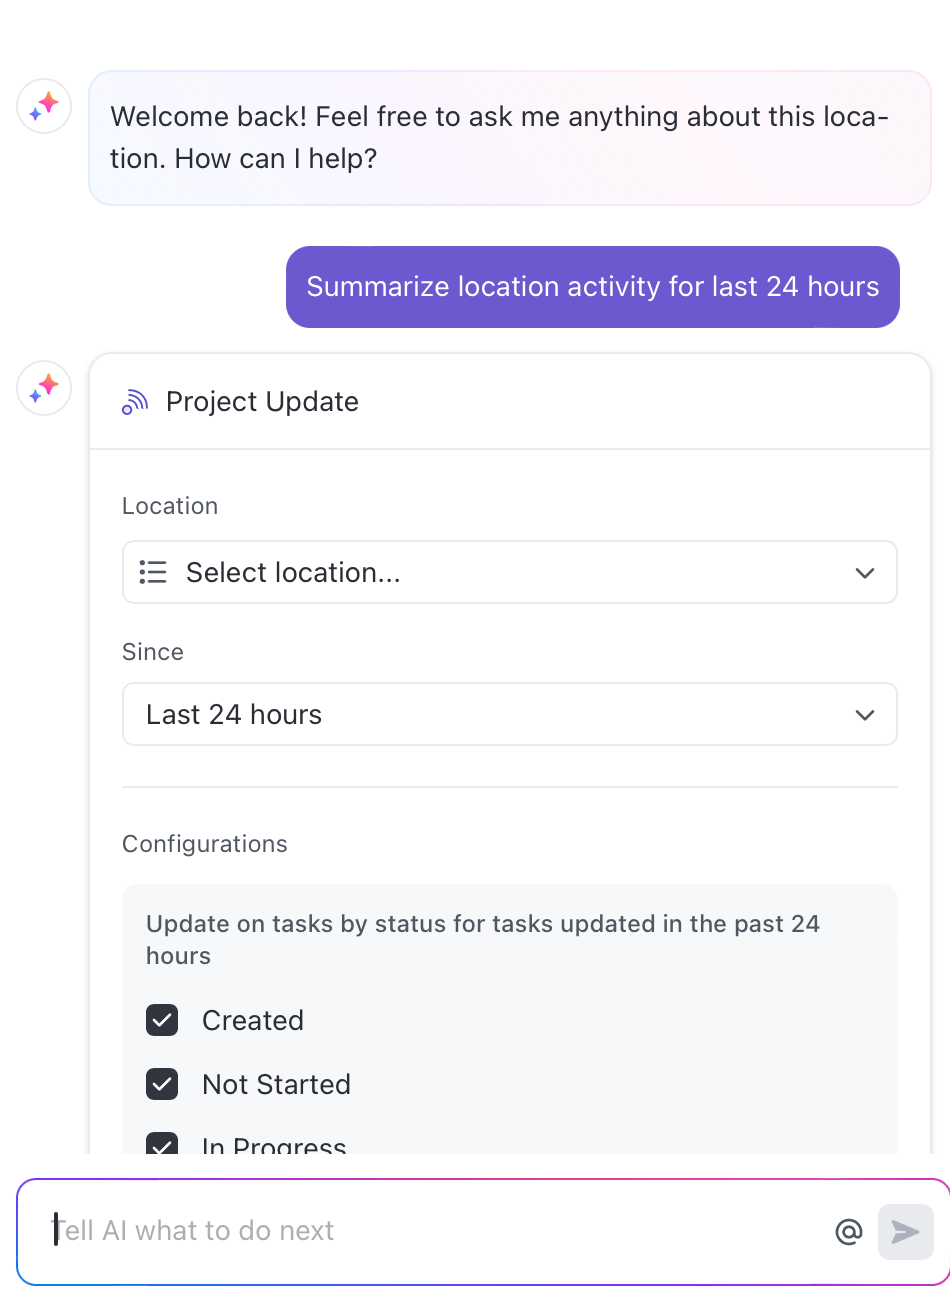
We also have ClickUp Brain, an AI assistant, which makes it easy to generate content, summarize updates, and optimize workflows with just a few clicks. This is a huge plus for teams looking to speed up repetitive tasks and enhance productivity.
Additionally, a comprehensive suite of ClickUp Project Management features allows you to organize work, set goals, and track progress—all in one place.
With Gantt charts, Kanban boards, and Calendars, you can manage every aspect of a project without needing to switch tools.
If you’re looking for a more flexible setup, we have the ClickUp Editable Spreadsheet Template, which is fully customizable. This template allows you to build a personalized spreadsheet-style workspace tailored to your unique needs.
If you want centralized data management and seamless data collaboration, go with Airtable. However, Excel can be a better choice if you have a diverse dataset and want to perform advanced calculations.
But why choose? Why not have all the features in one platform to get advanced data insights?
This is where ClickUp comes in. It combines Airtable’s relational database capabilities with Excel’s versatility, becoming the perfect solution for managing workflows.
Designed to streamline work management, ClickUp offers automation, project management, and collaboration capabilities that can replace Airtable and Excel with a few unique twists. It brings the best of both in one intuitive platform, making work management seamless.
Sign up for ClickUp today to improve work efficiency!
© 2026 ClickUp