


Still downloading templates?
There’s an easier way. Try a free AI Agent in ClickUp that actually does the work for you—set up in minutes, save hours every week.
Sorry, there were no results found for “”
Sorry, there were no results found for “”
Sorry, there were no results found for “”
AI timeline generators don’t just create timelines; they adjust them when things shift.
Deadlines moved? Dependencies changed? The tool adapts automatically, so the entire team stays aligned without constant manual updates.
If your timelines have been a pain point, this is a good place to start.
This guide breaks down what matters when choosing an AI timeline generator and a few standout tools that make project planning feel less chaotic.
We’ve put together a quick comparison table to help you spot the differences at a glance. We’ll cover a complete breakdown below. 📋
| Tool name | Key features | Best for | Pricing* |
| ClickUp | Color-coded project timelines, ClickUp Brain, Gantt Chart, whiteboard, and tasks | Best for turning timelines into actionable workflows with AI | Free plan available; Custom pricing for enterprises |
| Venngage AI Timeline Generator | Customizable templates, alt text generation, contrast checkers.icons | Best for transforming data into timelines | Free; Paid plans from $19/user/month |
| MyLens AI | Multiple inputs, Integration with Google Sheets and Excel, Chrome extension | Best for converting complex documents into interactive timelines | Free; Paid plans start from $20/month per user |
| Preceden | Built-in search too, 4600 icons, and privacy control | Best for creating professional timelines | Free; Paid plans start from $25/month per user |
| Piktochart AI Timeline Infographic Generator | Drag-and-drop editor, AI-powered timeline creation | Best for transforming complex information into narratives | Free; Paid plans start from $29/month per user |
| MyMap.AI Timeline Maker | Built-in toolbar, export timelines in 4k resolution | Best for creating professional timelines for project planning | Free; Custom pricing |
| Edraw.AI Timeline Maker | Integrated chatbot, 210 drawing types, import from Visio, Word, and Excel | Best for converting text into timelines | Free; Paid plans start from $7.9/month per user |
| ChronoZoom | Big-picture storytelling, authoring tool | Best for visualizing history | Free |
| ClioVis | Presentation mode, geo-tagging, and import visuals from Wikimedia Commons | Best for visualizing connections | Free; Paid plans start from $6.99/month per user |
| AI Graph Maker | AI-powered timelines, export timelines in formats such as PNG, SVG, and Mermaid | Best for creating structured timelines | Free; Paid plans start from $5/month per user |
| Tiki‑Toki | 3D timeline view, 4 viewing options, and integration with YouTube and Vimeo | Best for creating an interactive 3D timeline | Free; Paid plans start from $9.5/month per user |
| CallidusAI Timelines | AI-powered research, Microsoft Word add-in, and 256-bit AES encryption | Best for legal platforms to automate legal research | Paid plans start from $149/month per user |
A good AI timeline generator helps you to map out tasks and dependencies in minutes. It simplifies your workflow and doesn’t add more layers of work.
Here are some key features to look for:
Our editorial team follows a transparent, research-backed, and vendor-neutral process, so you can trust that our recommendations are based on real product value.
Here’s a detailed rundown of how we review software at ClickUp.
Here are some tools built to simplify planning, adapt to changes, and help your team meet deadlines effectively without the last-minute hassle.
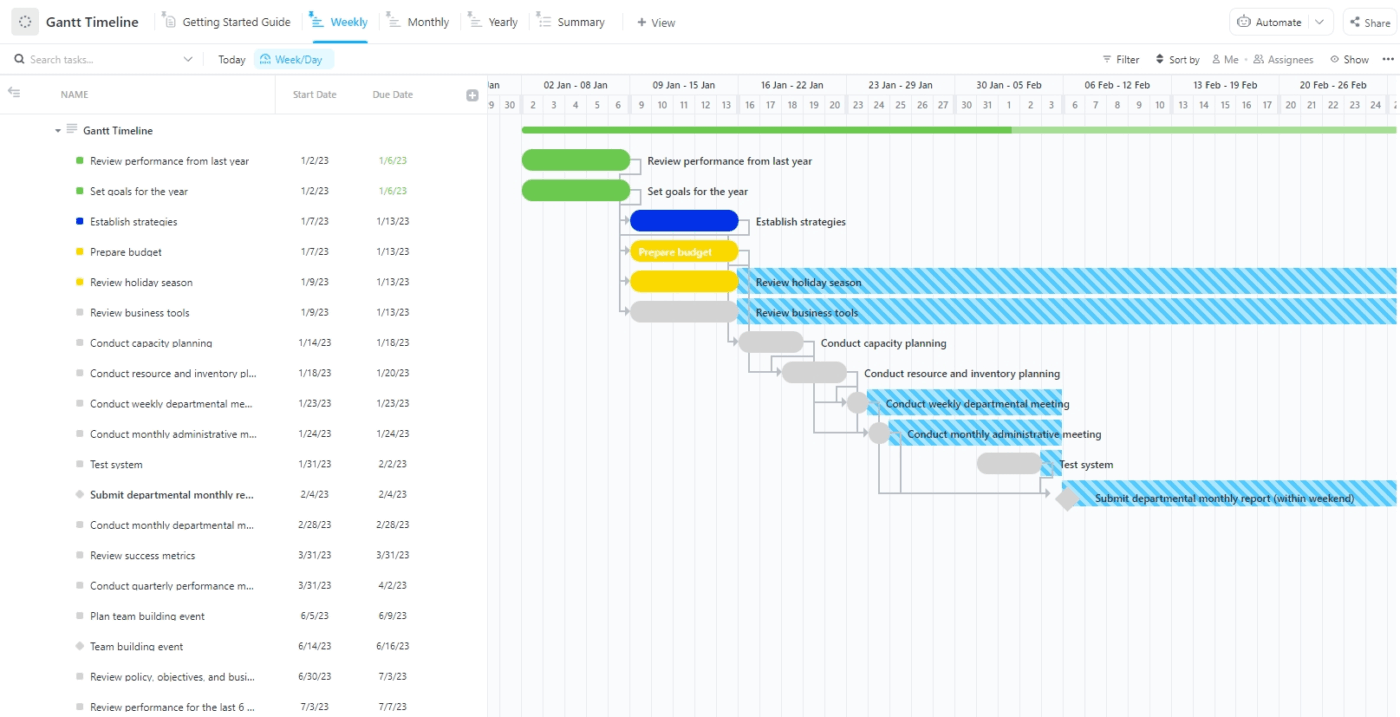
When it comes to managing timelines, ClickUp helps create critical blueprints that keep your team focused on deadlines and key milestones.
At the core is ClickUp Brain + ClickUp Calendar, which brings real-time intelligence into every step of your project.
Together these tools analyzes your meeting notes, chat threads, and project data to generate and maintain a realistic timeline with trackable ClickUp Tasks on your calendar. When priorities shift, the AI automatically adjust your schedule.
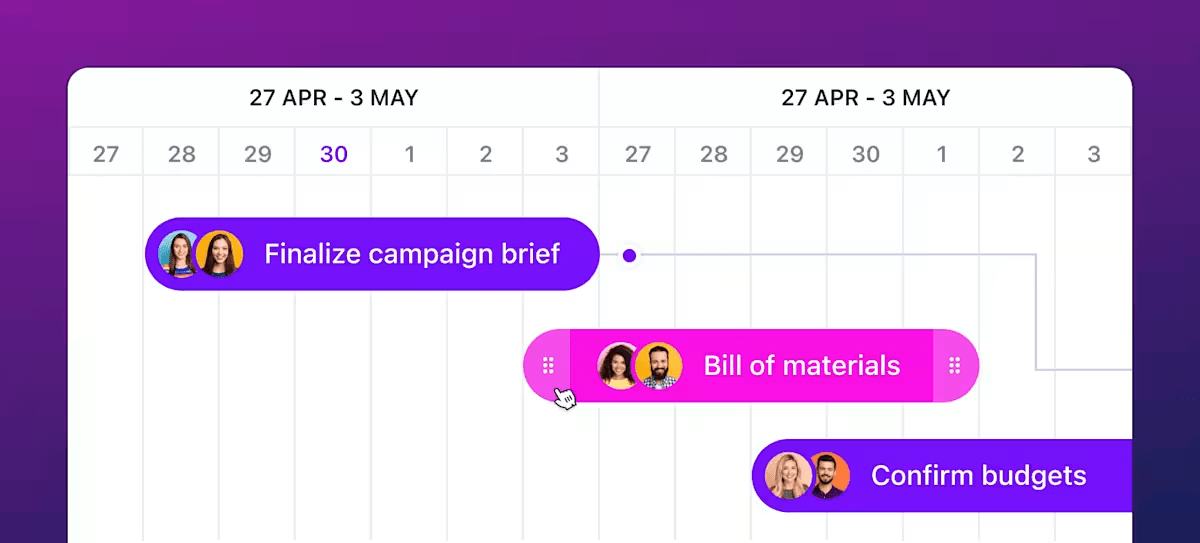
For example, in a website redesign project, ClickUp’s Timeline view allows you to visually schedule tasks, set dependencies, and adjust start or end dates with intuitive drag-and-drop controls. You can group tasks by assignee or priority, making it easy to spot resource conflicts or bottlenecks and reassign work as needed.
Multiple Views in ClickUp—including List, Board (Kanban), Gantt, Calendar, and Timeline—let different stakeholders track progress in the way that best fits their workflow, whether that’s a designer managing creative tasks or a project manager analyzing the critical path.
While you focus on strategy, Brain keeps progress moving, adapts priorities, and fills in the gaps, all in real time, with full context from across your workflows.

When paired with ClickUp Gantt Charts, these AI-generated timelines turn into interactive visual roadmaps. You can easily drag and adjust tasks, extend durations, set dependencies, and view progress in a clear, intuitive interface. As tasks progress, the timeline updates automatically to keep the entire team aligned with a real-time view of what needs to happen next.
To visualize blockers easily, Dependency Relationships prevent team members from starting a task before the prerequisite task is completed.
Here’s a G2 review:
What I love most about ClickUp is how seamlessly everything works together. The combination of Chat, Whiteboards, and Spaces allows us to brainstorm, assign, and track work all in one place. It’s flexible, visual, and highly customizable, perfect for managing multiple teams and projects across departments.
🤖 Fun Fact: ClickUp Brain users save 1.1 days per week. That’s not just “a few hours.” That’s enough time to binge-watch an entire season of Stranger Things, or, you know, finally finish that side project.
Got data, dates, and a deadline? Venngage helps you whip up timelines that look sharp and feel easy to follow without fiddling with formatting.
Just feed the AI a prompt, and it lays out your milestones in seconds.
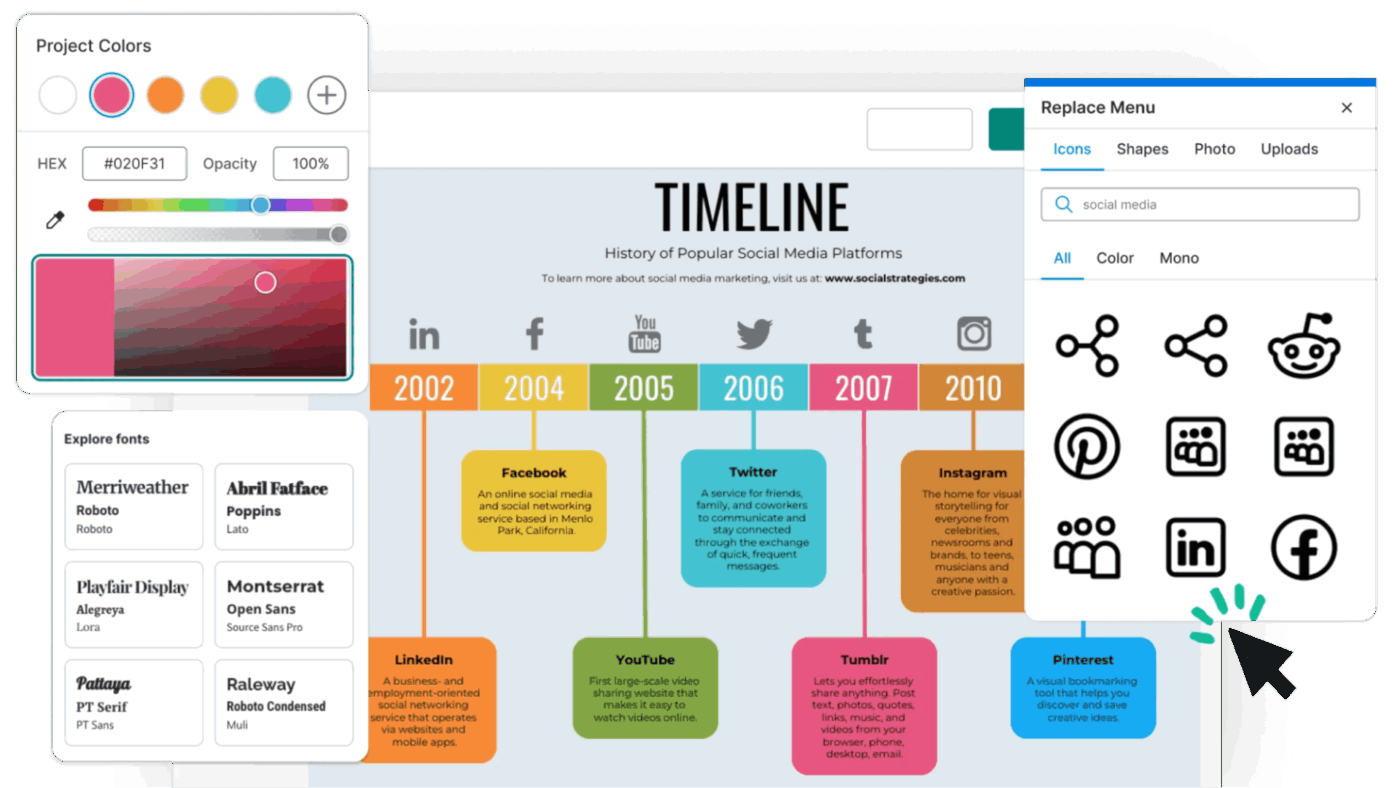
The platform is designed for visual communication, not just project management. This makes it ideal for transforming text-heavy reports, historical data, or internal process maps into professional-grade visual assets like infographics.
From nonprofit reports to hospital planning phases, the diverse and highly customizable templates ensure you can maintain your brand aesthetic. Crucially, Venngage focuses on accessibility, offering features like alt text generation and layout contrast checks, ensuring every infographic is clear, compliant, and impactful for a wider audience.
Here’s a G2 review:
Finally, we have a tool designed for amateurs to create appealing graphics. The interactive UI of the platform makes it very easy for anyone to use this tool. With tons of templates and excellent graphics, Venngage stands apart from its competitors.

MyLens AI automatically extracts key dates and events from your documents and organizes them into a clear, editable timeline.
It identifies important project milestones, arranges them in the correct order, helping you stay on top of project time management without the manual work. This AI tool also lets you add media, adjust labels, and export your timeline as an infographic, presentation slide, or visual.
The Chrome extension further enhances its utility by allowing users to instantly summarize and convert web content into visual formats on the fly.
Here’s a Product Hunt review:
Great! Very cool—I tested some impressive timelines with it. Everything happens effortlessly. If you provide more explanation, the results will be even better.
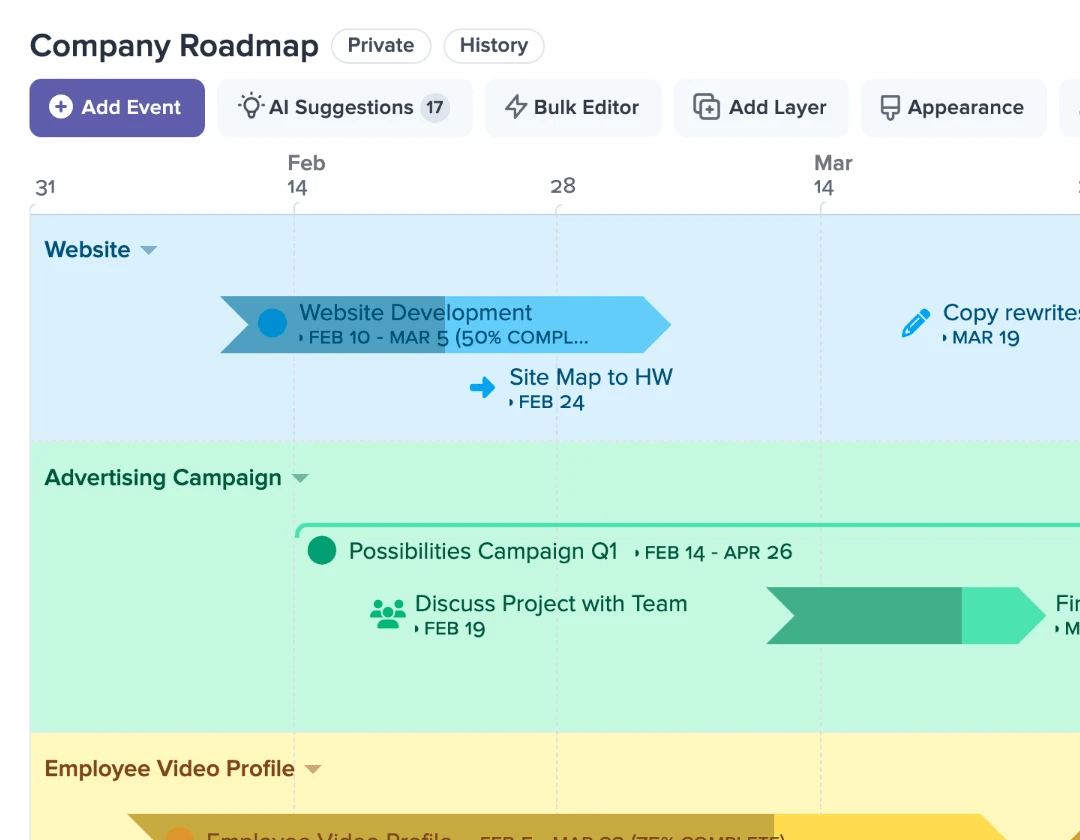
Preceden helps you turn complex plans into clear timelines, without the mess of spreadsheets or heavyweight project tools. It’s ideal for teams that need to visualize milestones across departments, align stakeholders fast, or present timelines in contracts, decks, or reports.
You can create timelines manually or generate them with AI, then customize everything from layers and progress tracking to themes and export formats.
For power users, it supports Dependencies, allowing one event to automatically start when another ends, which minimizes manual adjustments when plans shift. It also has a Bulk Editor for rapid data entry and can process durations (e.g., entering “3 weeks” and letting the software calculate the end date), providing a level of detail often only found in high-end project management software.
Here’s a G2 review:
Preceden assists you with monitoring individual ventures by making a real-time timetable for every one of your tasks. The course of events is truly spotless and flawless.
📮 ClickUp Insight: One in five employees says that simply knowing when decisions will be made would help them work faster.
Yet, in the rush of a busy day, communicating timelines often falls through the cracks.
That’s where ClickUp Brain steps in.
Acting as your AI-powered work copilot, it automatically gathers updates from tasks, threads, and docs—delivering daily digests, decision briefs, and summary comments.
Here’s to never having to chase people (or information). 💨
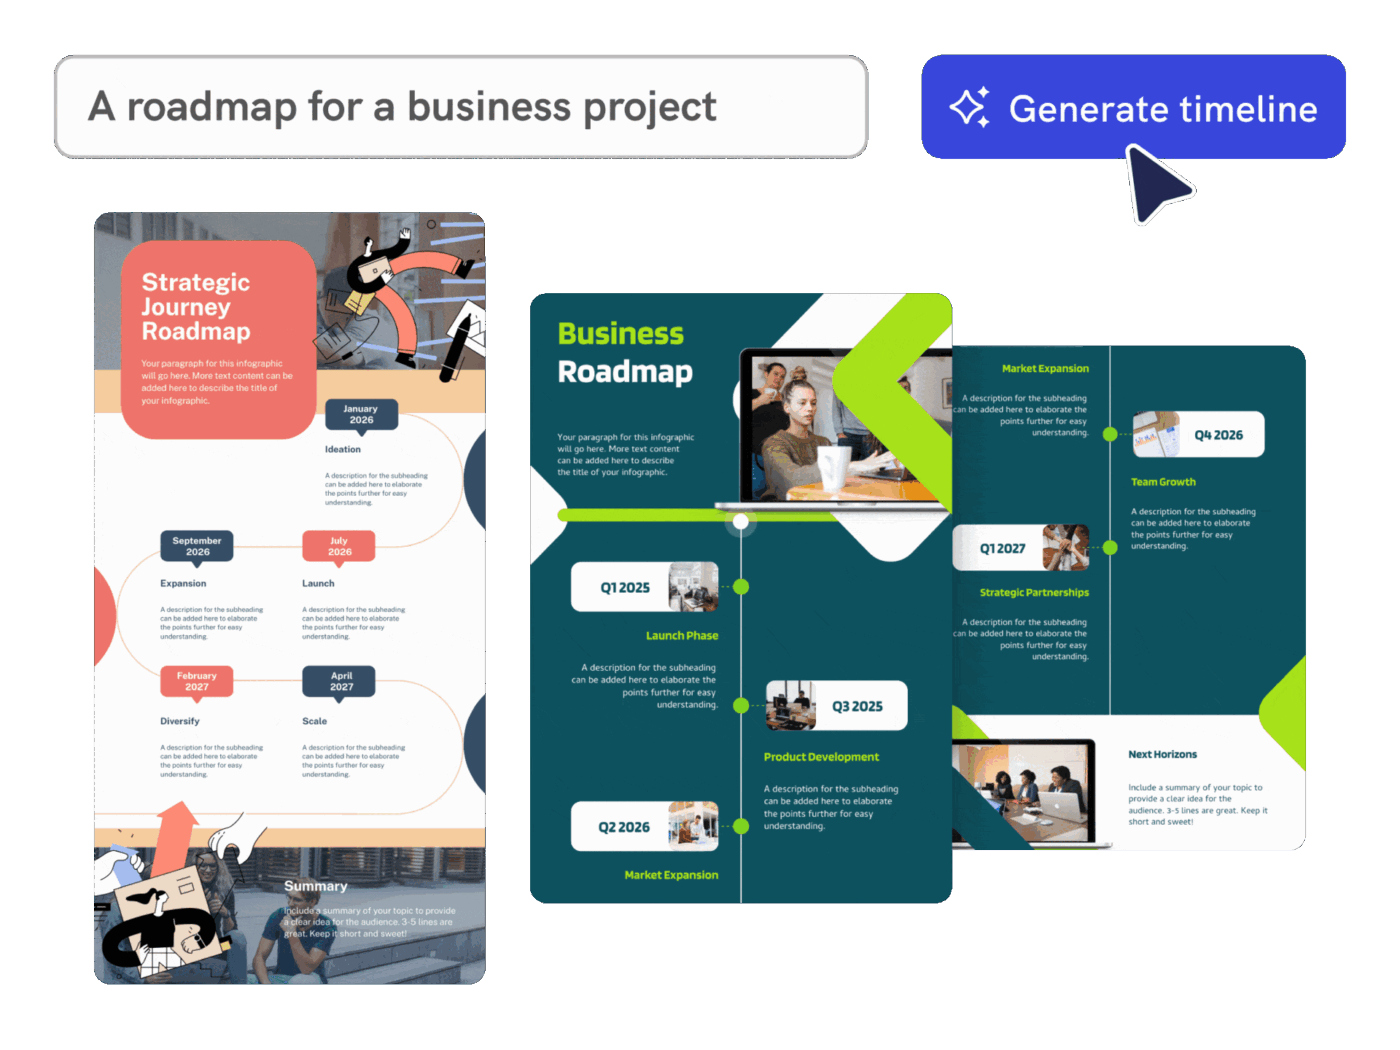
Piktochart AI makes timeline creation fast, stunning, and dead simple, even if you’re not a designer. Just describe your idea in a sentence, and it transforms your content into a timeline infographic within seconds.
It helps with mapping project milestones, laying out a company’s journey, or visualizing historical events. The editor lets you tweak the layout, add icons or media, and stay on-brand using their library of design tools.
You can then export your timeline as an image or PDF and share it with just a click. Its AI Outline feature intelligently analyzes pasted text or uploaded documents (PDF, DOCX) to create a clear, logical structure before the design process even begins, ensuring the resulting timeline is organized and readable.
Here’s a Capterra review:
My experience with Piktochart has been fantastic! It’s made my workflow much faster, and the AI tools are a dream for anyone looking to create beautiful reports, infographics, and presentations without needing advanced design skills.
📌 Not sure whether you need a Gantt chart or a timeline?
The two look similar but serve very different purposes. If you’re managing dependencies, deadlines, and workloads, a Gantt chart might be your go-to. But if you’re simply trying to map out key events or milestones in a visual way, a timeline will do the trick.
👉 Read this guide on Gantt vs. Timeline to understand when (and why) to use each.
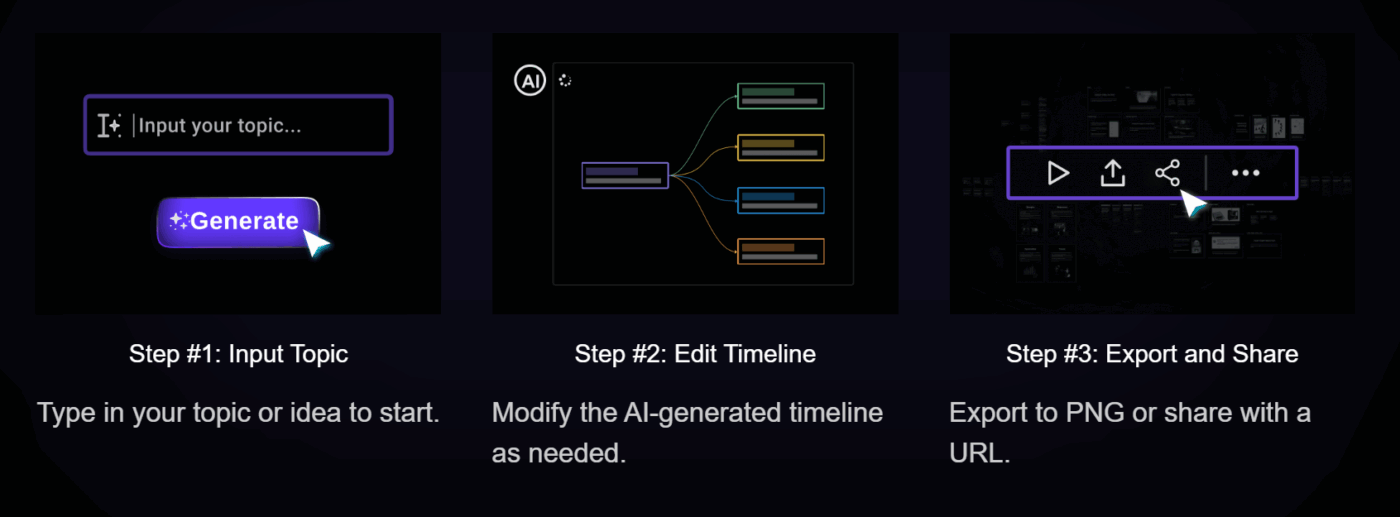
MyMap.AI makes turning ideas into visuals as easy as having a conversation. Just tell it what you’re working on, whether it’s a project plan, lecture notes, or content strategy, and it instantly generates flowcharts, mind maps, matrices, or even full presentations.
Unlike other tools, MyMap pulls in context from multiple sources.
Paste in PDFs, drop a link, or let it search the web in real time; it’ll stitch together the key info into a clean, editable visual.
Its AI-Native chat interface combines the ability to process multiple input formats (files, URLs, text) with real-time Google/Bing web search. This means you can ask it to generate a plan for a current event or a trending topic, and the AI will pull the most recent context from the web to stitch together the timeline, making it ideal for fast-moving content strategy or competitive analysis.
📚 Learn More: How to Optimize Efficiency with Time Tracking Reporting
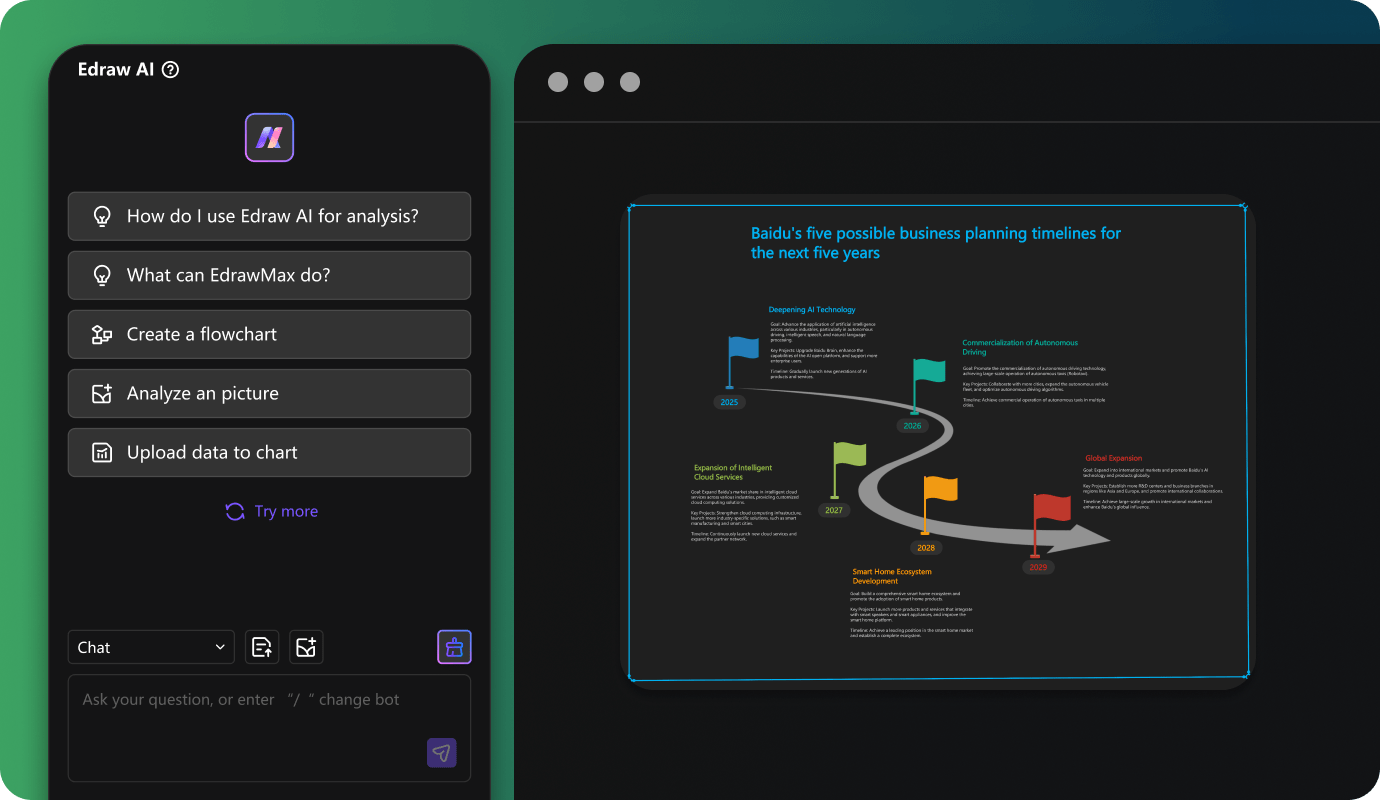
Edraw.AI helps you create professional timelines with its integrated chatbot that creates prompts for you. Once your timeline is ready, you can enhance it by dragging and dropping symbols and icons from the Clipart section and fine-tuning layouts using the right-side Canvas panel.
Here’s a Product Hunt review:
Edraw.AI has been a game-changer for me by enabling the creation of visual project timelines. With its flowchart and Gantt chart templates, I’m able to efficiently allocate tasks, track deadlines, and monitor progress.

ChronoZoom isn’t your typical project timeline tool; it’s built for big-picture storytelling.
Its foundation is the Seadragon deep zoom technology built on Windows Azure, which allows users to zoom across massive scales of time—from the Big Bang to the present day (a zoom factor of nearly 5 trillion)—without any lag, making it a powerful visualization tool for Big History research and interdisciplinary storytelling.
For B2B SaaS teams, it’s a creative time mapping tool to map the evolution of your industry, product features, or customer needs. Think keynote decks or high-impact content where you want to wow with context, like showing how AI-driven support tools became inevitable after decades of clunky ticketing systems.
Here’s an Edutopic review:
ChronoZoom breathes life into history. I can’t tell you how many students have told me they always found history boring before. Now it’s making sense to them. They see how different aspects of the past align.
🔖 Resource Library: Why build from scratch when you can customize a ready-made template? Check out these project timeline templates built to get your creative juices running.
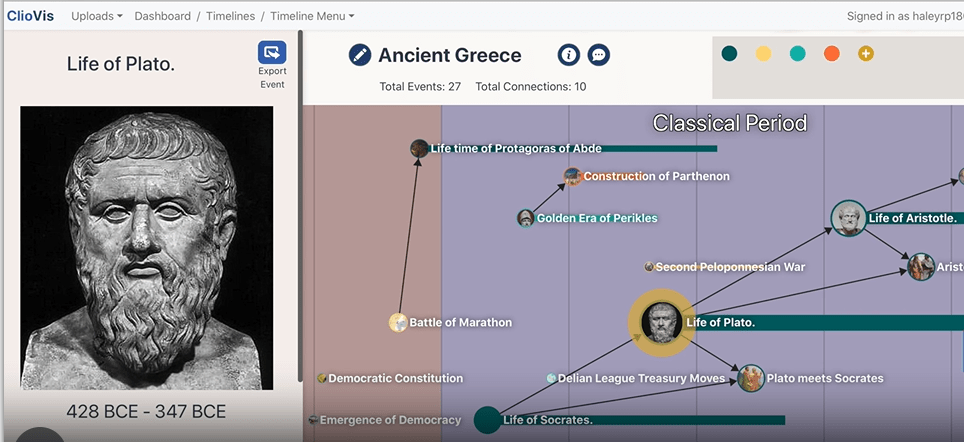
ClioVis brings together interactive timelines, story mapping, and mind mapping to help you visualize how ideas, events, and people connect across time.
Want to show cause and effect?
You can color-code events, draw connections between them, and even cite your primary or secondary sources right inside the platform.
It enables advanced users (like those writing dissertations or conducting long-term research) to assemble and visualize connections and relationships between people, events, and concepts over time, rather than just mapping when they occurred. This focus on relationship modeling is essential for researchers and genealogists looking to uncover and justify causality and connections within large datasets.
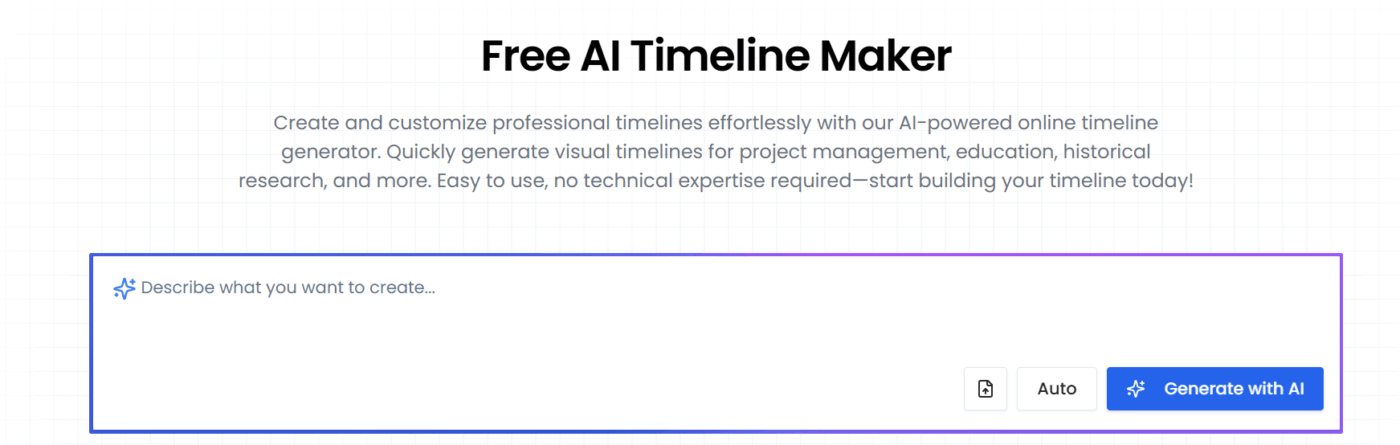
AI Graph Maker allows you to automatically create timelines with AI and organize events in chronological order. Whether you’re working on educational projects, personal planning, or project management, this tool helps you build clean, professional timelines.
All you need to do is enter key events manually or upload a file. The “Generate with AI” handles the rest. You can then customize the timeline by adjusting colors, fonts, layout, and content.
💡 Quick Tip: Instead of just setting a deadline and hoping for the best, try building your timeline backwards. Start with the end goal, then work in reverse to figure out what needs to happen and when. It’s a simple trick, but it takes the pressure off and makes the whole project feel way more doable.
For more such tips, check out our guide on 10 tips to improve time management!
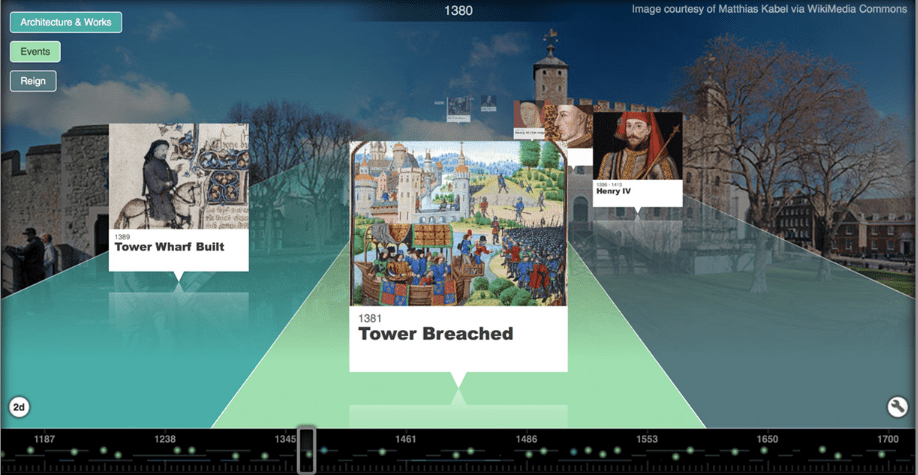
Tiki-Toki isn’t just another timeline maker, it’s where beautiful design meets powerful functionality. Its standout feature? A rotating 3D timeline view that gives your project a dynamic, almost cinematic feel.
It supports four different viewing options beyond the standard 3D helix view (including a “zoom out” function to avoid clutter), which, combined with its seamless integration with YouTube and Vimeo videos, allows for the creation of immersive, multi-modal timelines that are highly effective for educational and project presentation purposes.
Whether you’re showcasing company milestones or building a historical project for class, Tiki-Toki helps you turn static dates into an interactive, scroll-stopping story.
📚 Also Read: How to Use AI Tools to Maximize Productivity
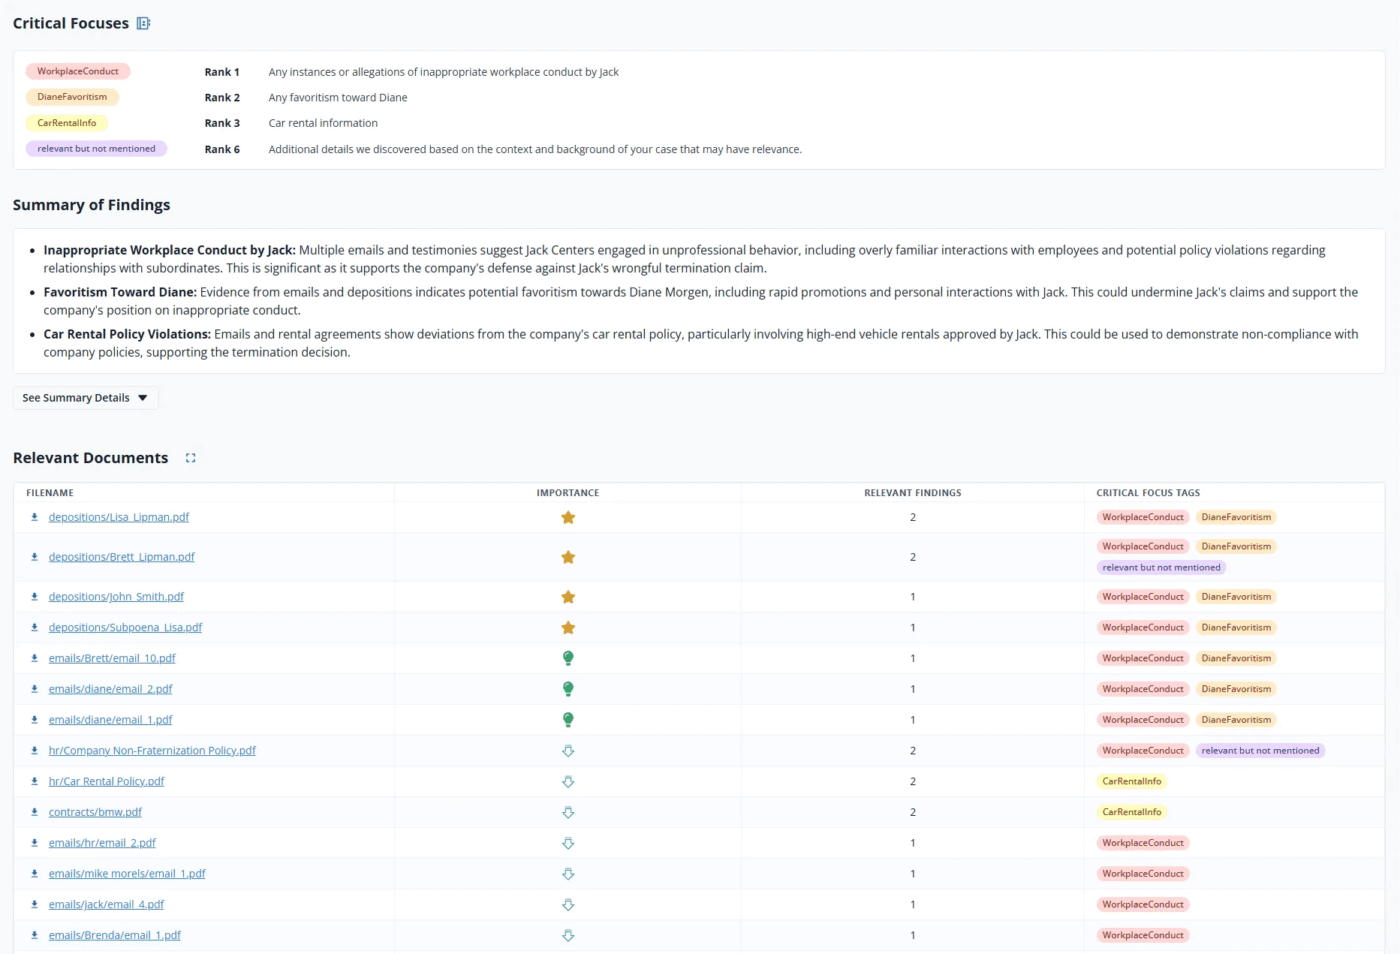
CallidusAI is built specifically for lawyers handling complex litigation. It automatically extracts key facts and dates from your documents and organizes them into clear timelines that integrate seamlessly into case memos, statements of fact, or briefs.
Best part? Its AI Timelines feature is integrated into a larger system that performs proprietary anti-hallucination checks to ensure 0% hallucination of case names in its legal research output. It is built to output production-grade documents that are Word-native and includes a redlining feature that can be trained on a firm’s own style guide, going far beyond a simple date-extraction tool for litigation.
The tool essentially acts like a full-stack legal assistant, helping you draft legal research memos, redline contracts, review discovery documents, and proofread with multiple lenses.
🧠 Next Read: Want to build engaging timelines in Excel instead? Excel might not be built for timelines, but with a few tweaks, you can still pull it off.
Timelines shouldn’t just sit pretty, they should actually move work forward.
From launch plans to legal cases, a good AI timeline generator lays it all out clearly. It shows you where things stand, what’s slipping, and what needs attention without digging through five tabs.
That’s where ClickUp comes in. It brings everything: tasks, goals, and people, onto one timeline that updates as your work evolves.
So, if your current setup doesn’t bring everything under one roof, it’s time for an upgrade.
Start building smarter timelines. Sign up on ClickUp for free today!

© 2026 ClickUp

There’s an easier way. Try a free AI Agent in ClickUp that actually does the work for you—set up in minutes, save hours every week.