
You’ve bagged a big project at work. However, your excitement is tinged with anxiety.
The end result is clear in your mind, but the path to get there? Not so much. How do you ensure every detail is covered and nothing falls through the cracks?
This is where project planning becomes your best ally. A well-carved-out project plan helps you allocate resources wisely, meet deadlines, and keep everyone on the same page.
And guess what? Chances are, you already have a powerful tool in your tech stack to execute this process: Microsoft Excel.
You might think of Excel as a spreadsheet software program, but you can also use it as a project management platform, especially if you’re just starting out. Excel allows you to design detailed project plans, organize tasks, track progress, and identify bottlenecks effectively.
In this post, we’ll show you how to create a project plan in Excel. And we’ll do you one better by introducing you to a far more user-friendly and scalable alternative!
How to Create a Project Plan in Excel
How to Set Up Your Project Plan in Excel
Follow this step-by-step guide to make project planning quick and easy and drive successful project execution.
1. Define your project goals and scope
Before you outline your project plan in Excel, define your project goals and scope of work in detail. You can use your Excel sheet or any other notes app or documentation tool here.
This step sets the foundation for your project and ensures everyone involved clearly understands what needs to be accomplished. Here’s a more detailed breakdown:
List down the primary objectives of the project
- Identify key objectives: Set specific, measurable, achievable, relevant, and time-bound (SMART) objectives/goals, such as “increase conversion rate through blog posts by 30%”
- Mark priorities: Rank your objectives based on their importance and impact
- Align with stakeholders: Connect with all internal and external stakeholders to ensure the project plan reflects everyone’s goals and expectations and there isn’t any room for ambiguity
Set boundaries and avoid scope creep
- Define the project scope and establish boundaries: Describe the specific deliverables of the project, including what is and isn’t included. For instance, if your project involves a website redesign, clarify whether it covers website copy or just the design and development
- Identify key milestones: Break the project into milestones highlighting significant phases or achievements. Assign specific tasks/deliverables and deadlines to each milestone. The breakdown is necessary to keep the momentum going and track progress
- Prepare for scope changes: Define a process for managing scope changes, such as handling new requests or modifications. For example, you can ask your client to fill up a change request form and require approval from both the client and the project manager to incorporate the request
2. Add project information
Now, create a fresh MS Excel document. Here’s how you can populate the cells with details:
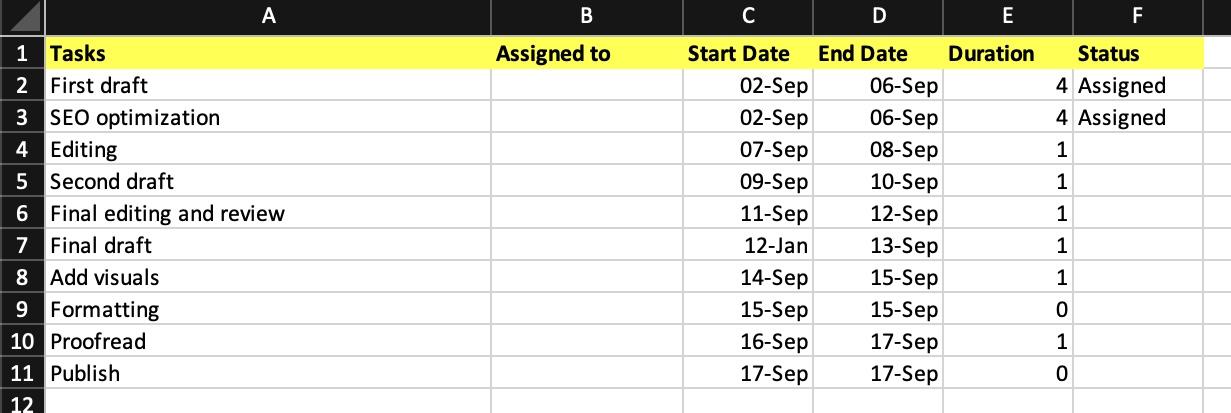
Add headers to the table
Add column headers in the second row of your table. Common headers might include Tasks, Assigned To, Start Date, End Date, Duration, Status, and similar categories. You can also bold the cells and fill them in with a color of your choice.
Enter project information
Fill the Task column with the tasks for your project plan. You can add as many or as few tasks as needed.
- Input the name of the person responsible for each task, along with the start and end dates
- In the Days column, type = in the cell where you want the duration to appear
- Click the End Date cell, type -, and then click the Start Date cell
- Press Enter to calculate the duration
- Drag the fill handle (the small square at the bottom right of the cell) down the column to apply the formula to the other cells. The duration will automatically update as you release the mouse button
- Enter the current status of each task using terms such as Pending, In Process, Under Review, or Completed
- To ensure all data is visible, select the entire table, go to the Cells group, click Format, and choose Autofit Column Width to automatically adjust column widths
3. Assign tasks to team members
You’ve already listed down the tasks that are necessary to complete the project. Now, you’ll assign tasks to team members and add necessary comments, if any.
Follow this process:
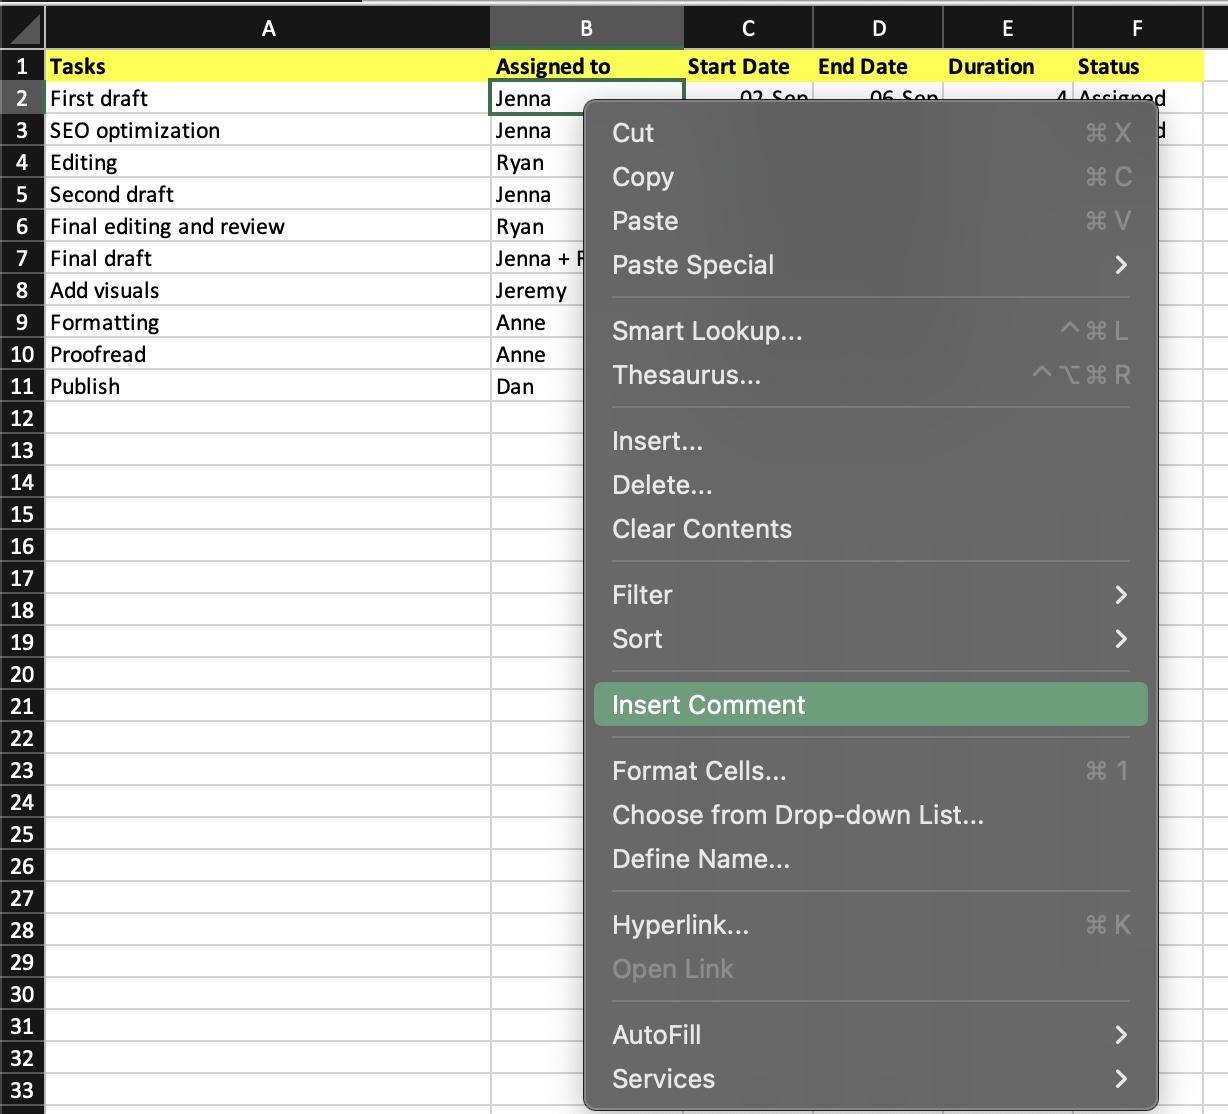
- Populate the Assigned To column with the names of team members
- Go to the cell you want to comment on
- Right-click this cell and choose Insert Comment to open the comment box
- Type your comment into the comment box that appears
- To notify a specific team member, type @ followed by their name within your comment
- Press Ctrl + Enter to finalize and post your comment
However, you cannot automatically adjust resources based on project progress or dynamically allocate tasks among team members. You have to update the cells manually.
4. Visualize the project timeline
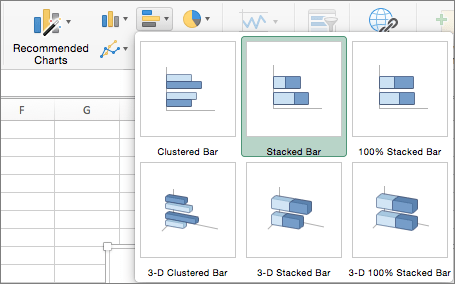
Excel doesn’t offer a built-in Gantt chart type, but you can create something similar by customizing a stacked bar chart and visualize the project timeline. Here’s how:
- Highlight the data you want to chart. If your data is in a continuous range, select any cell within that range. For non-continuous data, select the cells while holding the Command key
- Go to Insert > Bar Chart > Stacked Bar Chart
- Click the first data series (the blue section representing the start of the task) and then go to the Format tab. Choose Shape Fill > No Fill to make the start dates invisible
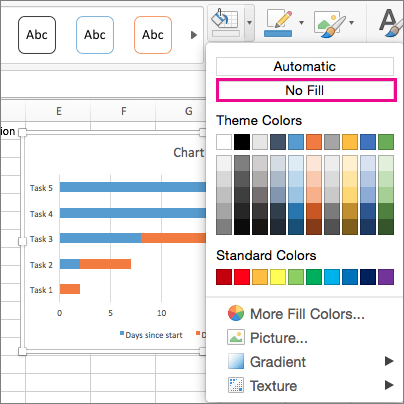
- Delete the legend or chart title if you don’t need it
- To make project tasks appear in the correct order, hold the CONTROL or Command key, select the vertical axis (Tasks), go to Format Axis, and choose Categories in Reverse Order
This will create a Gantt chart-like visualization.
Utilizing Excel Features for Project Management
Here’s how you can use Excel for project management:
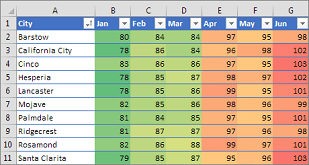
Conditional formatting
Conditional formatting in Excel allows you to automatically format cells based on their values or specific criteria. The visual distinction helps you quickly identify critical tasks, track the project’s progress, and manage deadlines effectively.
For instance, you can color-code tasks based on their status (e.g., Assigned/In Progress, Pending, Completed) or priority levels (e.g., High, Medium, or Low).
To set this up, select the cells you want to format, go to the Home tab, click Conditional Formatting, and choose a formatting rule that suits your needs.
💈 Bonus: Here is a step-by-step guide on how to color code in Excel
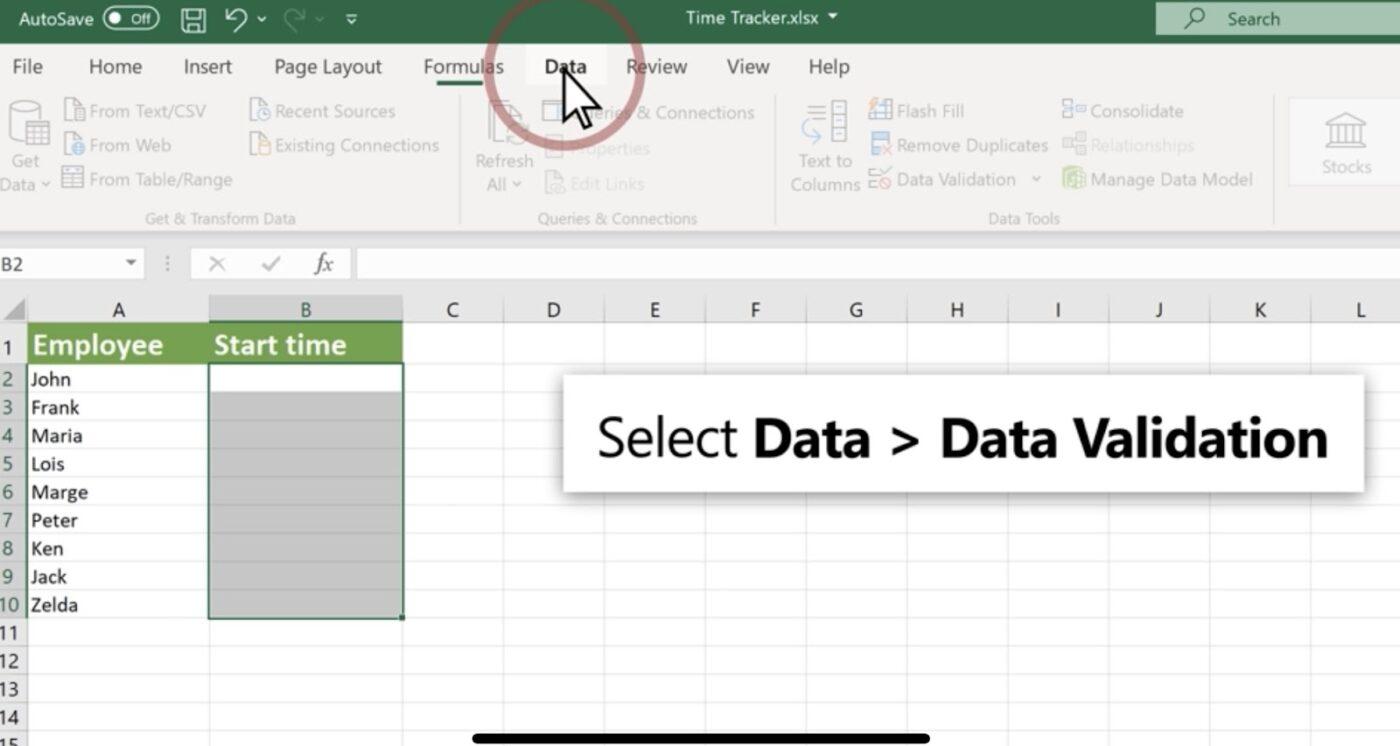
Data validation and drop-down lists
Data validation and drop-down lists in Excel streamline data entry, ensure consistency across your project plan, and reduce errors. Creating drop-down lists provides some predefined options for team members to select from.
For example, you can set up a drop-down list for task statuses, such as In Progress and Completed.
To implement this:
- Select the cells where you want the list, go to the Data tab
- Click Data Validation, and choose List from the options
- Enter your list items and click OK
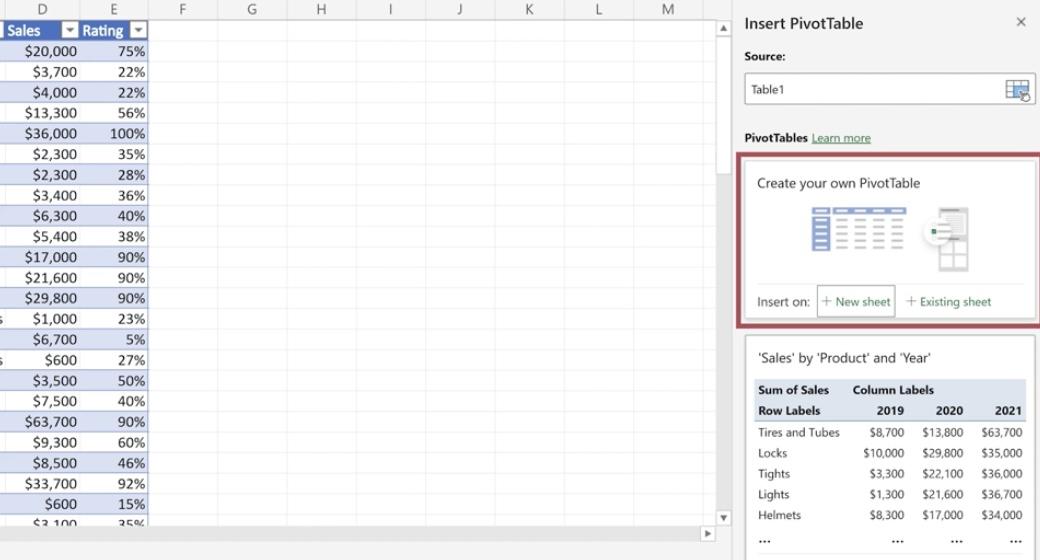
PivotTables for data analysis
PivotTables in Excel helps you analyze large data sets by creating interactive reports. Whether you want to track project milestones, generate summaries, analyze task completion rates, identify trends, or compare resource allocation, this feature does it all.
Here’s how you can create a PivotTable:
- Select your data range
- Go to the Insert tab and choose PivotTable
- Under Choose the Data That You Want to Analyze, click Select a Table or Range
- In Table/Range, verify the cell range
- Under Choose Where You Want the PivotTable Report to Be Placed, select New Worksheet or Existing Worksheet and pick the location you want the PivotTable to appear
- Select OK
Apart from these features, you can create graphs in Excel to present raw data visually or make flowcharts in Excel to break down complex processes into simple, easy-to-follow steps.
Excel can be used for project management, but it might not be the best option if you’re looking for advanced features, scalability, and project lifecycle tracking.
Tracking and Updating Your Project Plan in Excel
After you create a project plan, you should have provisions to adjust the plan on the go, collaborate seamlessly, and track progress. In Excel, these tasks will require some manual effort.
Here are some tips for you to follow:
Keep your project plan up-to-date in real time
- Enable the Shared Workbook feature in Excel and let multiple team members edit the project plan simultaneously. Everyone can work on the current version of the document, minimizing overwrites and conflicts
- Connect your Excel sheet to external data sources using Power Query or data connections. The project plan will update automatically with the latest data from other systems
Set up a dashboard to monitor key performance indicators (KPIs)
- Use Excel’s charting tools to create visual representations of your KPIs, such as progress bars for task completion, line graphs for project budget tracking, or pie charts for resource allocation
- Incorporate slicers or dropdown menus to let users filter data and view KPIs specific to certain tasks, teams, or time frames
Regularly update task statuses and review project milestones
- Set up a column to track task statuses (e.g., Assigned, Not Started, In Progress, Completed). Update these manually daily to ensure the project plan reflects the current state of the project
- Schedule regular check-ins with team members to review project milestones. Update the project plan with any changes in timelines or deliverables so the plan stays aligned with project goals
Collaboration tips for teams using Excel
1. Communicate within Excel: Use Excel’s Insert Comment feature to leave notes or feedback on specific cells or tasks and communicate directly within the document
2. Leverage version history: Save versions of your project plan regularly to track changes over time. You can do this manually or by using Excel’s Version History feature if the workbook is stored in OneDrive or SharePoint
3. Maintain consistent formatting: Use consistent formats and styles for your data, such as color-coding and cell formatting
4. Use data validation: Implement data validation rules so the data entered into the workbook meets predefined criteria. It reduces errors and maintains data integrity
5. Provide training: Invest in employee training to make all team members familiar with Excel’s features and best practices for collaboration and improve overall efficiency
Limitations of Using Excel for Creating a Project Plan
While you can list your tasks in Excel, it fails to meet your expectations from an effective project management tool. Here are some of its major drawbacks:
- No built-in Gantt chart: You can adapt Excel to simulate Gantt charts, but it lacks the dedicated, built-in functionality found in project management tools
- Limited task dependencies: Managing task dependencies (e.g., finish-to-start, start-to-start) in Excel requires manual workarounds. Unlike specialized project management software, Excel does not automatically adjust dependent tasks when a predecessor task’s timeline changes, increasing the risk of scheduling conflicts
- Version control issues: Cloud storage solutions can somewhat mitigate this, but managing version control in Excel can still be problematic. Project team members may accidentally overwrite important updates or work on outdated versions, leading to confusion and errors
- Limited real-time collaboration: Excel offers real-time collaboration to a certain extent. However, it’s not powerful enough to accommodate complex projects with multiple collaborators. Conflicts can arise when multiple users try to edit the same cell or range simultaneously
- Manual updates required: In Excel, updates such as task status changes, schedule adjustments, or resource allocations require manual work. This increases the risk of errors and makes keeping the project plan up-to-date labor-intensive.
If you’re managing a small project as a solopreneur with minimal complexities and dependencies, Excel can be a good option. However, Excel will fall short if you’re scaling your business, looking to onboard more team members and clients, and want to design and visualize a detailed project plan. In such cases, you’ll need a comprehensive project management tool.
Alternatives to Excel to Create a Project Plan
When looking for an alternative to Excel for project planning, be sure to check out ClickUp.
With this powerful project management tool by your side, mapping out a project plan is a breeze, no matter how large or complex your workflow is.
Let’s give you a glimpse into how you can create a project plan in ClickUp.
1. Collect project information with ClickUp Forms
When creating a project plan, buy-in from both internal teams and external stakeholders is necessary. This step requires a clear communication channel to ensure everyone agrees on the project’s outline, scope, resources, timelines, and overall planning.
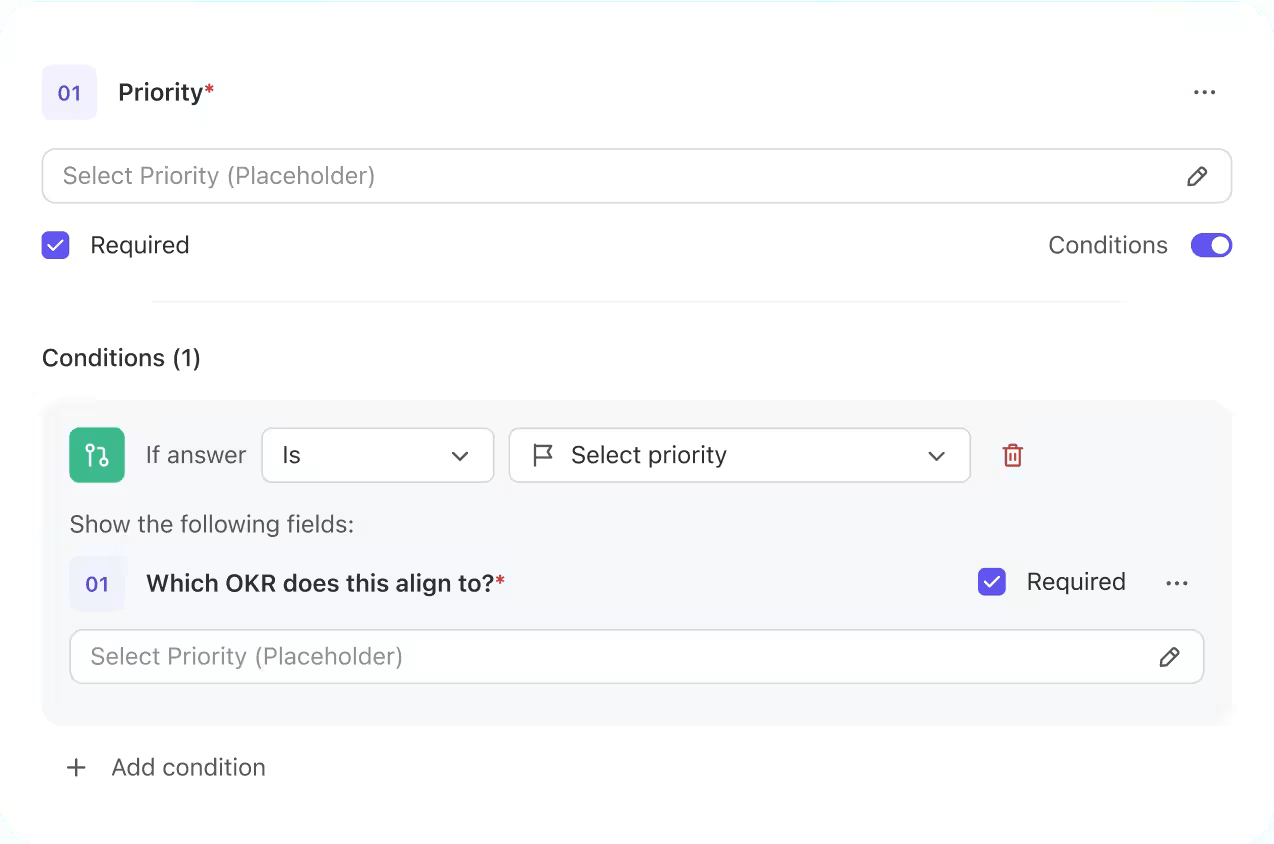
ClickUp’s Form View enables you to create customizable forms with conditional logic to capture relevant data. No more long email threads and unnecessary back-and-forth!
You can also turn the form responses into trackable tasks to fast-track the creation of the project plan.
2. Collaborate with stakeholders using ClickUp Docs
Based on the information received, it’s time to outline the project’s goals, scope, timelines, and other relevant details.
You can use Clickup Docs here—a collaborative document where you can work in real time with stakeholders. You must document details such as project title, description, timeline, communication plan, and project objectives.

3. Set up actionable objectives with ClickUp Goals and ClickUp Tasks
Once you’ve listed your project goals, the next step is to break them down into smaller bits and attach them to KPIs. ClickUp Goals proves useful here. This tool helps you divide big projects into manageable task targets.
Your team can take it one step at a time using ClickUp Tasks without feeling overwhelmed while tracking how their daily progress creates an impact.

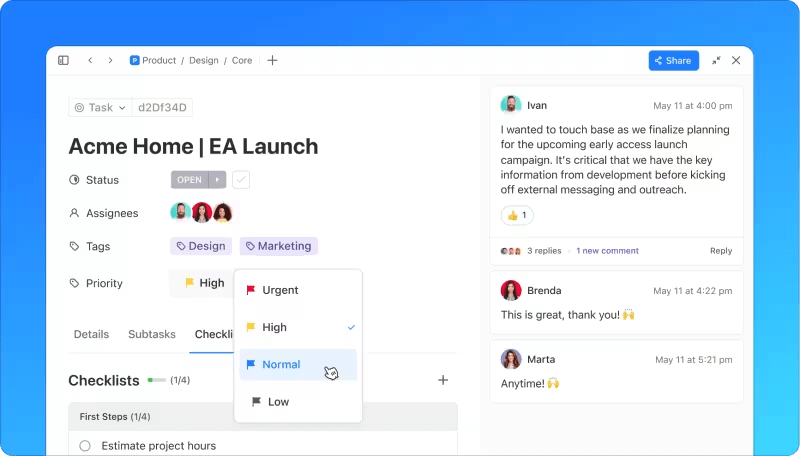
Once you set the goals, break down each into multiple ClickUp Tasks. For each task, ClickUp allows you to:
- Prioritize the task as Urgent, High, Normal, or Low
- Assign the task to team members
- Set task dependencies
- Set deadline
- Track progress toward the goal
- Break down the task into subtasks, if required
And with that, your project plan is almost ready.
4. Visualize your project plan with ClickUp’s built-in customizable views
Designing the project plan isn’t enough. You should be able to visualize it in a way that works for you and your team. Why is it important? Visuals help you make sense of the project plan at a glance, keep a tab on progress, and understand how the different moving pieces of the project are connected.
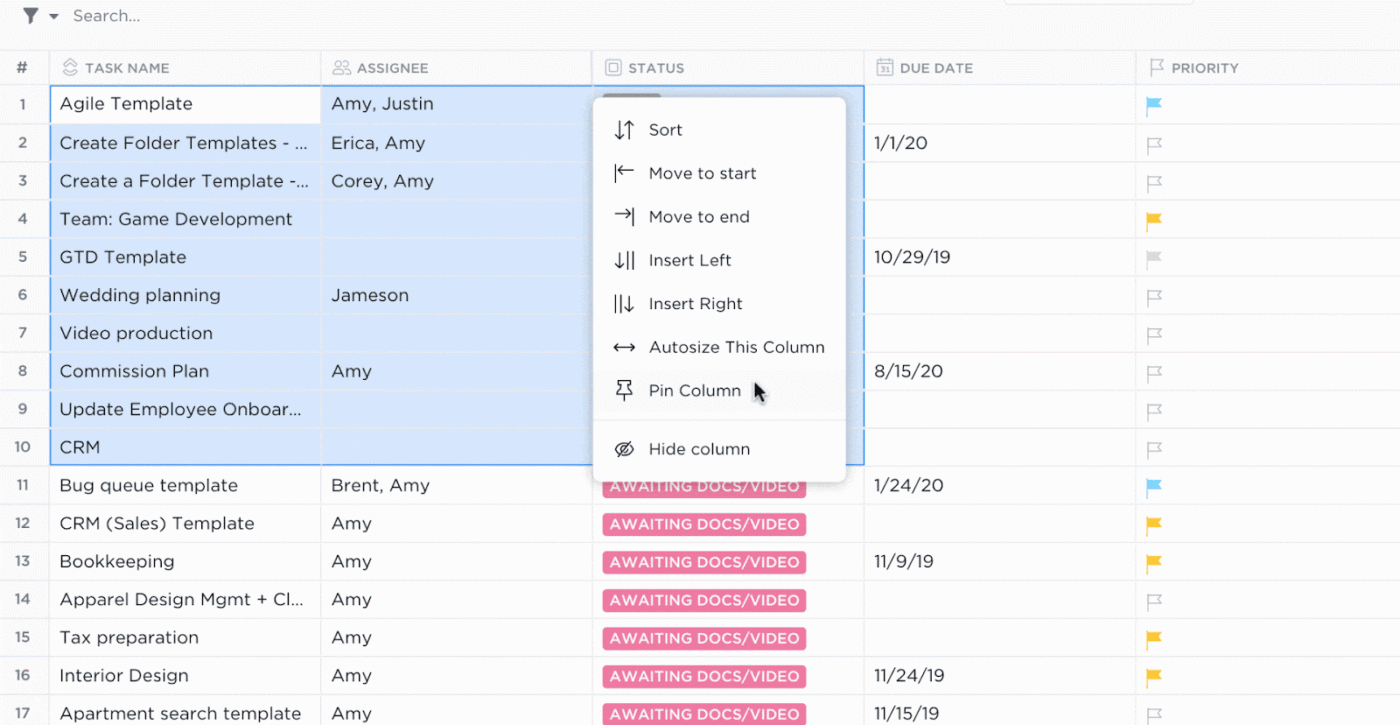
Among its 15+ customizable views, you can use ClickUp’s Table View and Gantt View to stay on top of your project plan.
ClickUp Table view
Table view in ClickUp lets you build a no-code visual database to store, manage, and control your project plan.
Here’s how you can add a Table View to your ClickUp Workspace (available for all plans):
- Click + Add in the Views Bar to open the Views modal
- Check the Private View box if you want to keep this view restricted to yourself, or check the Pin View box if you want it to always appear in your Views Bar
- Select Table
- Once the view is created, you can name it and customize it using the Customize menu on the right
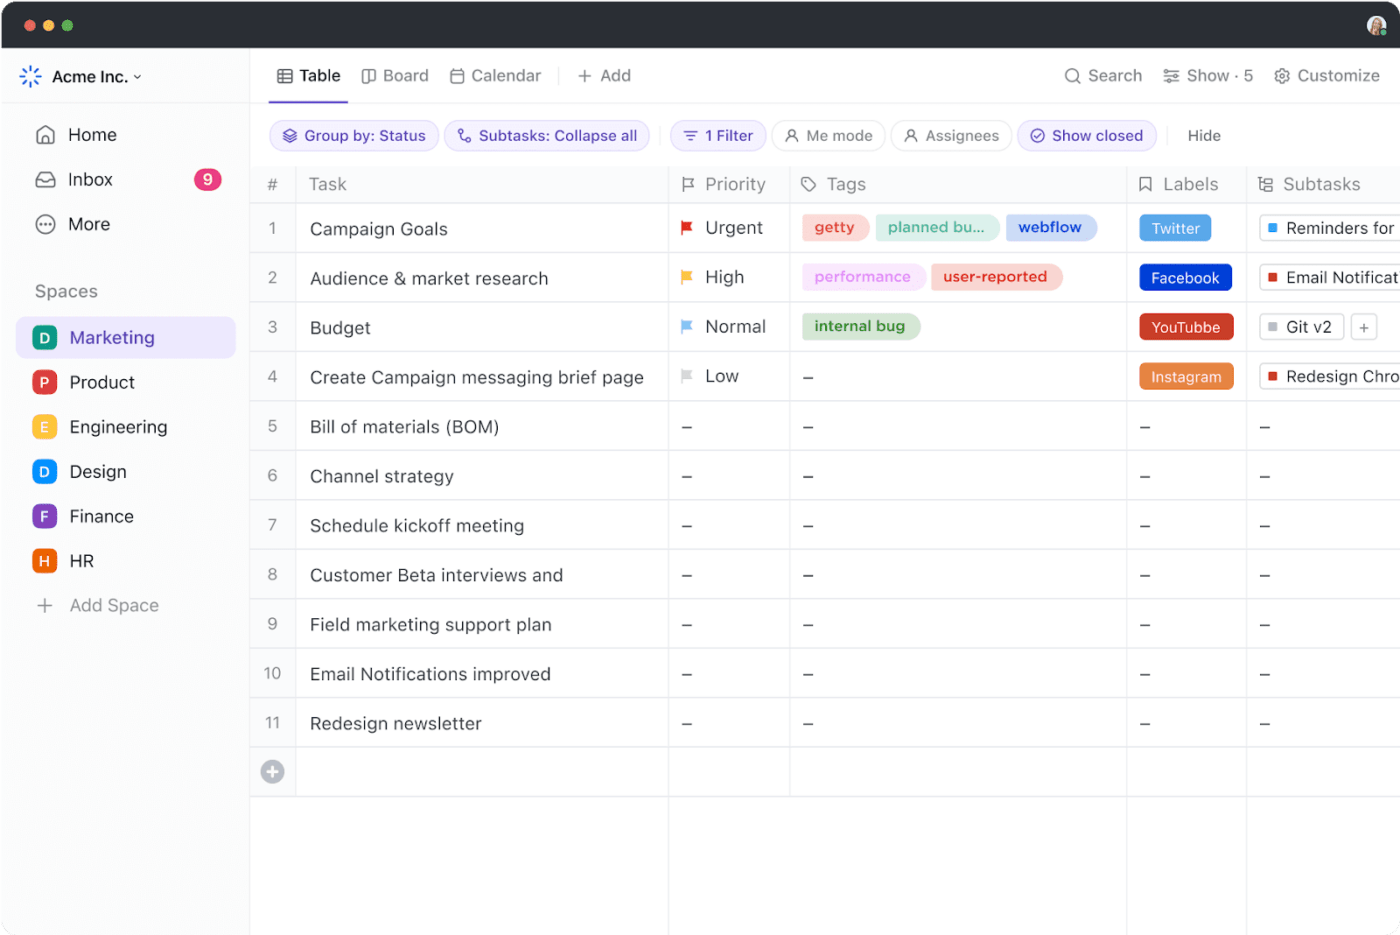
The Table view is handy when you have a big project plan involving multiple goals, tasks, subtasks, dependencies, and fields. This feature empowers you to:
- Organize tasks and edit data in bulk with intuitive tables
- Tailor the table with Custom Fields to fit specific stages in your workflow
- Link related tasks, documents, and dependencies
- Locate the desired data quickly with powerful filtering and grouping
- Hide and pin columns to easily sort and track information
- Drag and drop columns to keep the project plan more organized
Sharing your Table view is seamless—use publicly shareable links to keep clients in the loop or let anyone else access your project. You can also export your data as spreadsheets for easy access or quickly copy and paste information into other spreadsheet tools.
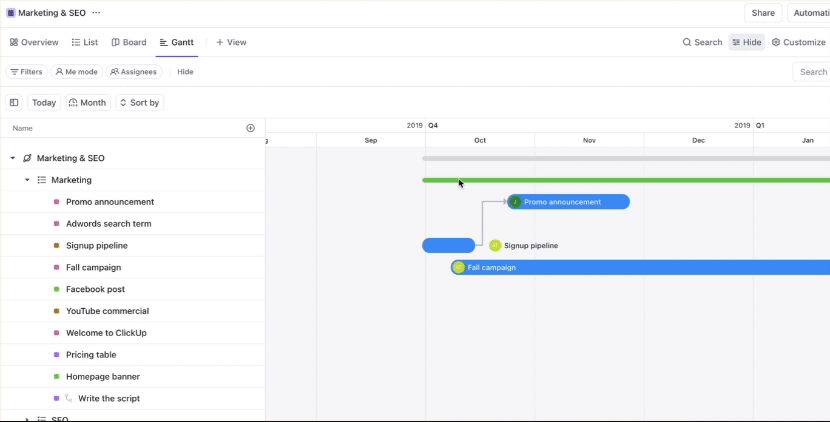
ClickUp Gantt view
ClickUp’s Gantt view lets you plan your project timeline, manage resources, and see task dependencies. It’s perfect for tracking project progress and resolving possible delays.
Follow these steps to add a Gantt view to your ClickUp Workspace:
- Click + View in your Views Bar
- To keep the view private, check the Private View checkbox or pin it to your Views Bar by selecting the Pin View checkbox
- Choose Gantt
- After creating the view, you can name and customize it using the Customize menu in the upper-right corner
Let’s consider a real-life scenario to understand how you can use theGantt view.
Assume your project plan changes midway, and you have to reschedule multiple tasks. With Gantt View, you can adjust your scheduled tasks’ start and due dates in bulk by moving an entire Space, Folder, or List. Just drag the progress bar left or right in Gantt view, and the schedules will shift everything accordingly.
Speed up the project planning process with project plan templates
The good news is that you don’t have to create a project plan from scratch (unless you want to!)—thanks to project plan templates. The ClickUp library has a bunch of them in store. Let’s check out a few:
ClickUp’s Example Project Plan Template
Ideal for software development projects, ClickUp’s Example Project Plan Template simplifies the complex planning process and saves you time. The framework allows you to create a detailed project plan to organize tasks, phases, assignees, due dates, status, department, impact level, effort level, and more.
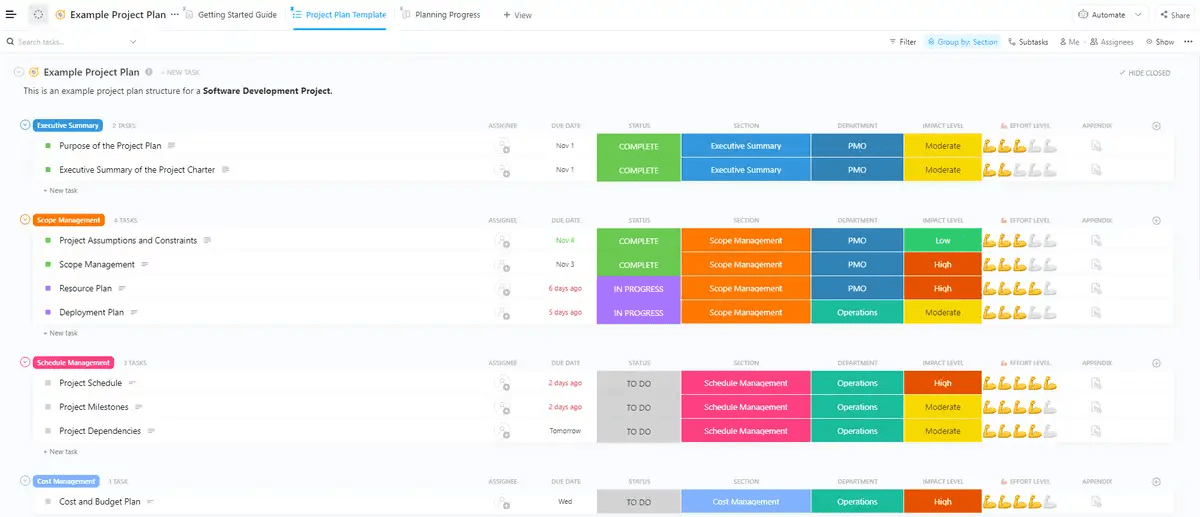
This template empowers you to:
- List down tasks and milestones necessary to complete a project
- Identify dependencies between tasks for more efficient planning
- Share the plan with stakeholders to keep everyone aligned
- Track progress against goals and make adjustments on the go
ClickUp’s Planning a Project Template
For projects that span multiple phases and a long duration, having a solid framework is essential to keep the team focused. ClickUp’s Planning a Project Template is designed to help with that by tracking the project’s start date, due date, and overall project timeline, as well as showing the progress percentage of each task.
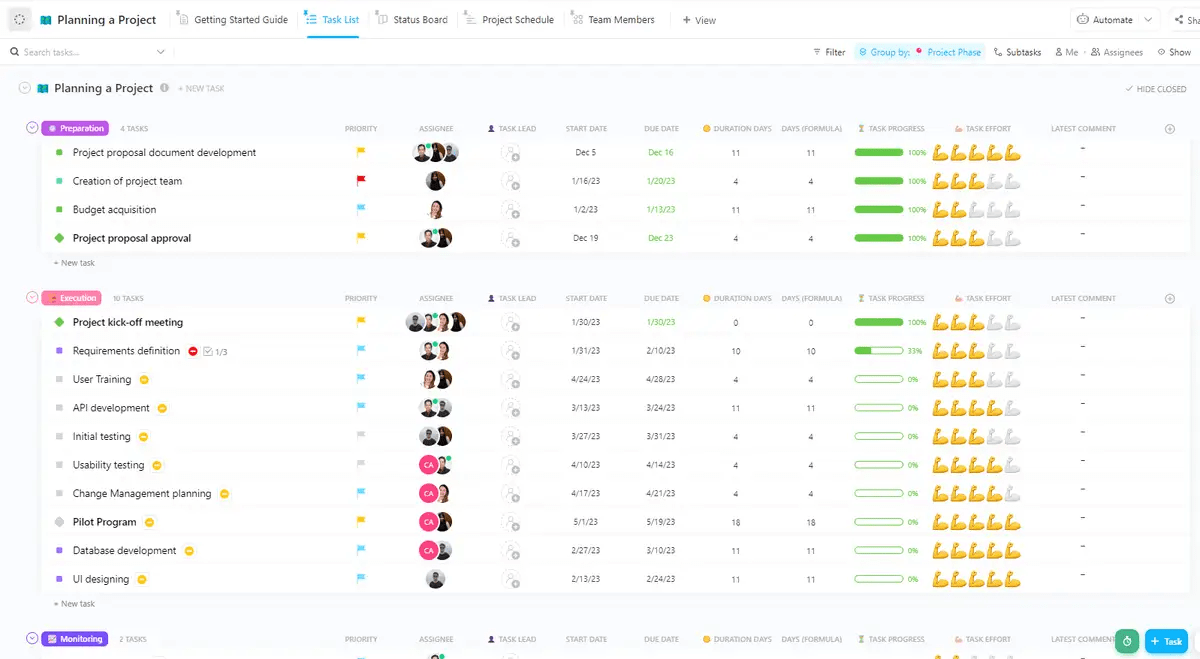
With a quick glance, you can spot any bottlenecks and take action—like reallocating resources to tasks nearing their deadlines but not progressing as expected.
Excel vs. ClickUp for project planning and management: A quick rundown
| Feature | Excel | ClickUp |
| Task management | Basic task lists; limited to manual updates | Advanced task management with subtasks, multiple assignees, and priorities |
| Collaboration | Limited; changes are tracked manually, with basic commenting | Real-time collaboration, comments, mentions, and task assignments |
| Project tracking | Manual tracking with charts and formulas | Built-in project tracking with Gantt charts, Kanban boards, and timelines |
| Task dependencies | Not natively supported; requires manual workarounds | Powerful dependency management with three types of relationships: Waiting on, Blocking, and Linked Tasks |
| Reporting | Basic charts and graphs; custom reports require manual creation | Advanced reporting tools, customizable dashboards, and real-time analytics |
| User interface | Simple grid layout; can become cluttered with large data sets | Intuitive, user-friendly interface with customizable views (list, board, table, etc.) |
| Automation | Limited automation; relies on manual updates and macros | Extensive automation options for repetitive tasks and workflow optimization |
| Resource management | Basic; manual tracking and calculations | Advanced resource management, including workload and capacity planning |
| Accessibility | Primarily desktop-based; online collaboration is limited | Cloud-based with mobile app support, ensuring access from anywhere with real-time updates |
| Customization | Customizable with formulas and macros but limited in scope | Highly customizable with flexible views, custom fields, and task types |
Step Up Project Planning and Management with ClickUp
Excel is a great starting point for project planning, especially for new project managers who need a simple and familiar tool to organize tasks and track progress.
However, Excel’s limitations become more apparent as projects grow in complexity and scale. At this stage, advanced customizations and features become essential. This is where a dedicated project management tool like ClickUp shines.
With advanced features, including task dependencies, real-time collaboration, detailed reporting, visualization, and project plan templates, ClickUp empowers you to handle evolving project demands, keeping your team on track.
Get started with ClickUp today!


Everything you need to stay organized and get work done.

Recent Articles
How to Create a Project Plan in 2026: 7 Steps & Examples 
How to Create a Project Plan in 2026: 7 Steps & Examples
Website Project Management: Plan, Build, Launch on Time 
Website Project Management: Plan, Build, Launch on Time
