


Still downloading templates?
There’s an easier way. Try a free AI Agent in ClickUp that actually does the work for you—set up in minutes, save hours every week.
Sorry, there were no results found for “”
Sorry, there were no results found for “”
Sorry, there were no results found for “”
The stock market runs on more than earnings and economic data. It also depends on mood.
People respond to their environment, and those responses often appear in sentiment before they show up in the numbers.
That is where stock sentiment analysis helps. Instead of guessing from a handful of headlines, it systematically reads what people are saying across various media channels and maps that to bullish, bearish, or neutral sentiment.
In this guide, you will learn how stock sentiment analysis works, where it helps (and where it falls short), and how tools like ClickUp can keep all that market sentiment, research, and follow-up work organized in one place. 📈
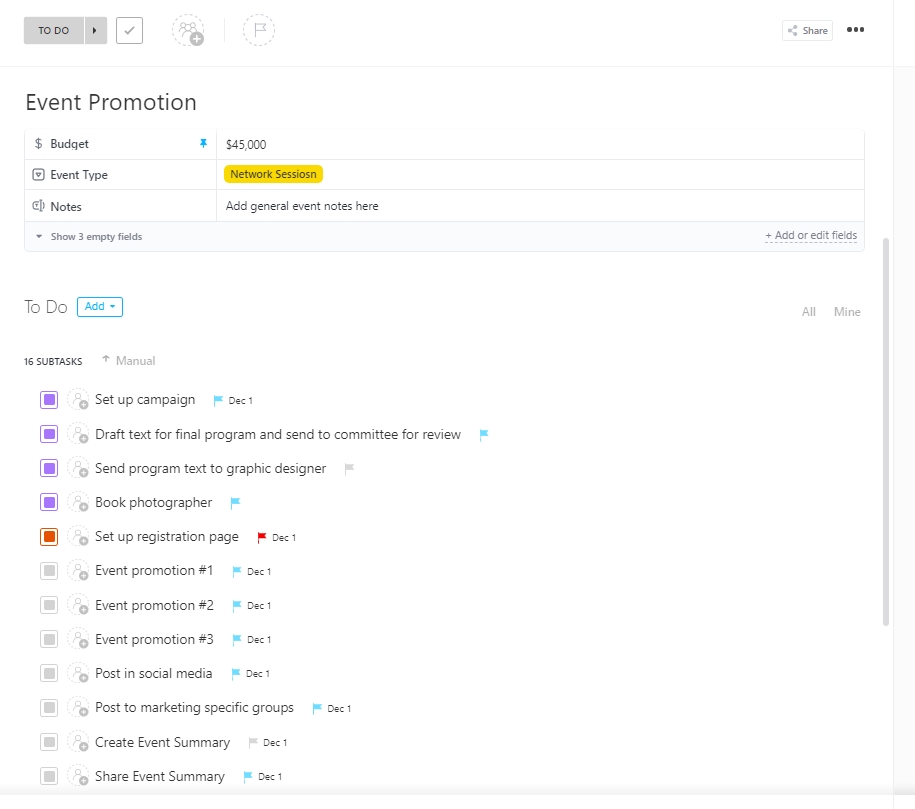
What is the one thing that can change investor sentiment? Events! ClickUp’s Event Promotion Template gives you a structured way to plan and track every promotional task around your next investor-facing event, from social posts and email invites to reminders and recap content.
🧠 Did You Know: Tweet sentiment can predict intraday stock market trends. An analysis of nearly three million stock-related tweets found that tweet-based sentiment was a strong predictor of short-term market trends in both developed and emerging markets.
Imagine you are following the stock price of a well-known tech company. The fundamentals look strong on paper, but then a sudden wave of negative sentiment spreads after critical news articles and social media posts surface.
Here’s what likely happens next: Within hours, the stock price dips, not because the company’s financial metrics changed overnight, but because investor sentiment shifted.
✅ This is exactly where stock sentiment analysis steps in.
At its heart, stock sentiment analysis is about listening closely to the mood of the market. It takes textual data from many places, such as:
From there, it uses natural language processing to determine whether the overall feeling is optimistic, pessimistic, or somewhere in between.
By recognizing these emotional undercurrents, traders and analysts gain a clearer view of the forces that drive stock price movements beyond balance sheets and income statements.
🧠 Did You Know: A study from China took a thoughtful look at how people’s feelings shared on social media actually moved house prices. Researchers listened to what homebuyers were saying online and built something called a “housing market sentiment index.” They then examined 30 cities over time—and found that when sentiment in one city increased, home prices tended to rise there and also in nearby cities. The crux of the issue is that a surge in shared optimism, or even concern, can spread across nearby areas and subtly increase prices.
Behind every price movement are people, and people do not always act in purely rational ways.
A striking example occurred in early 2025, when Nvidia’s shares dropped almost 17% in a single day following the launch of China’s DeepSeek AI model. The fall was not simply about earnings or fundamentals.
It was tied to a sudden surge in negative sentiment, with mentions of Nvidia spiking more than 200% in that week alone.
This is where stock sentiment analysis turns those emotional undercurrents into something investors can read, track, and test. But how does it actually work?
Behind the scenes, advanced tools powered by natural language processing and machine learning sift through mountains of textual data. This includes everything from news articles to earnings reports. The text is cleaned, structured, and then classified as positive, negative, or neutral.
When put together, these pieces form a picture of whether a stock or the broader market is moving toward bullish sentiment, bearish sentiment, or a more neutral sentiment.
💡 Pro Tip: If you want a simple way to start, keep an eye on sentiment indicators like the CBOE Volatility Index (VIX), often called the “fear index.” You can also try tools that track social media mentions of a particular stock. Pairing these signals with fundamental analysis or technical analysis can give you more balance in your trading strategy and help you make more informed decisions.
🧠 Did You Know: Studies show that weaving public sentiment into stock price models can improve predictions by as much as 20%. This just shows how powerful these insights can be when paired with traditional research.
Studying patterns uncovers more than just price movements. The benefit is seeing the bigger picture: not just the data, but how the market will react.
Here is what thoughtful use of stock market sentiment analysis can support:
📮 ClickUp Insight: In our survey, 78% of people said they make detailed plans when setting goals. Yet nearly half admitted they don’t track those plans with any dedicated tool. 👀
With ClickUp, you can turn those goals into step-by-step tasks that are easy to follow through. Our no-code dashboards then give you a clear picture of your progress, so you always know where you stand and what needs attention. Because simply “hoping it works out” is never a plan.
💫 Real Results: ClickUp users report they can handle around 10% more work without feeling stretched too thin.
Sometimes it helps to see how this plays out in real life. To make sense of how sentiment works, let’s look at a few companies we all know.
In May 2024, the online persona known as Roaring Kitty returned and shared some fresh posts. Excitement spiked, and GameStop jumped 75%, with trading halts along the way. The business did not change overnight. The mood did.
What this teaches us
A burst of attention can swing market sentiment from calm to electric. Tracking social media mentions and forum sentiment around a particular stock can flag sudden price fluctuations and help with risk management before you are caught off guard.
In September 2023, reports said some government offices in China were curbing iPhone use. The headline stirred worry about demand, and Apple shares fell over 1.5%, even as details were still developing. Follow-up reports tried to soften the picture, but the first wave of negative sentiment had already moved the stock.
What this teaches us
Early headlines can sway public perception and trigger quick market reactions. Monitoring sentiment can assist you in distinguishing long-term market trends from fleeting fears.
In 2023 and 2024, Netflix cracked down on password sharing. Many expected backlash, yet sign-ups and subscribers climbed, and the narrative turned more positive. As investors saw that the move was working, sentiment improved and helped support the share price.
What this teaches us
When sentiment indicators start to brighten around a policy change, it can hint at improving stock returns before every quarterly figure is available. Pairing those shifts with historical data and other market indicators gives a steadier view of the story.
📖 Also Read: How to Use AI for Data Analysis
When Spirit Airlines filed for bankruptcy again in 2025, Frontier’s stock jumped as investors immediately sensed opportunity: Frontier could absorb parts of Spirit’s business and routes. The companies’ financial metrics had not fully adapted yet, but the immediate change in sentiment pushed Frontier’s share prices higher.
What this teaches us
Sentiment often follows opportunity. Sometimes a competitor’s bad news can shift public opinion and benefit other players in the same space long before the full market data shows up in reports.
Big data tools and AI tools for stock sentiment analysis help you listen to the market at scale rather than relying on a few headlines. Here are some of the most useful options for traders, retail investors, and financial analysts.
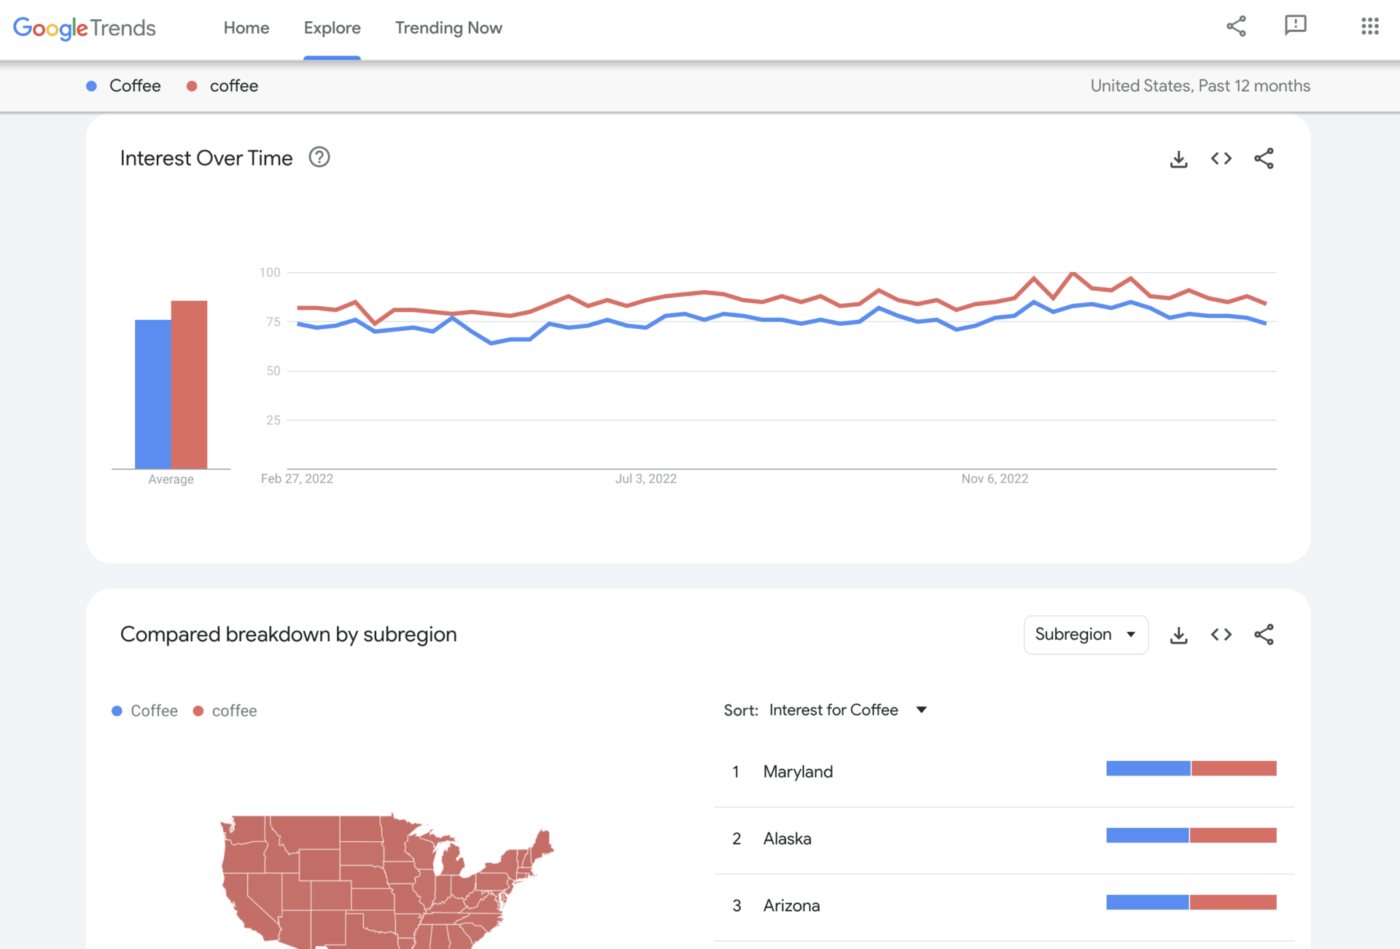
Google Trends provides a simple way to monitor what people are searching for in real time, whether it is a company’s name, a new product, or a sector that suddenly dominates the news.
If search interest in a stock spikes, that is often a sign of growing attention that could spill into price action. Investors treat it as an early signal of where conversations are headed, especially when they cross-check search interest with other market indicators and sentiment data.
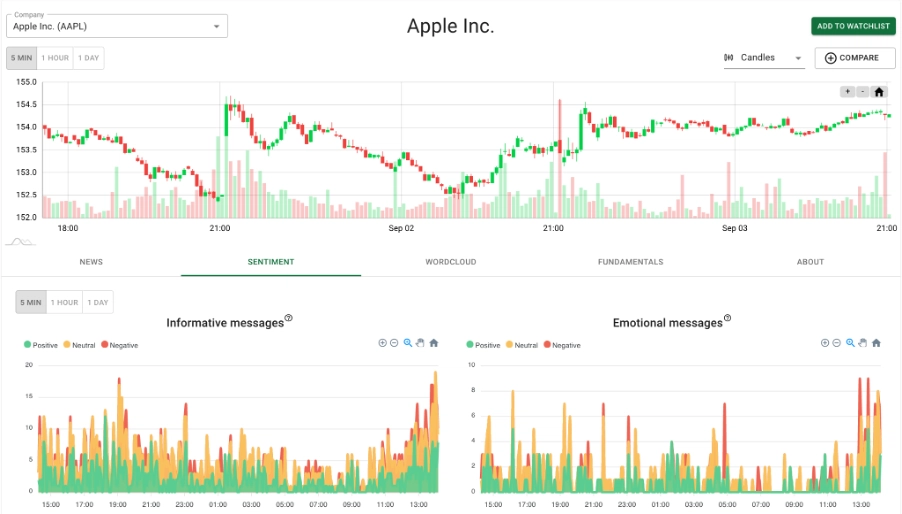
StockGeist listens to online conversations and tracks sentiment for thousands of publicly traded companies. Instead of manually scrolling through endless posts and articles, you see aggregated sentiment scores and charts that reveal how the mood is shifting.
Traders and analysts often use StockGeist as one of their sentiment analysis tools to catch changes in market sentiment around a stock before they become obvious in the numbers.
📖 Also Read: How to Conduct User Research
Pull sentiment insights directly into your daily workflows with ClickUp.
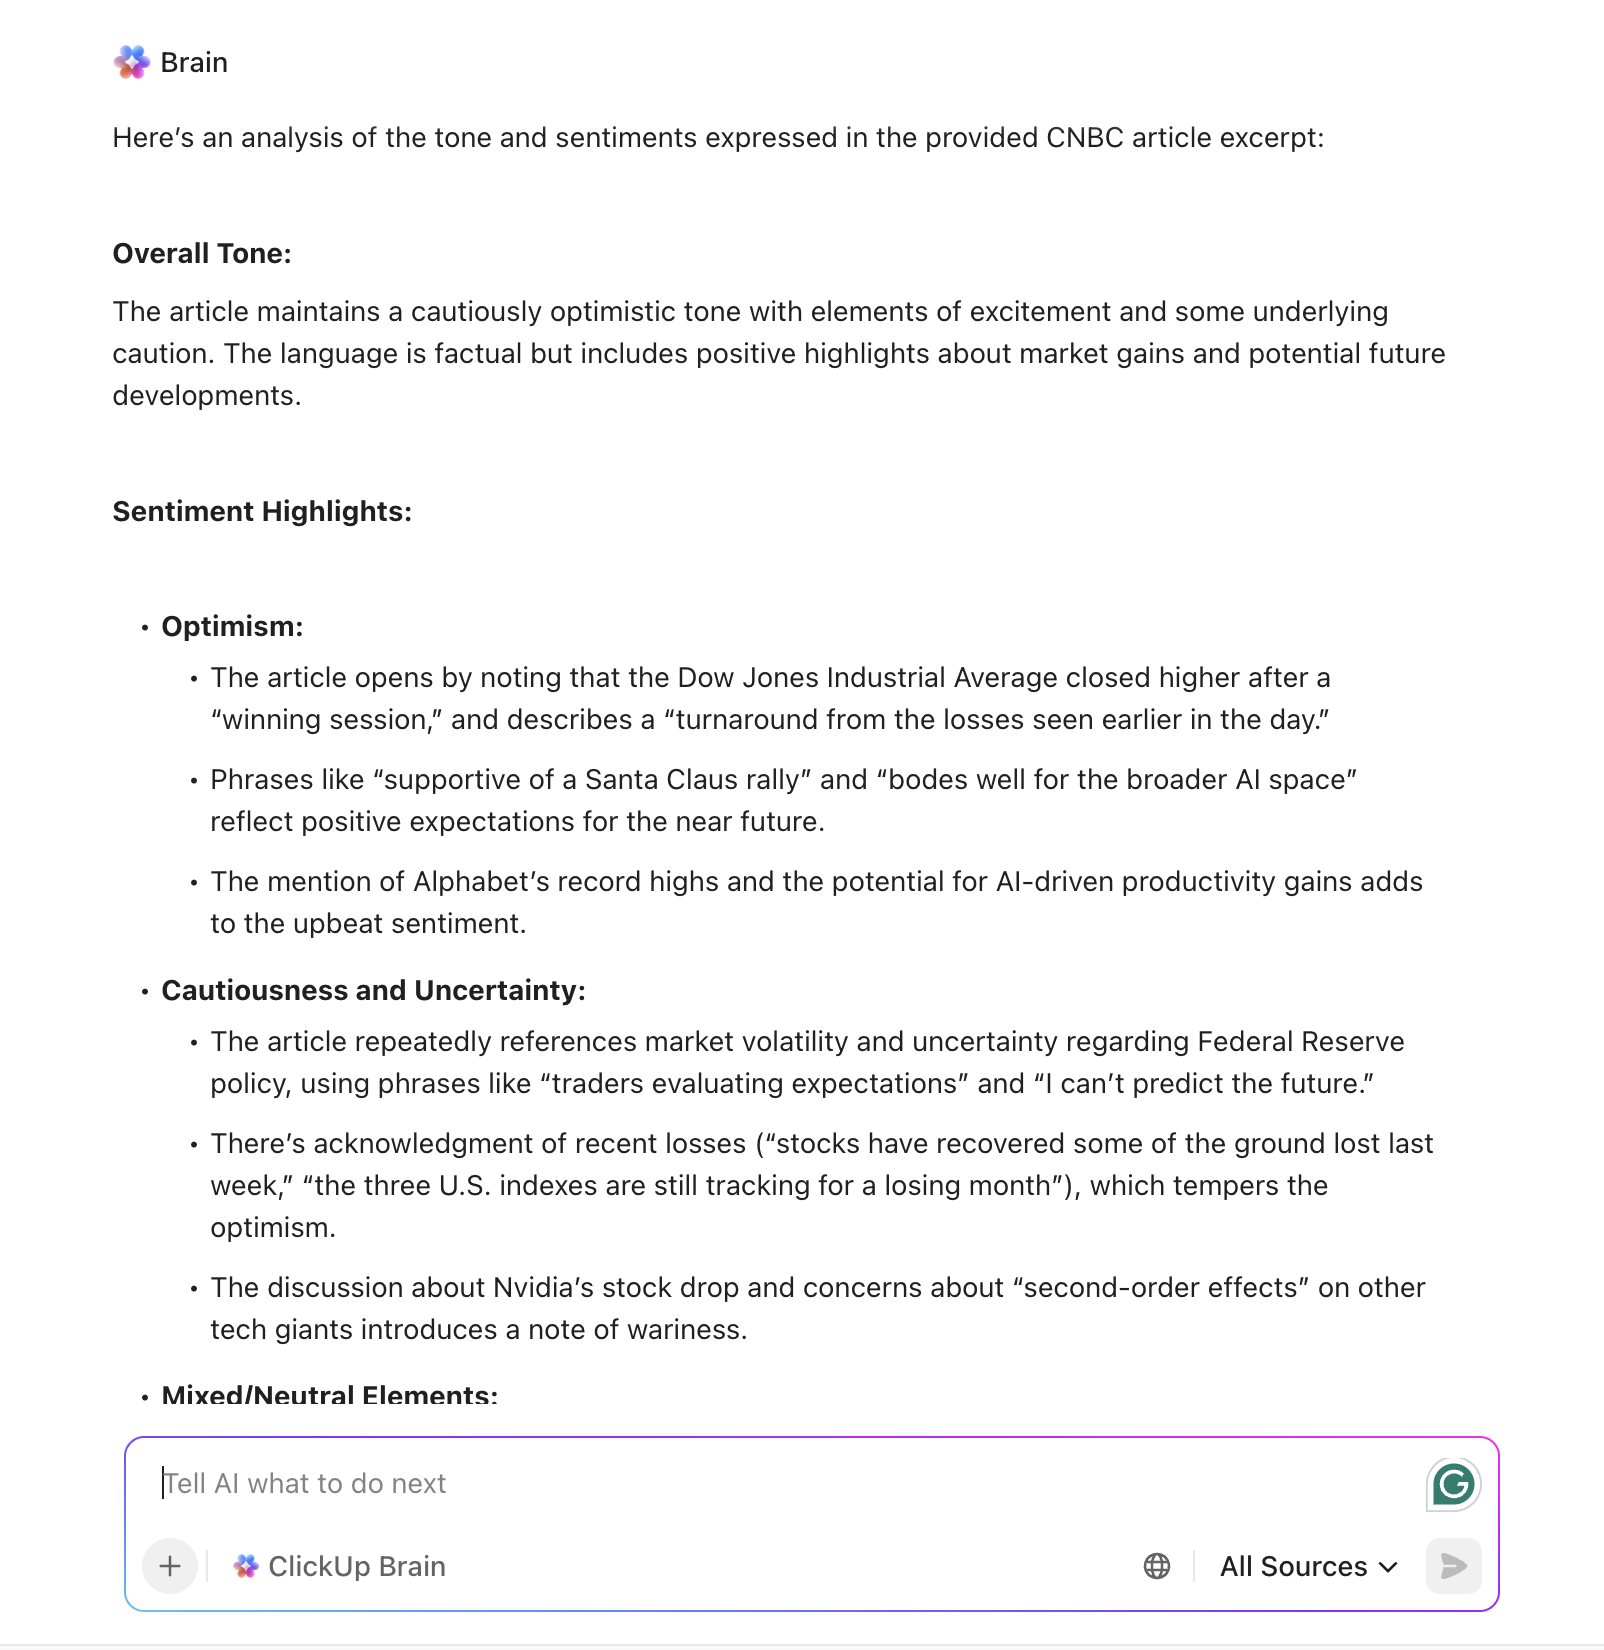
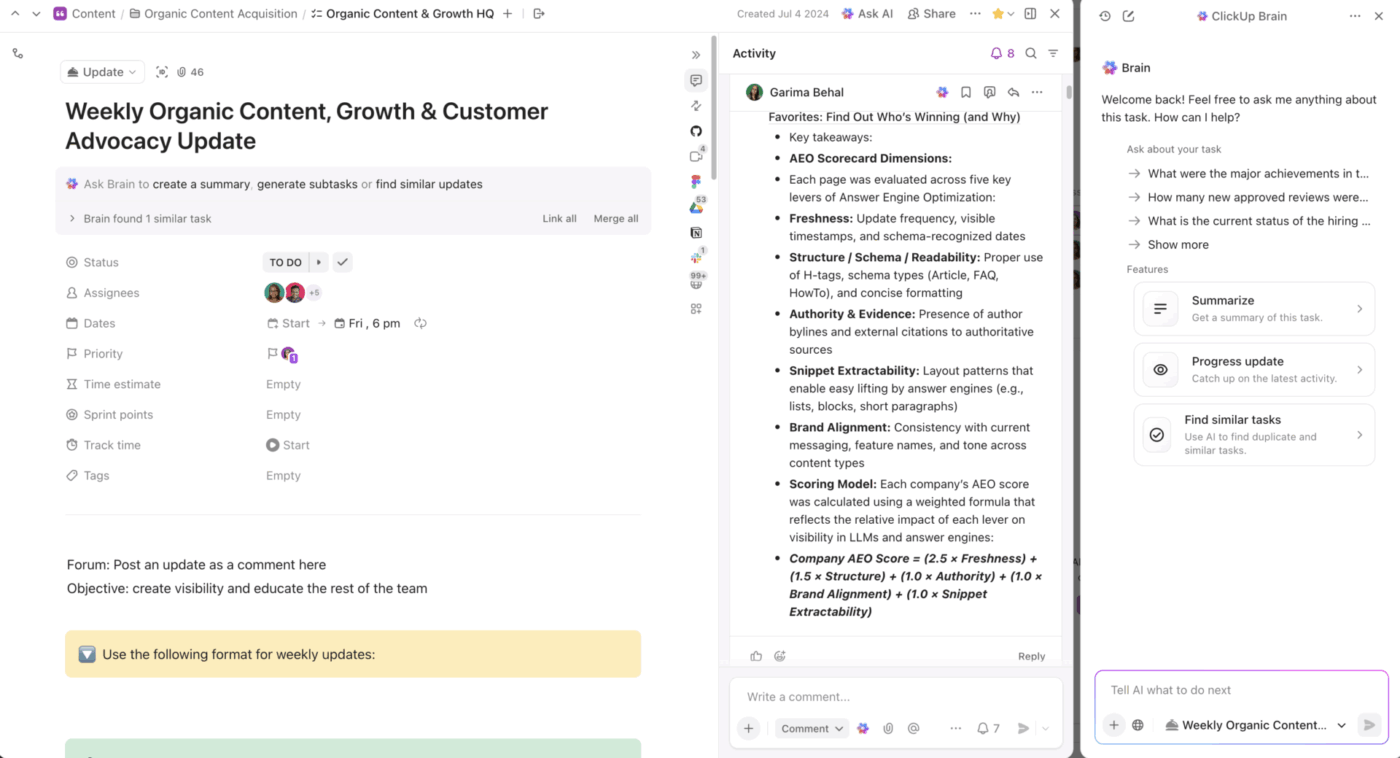
You can search the web and collect articles, transcripts, screenshots, and notes in one place, then use ClickUp Brain to summarize the mood, highlight recurring worries, or compare how sentiment has shifted since the last earnings call.
For an investor or analyst, that means you can bring stock sentiment into your everyday workflow without switching tools.
You might keep a List called “Nvidia Sentiment,” where each task represents a key event. ClickUp Brain reads the attached textual data and provides a concise statement, such as “largely cautious with growing concern about competition,” so you don’t have to read every line yourself.
From there, you can feed those insights into ClickUp Dashboards, link them to stock price charts, and keep a running narrative your whole team can trust.
Here is a video guide that shows how easy it is to ask questions and get instant answers with ClickUp:
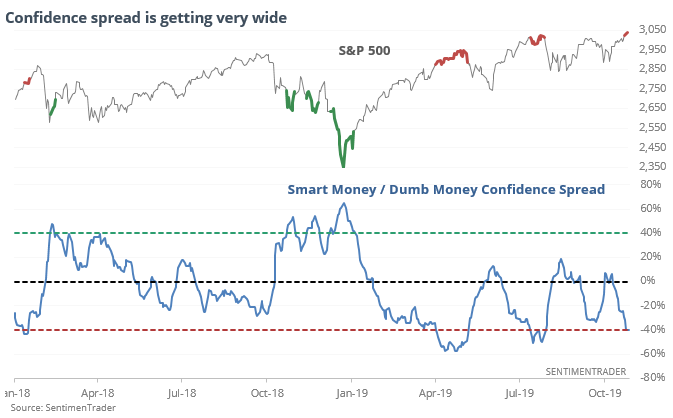
SentimenTrader is a research and tools platform focused on investor sentiment across stocks, bonds, and commodities. It collects and tests sentiment indicators across different asset classes, comparing them with past market cycles to see how the mood lined up with turning points.
SentimenTrader’s backtest engine lets you combine more than 16,000 proprietary indicators and nearly 100 technical indicators without coding, then evaluate how those signals would have performed historically.
📖 Also Read: How to Conduct a Competitor Analysis (+Template)
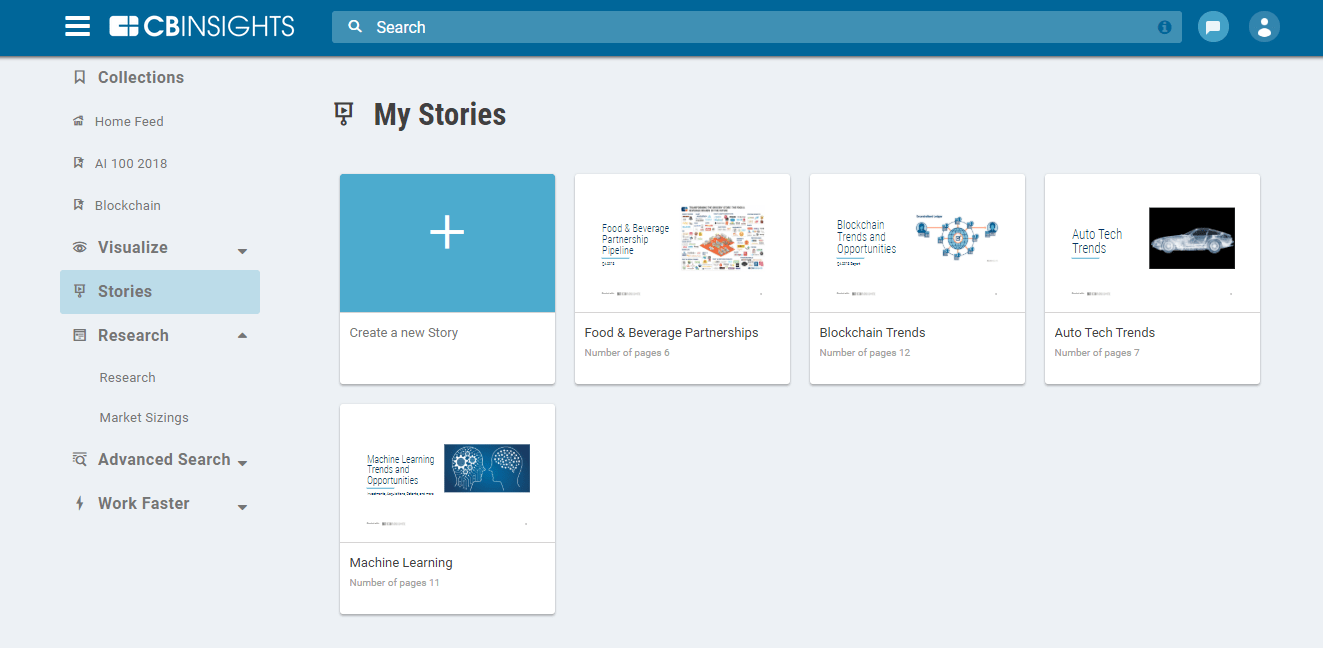
CB Insights is a technology market intelligence platform that analyzes data on startups, venture capital, patents, partnerships, and tech news to help companies make high-stakes strategic decisions.
Tracking mentions of companies, monitoring where investors are allocating their funds, and analyzing broader trends provides insight into where excitement or doubt is building across industries. This can be especially useful if you want to spot the next investment opportunities before they go mainstream.
📖 Also Read: How to Use Trendspotting (with Examples)
It is tempting to think that if we just listen closely enough to the market’s feelings, we will always know which way things are going.
In reality, sentiment analysis is a useful lens, but not a crystal ball that can accurately predict the future. It has its own blind spots, and understanding those limitations is part of smart risk management.
Here is what to keep in mind:
One of the biggest challenges with stock sentiment analysis is not the model itself but the workaround for it.
Sentiment data lives in one tool, price charts in another, earnings notes in a third, and team debates in chat apps. Over time, this Work Sprawl makes it harder to see how market psychology, news, and numbers fit together.
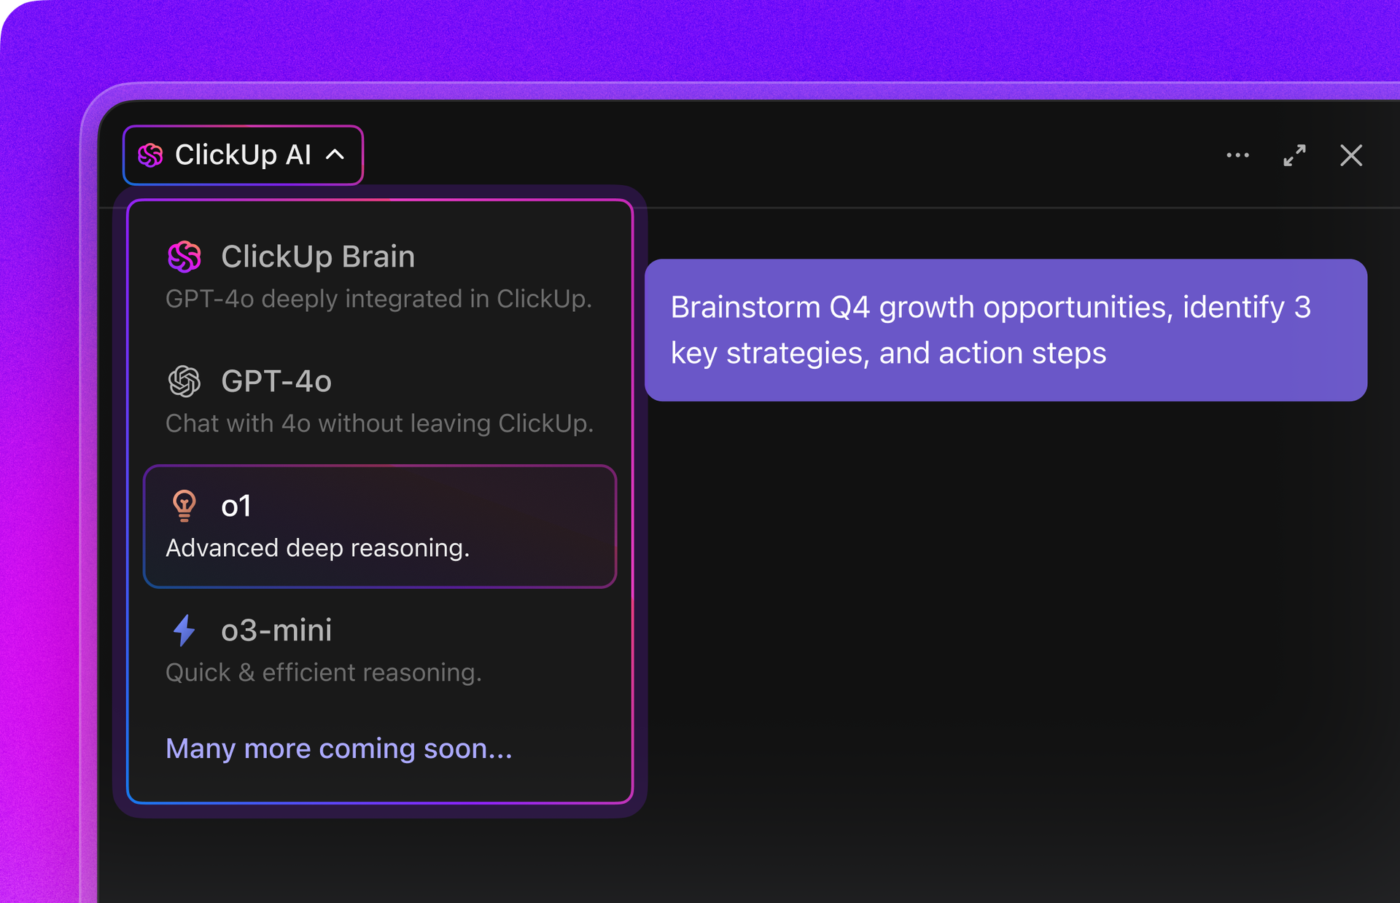
ClickUp pulls those moving parts into a single Converged AI Workspace. You can track stocks, sentiment scores, and research tasks together, while ClickUp Brain and ClickUp Brain MAX help you move from raw text to usable insights without leaving your workflow.
Here is how a typical stock sentiment analysis project might run in ClickUp:
Start by creating a “Sentiment & Price” Dashboard for your watchlist using ClickUp Dashboards. Add widgets that pull in:
As sentiment data flows into ClickUp, your Dashboard becomes a live command center. You can compare sentiment data with market data, spot unusual price fluctuations, and quickly see which tickers need attention.
💡 Pro Tip: Add a simple “Watchlist” Dashboard for just a few stocks at first. As you get comfortable, expand to sector-level or portfolio-level views that combine stock sentiment, tasks, and outcomes.
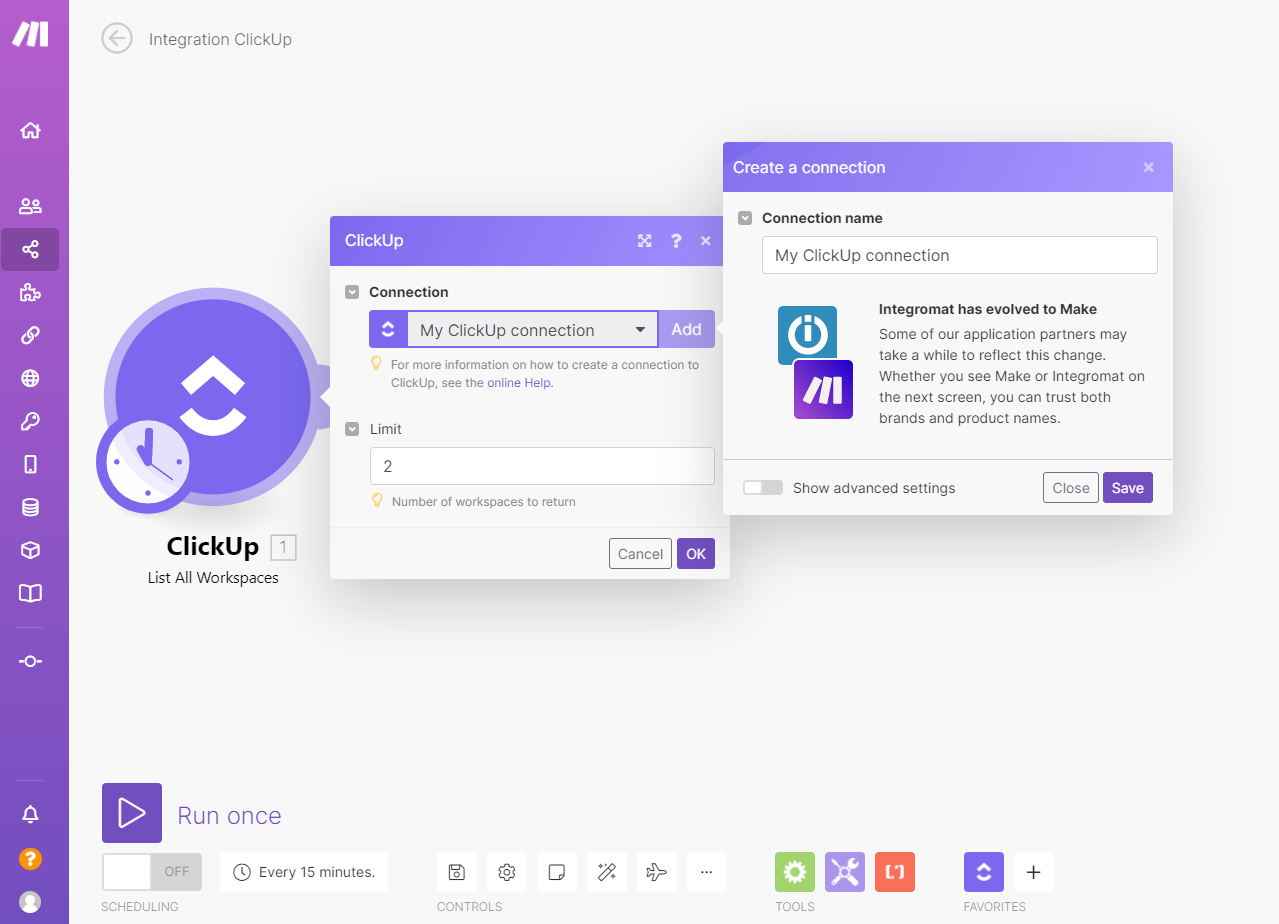
Many teams already pull data from sentiment analysis tools, social media platforms, or custom scripts. Instead of leaving that data in separate consoles, you can use ClickUp Integrations or APIs (often via tools like Zapier or Make) to pipe key numbers into ClickUp Tasks.
For example, you could:
Now your sentiment data for publicly traded companies lives in the same space as your notes, annotations, and trading strategy tasks.
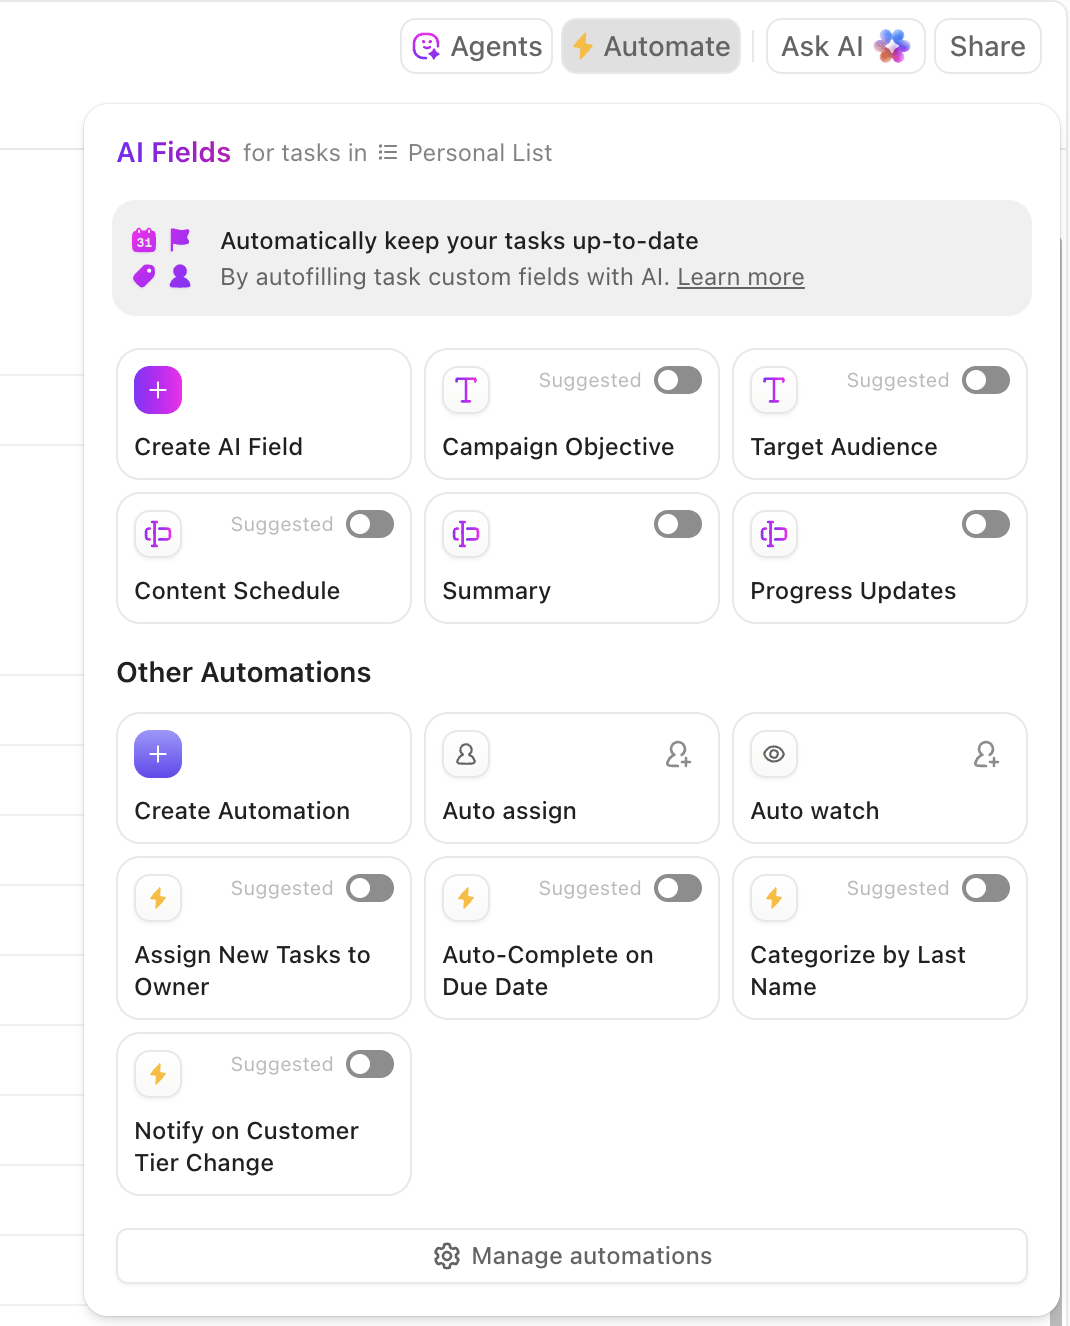
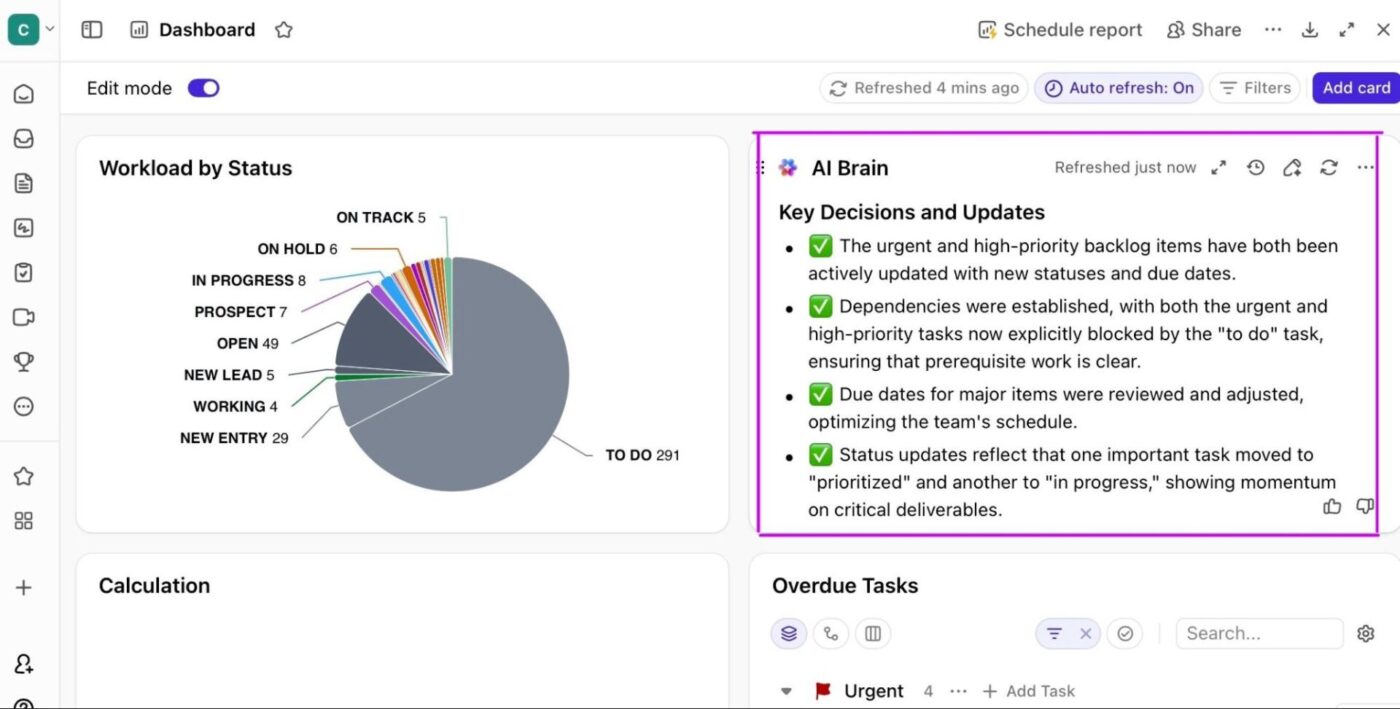
Once sentiment data is inside your workspace, ClickUp Automations and ClickUp AI Agents help you react to shifts without watching screens all day.
You might set up Automations like:
Agents in ClickUp take this a step further by actively monitoring your workspace and executing complex workflows automatically. With Agents, you can set up intelligent processes that not only respond to sentiment changes but also generate and send real-time summaries or reports to your team via chat, email, or task comments.
For example, an Agent can compile daily sentiment analysis across multiple stocks and deliver a concise report to decision-makers each morning.
They can also take direct action—such as updating task statuses, escalating issues, or triggering follow-up tasks—based on predefined rules or detected trends. This means your team receives timely insights and recommendations, critical actions are handled automatically, and your response to market shifts is always fast and informed.
Every stock you follow can live as a ClickUp Task with its own history. Add Custom Fields like current sentiment score, last update time, confidence level, and next review date. Attach screenshots of charts, transcripts of earnings reports, and links to longer research pieces.
You can then use ClickUp Docs attached to those tasks to write “Weekly Sentiment Notes” or “Event Reaction” write-ups. Traders and analysts can comment inline, suggest changes, or flag questions.
Looking to share your insights with your team or partners and plan next steps? ClickUp Chat helps you achieve that.
For example, someone might drop a link and say, “Public perception on this policy shift looks worse than last quarter. Does our model reflect that?” You can convert that comment into a task, so follow-ups do not depend on memory.
💡 Pro Tip: Convert any Chat or Doc comment like “We should check this tomorrow” into a task in a couple of clicks. For busy financial analysts and traders, this is a simple way to turn observations into trackable investment decisions.
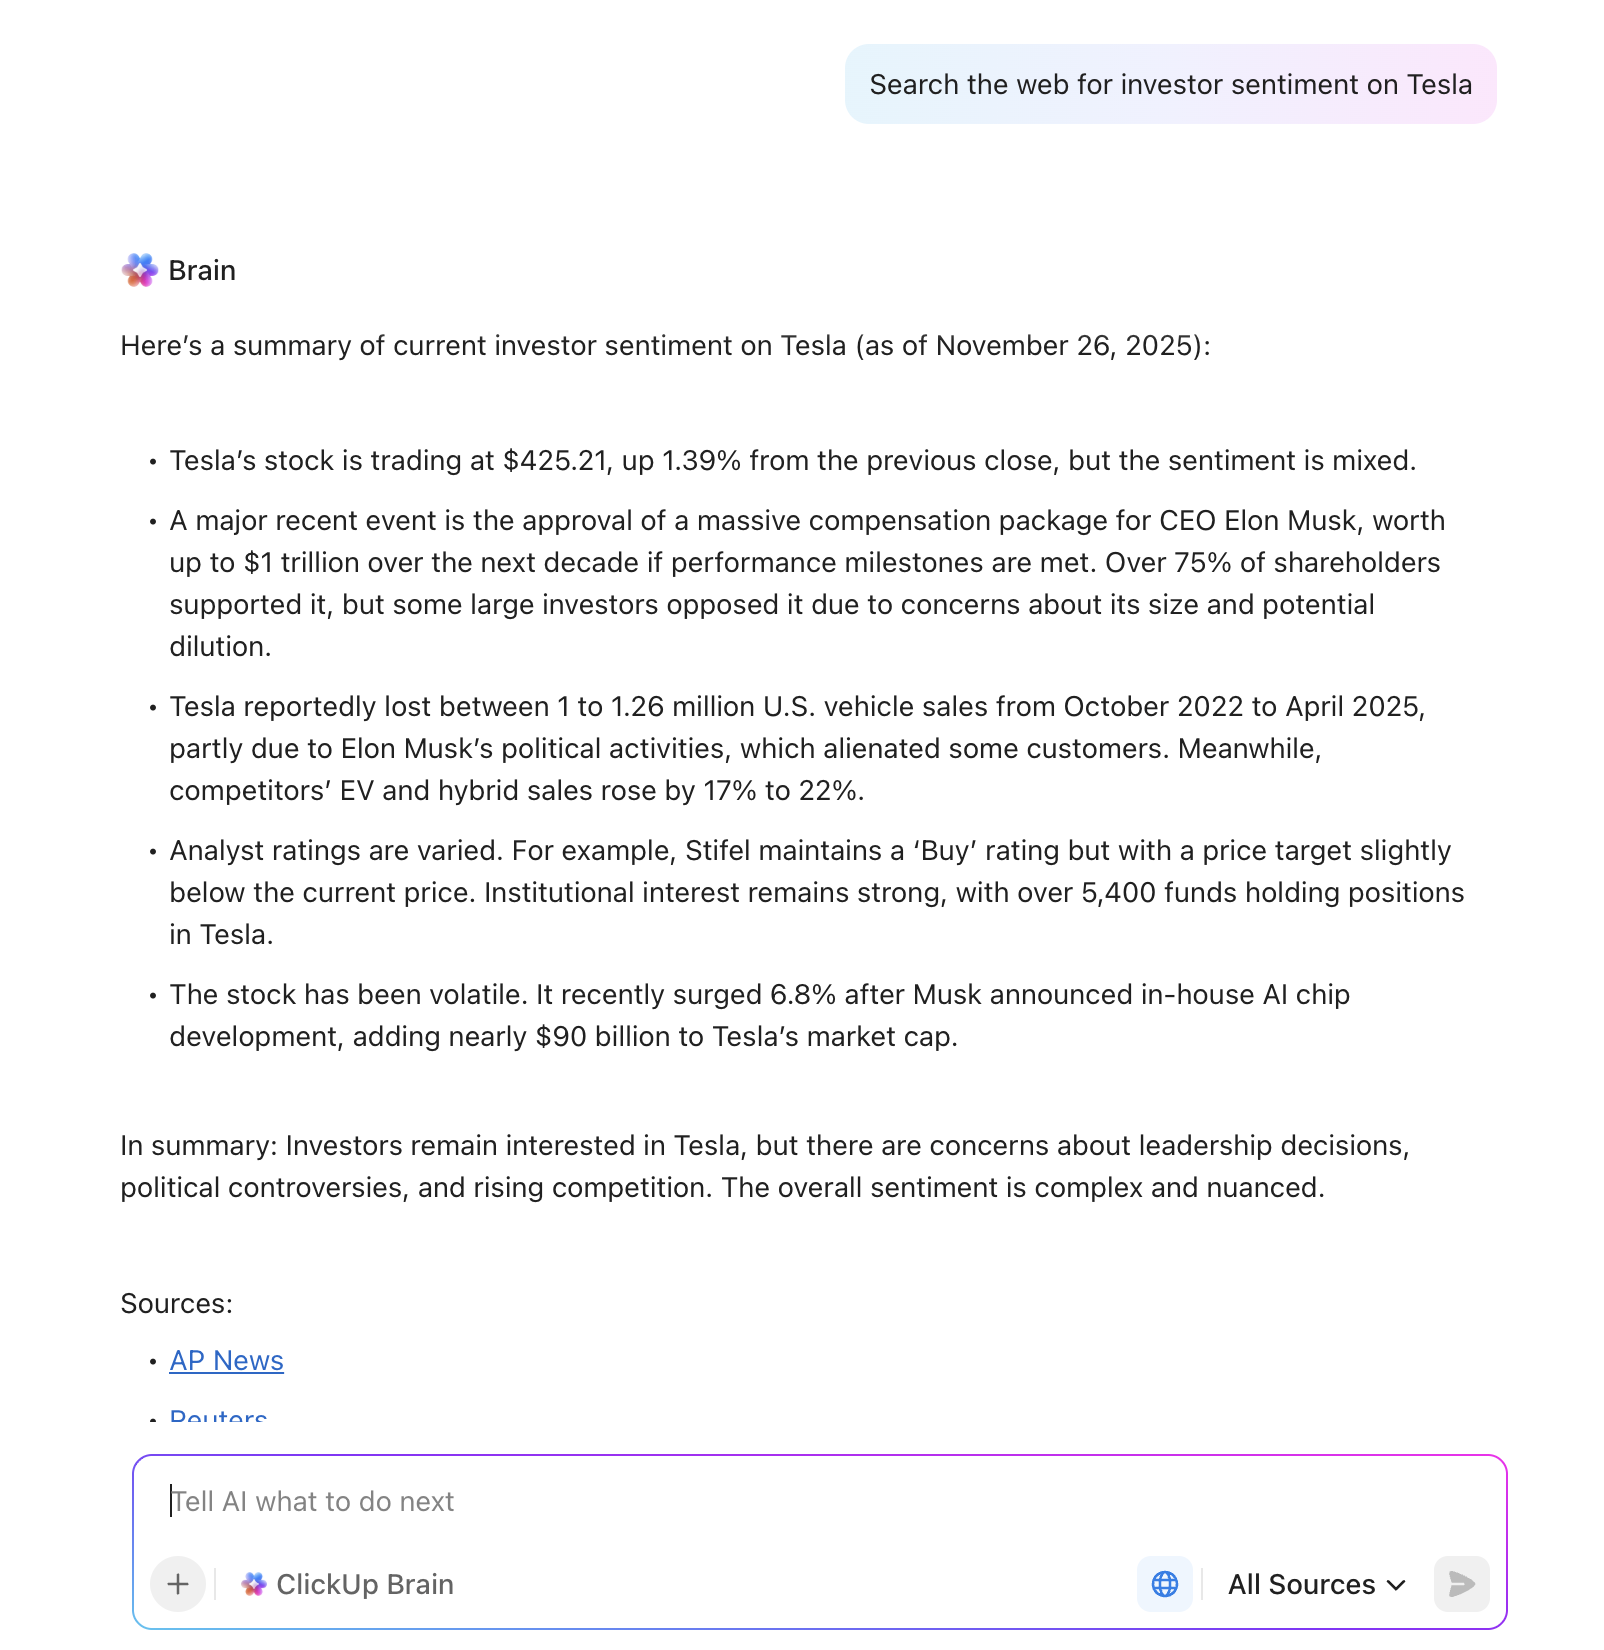
Stock sentiment analysis relies heavily on textual data: news articles, social media posts, earnings notes, and research commentary. ClickUp Brain lets you paste that textual data into a task or Doc and ask questions like:
Instead of scanning long paragraphs, you get a concise summary of investor sentiment and how the mood has shifted. This offers helpful observations without losing the full context.
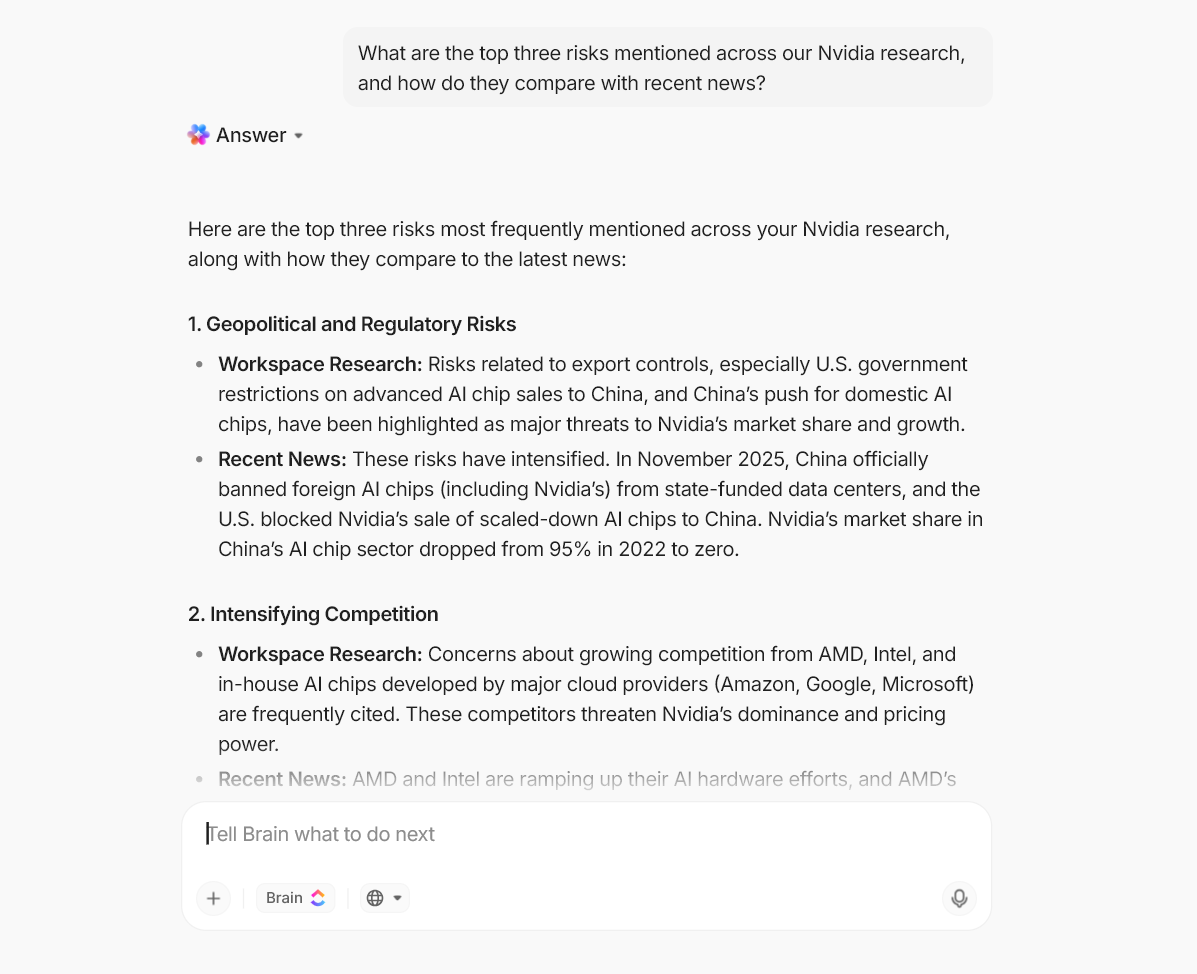
ClickUp Brain MAX expands on this by connecting to your other apps and knowledge sources. You might ask, “What are the top three risks mentioned across our Nvidia research tasks, and how do they compare with recent news? and get an answer that spans your workspace plus connected data sources.
You can also use Talk to Text in ClickUp Brain MAX to dictate observations during market hours. Later, the AI tool can turn those voice notes into structured checklists, briefs, or tasks.
To keep stock market sentiment analysis projects consistent over time, you can lean on templates built for finance and research teams:
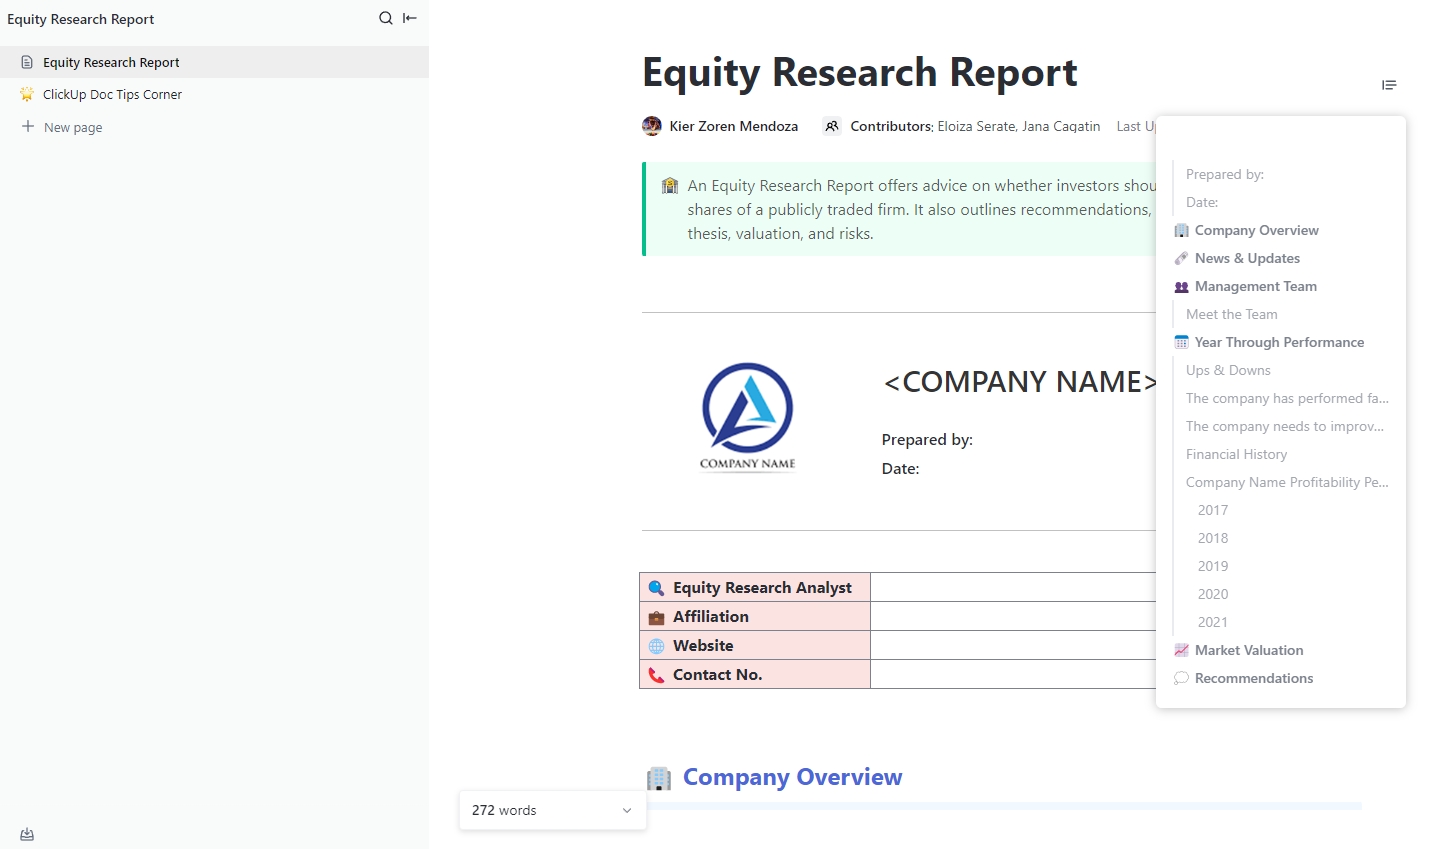
The Equity Research Report Template by ClickUp is designed for analysts and investors who need a structured way to track market developments.
Instead of starting from a blank page, this template provides ready-made sections for financial metrics, earnings reports, and sentiment data pulled from news articles or social media posts. With customizable fields and integrations, you can adapt it to cover any publicly traded company and update it as markets shift.
🌻 Why you’ll love this template
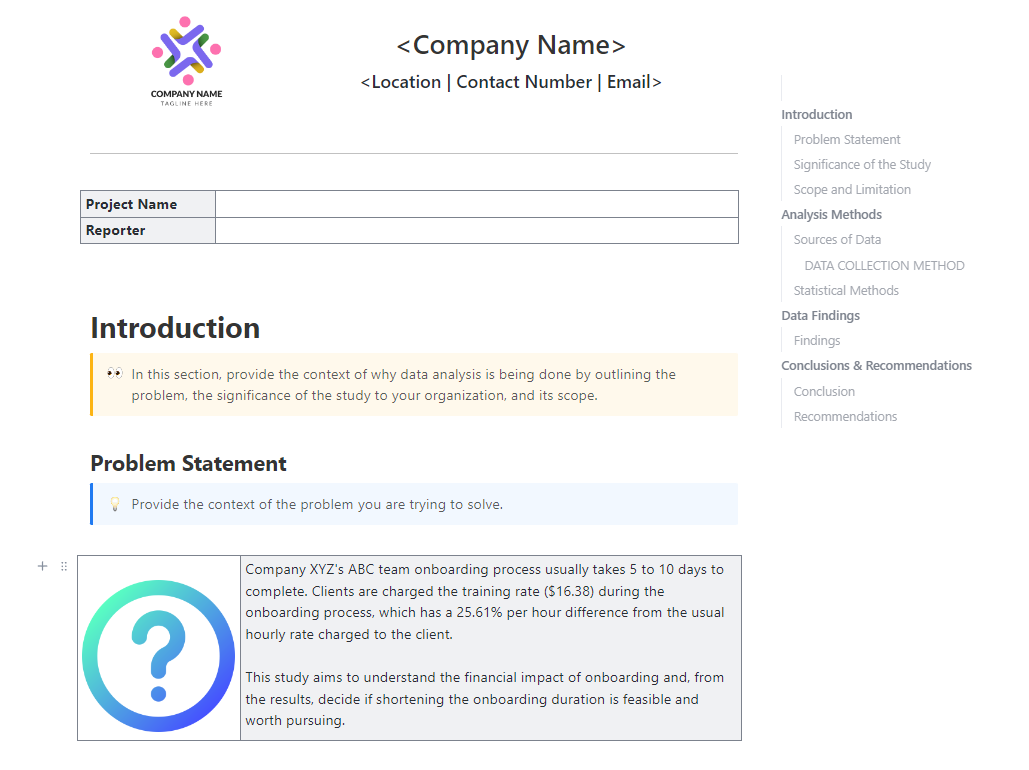
You can also try out the Data Analysis Findings Template by ClickUp if you’re looking to uncover meaningful insights within your data.
This data analysis template centralizes your findings so every piece of information is easy to reference and share. It comes with customizable fields and visualization options that help transform complex datasets into simple, digestible insights.
🌻 Why you’ll love this template
However, if you’re looking for a forward-looking view of risks, projections, and compliance, here’s another template for you.
The ClickUp Financial Analysts Project Status Report Template helps you merge financial performance with project tracking in real time, something the other templates don’t focus on.
📖 Also Read: ROI Templates to Track Returns in Excel & ClickUp
Numbers and emotions have always worked side by side to shape the stock market. What is changing now is how artificial intelligence and machine learning help us read those emotions with greater clarity and speed.
Instead of guessing how investors might react to a headline or policy change, AI can scan millions of news articles, social media posts, and reports in seconds. This helps users receive quick snapshots of current market conditions and sentiment.
Looking ahead, you can expect AI-driven sentiment analysis to:
The stock market is full of signals, stories, and emotions that can feel overwhelming when you try to make sense of them all at once. That is precisely why stock sentiment analysis matters: it turns scattered opinions into structured inputs for your trading strategy and investment decisions.
Throughout this article, you have seen how powerful those insights can be when paired with the right tools. Used thoughtfully, sentiment analysis does not replace fundamentals or charts; it helps you understand how the crowd might respond to both.
Among the many platforms available, what makes ClickUp stand out is how naturally it connects market data, sentiment signals, documentation, and conversations in one place.
You can pull in live feeds, analyze mood shifts with ClickUp Brain, track project health with templates, and discuss the results with your team without leaving your workspace. Sign up for ClickUp for free and build a workspace where market mood and market data finally meet. ✅

© 2026 ClickUp

There’s an easier way. Try a free AI Agent in ClickUp that actually does the work for you—set up in minutes, save hours every week.