How to Create and Use a RASIC Chart for Project Success

Sorry, there were no results found for “”
Sorry, there were no results found for “”
Sorry, there were no results found for “”

The buck stops here.
—The sign on President Harry S. Truman’s desk
In any group undertaking, everyone must know what exactly they—and others—are responsible for. In project management, clarity on roles and responsibilities is essential. Understanding who’s responsible for what can make the difference between project success and complete chaos. President Truman’s famous desk sign reminds us that accountability is non-negotiable.
If you’ve ever been part of a project where tasks were missed or deadlines were blown, you may have asked, ‘Wait, who’s in charge of these tasks?’
A thought it was B’s responsibility, whereas B assumed that C was supposed to do it. 🤔
As teams struggle to demarcate roles and responsibilities, from startups to large corporations, a RASIC Chart can help. Whether you’re a project manager, team leader, or business analyst, this chart can streamline communication and improve project governance.
Let’s see what a RASIC Chart is, how to create one, and how to use it effectively. 🚀
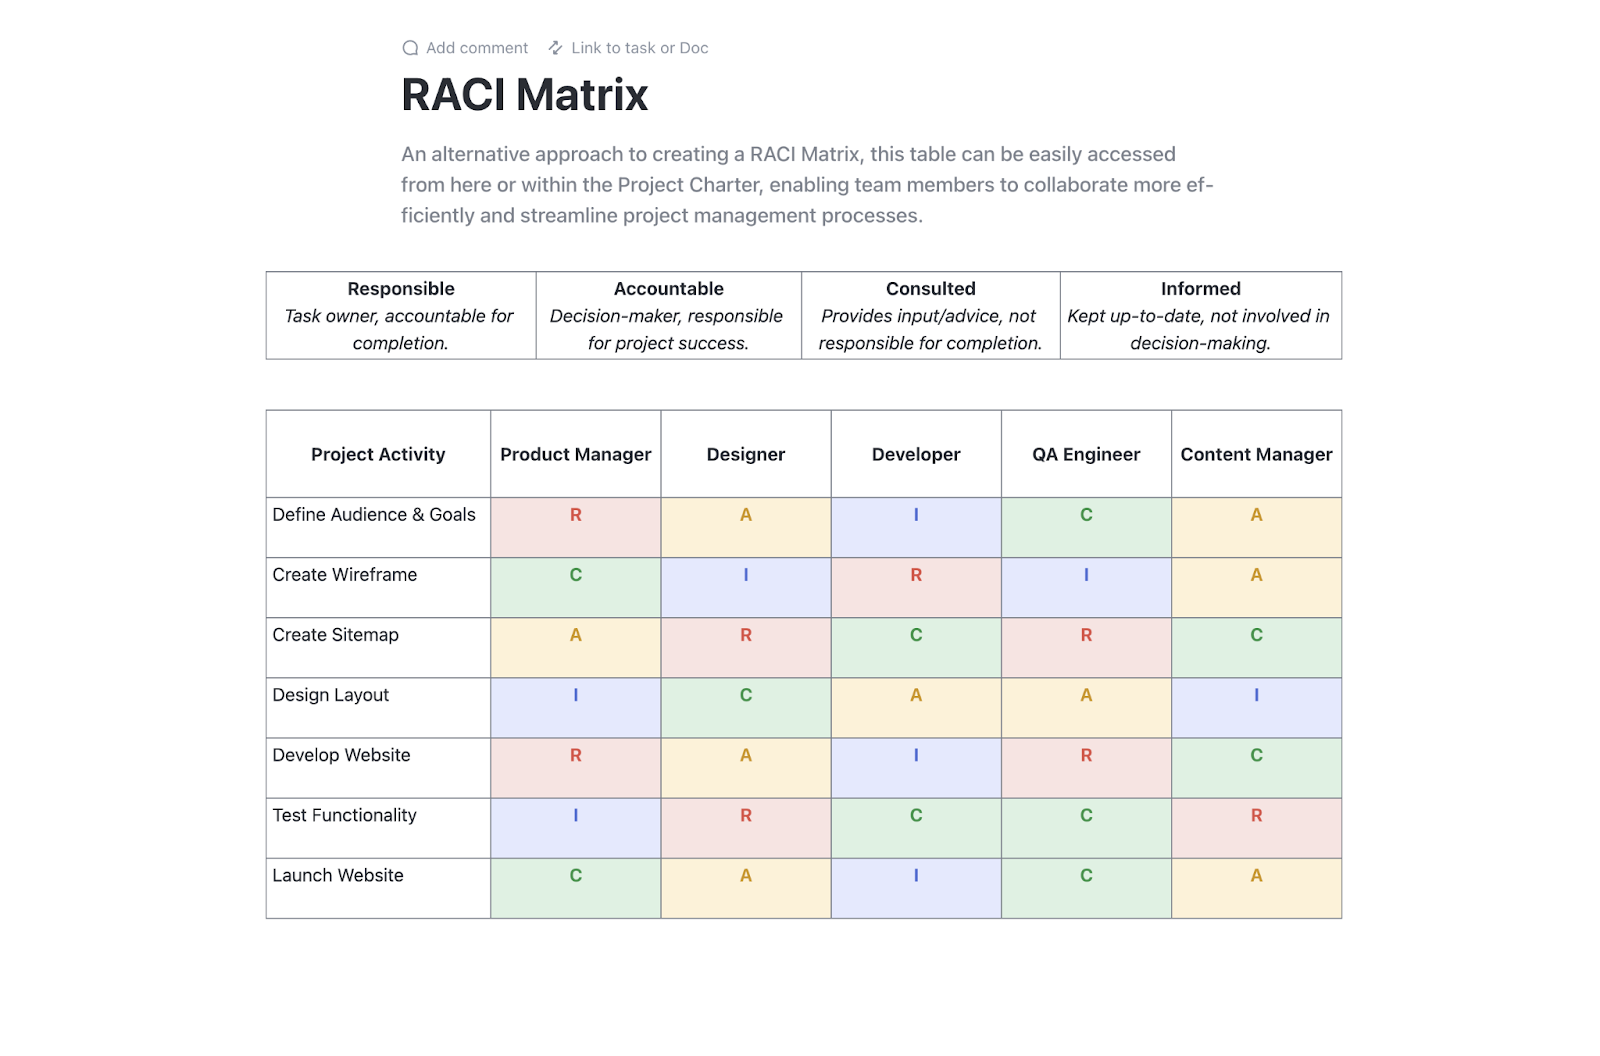
A RASIC Chart is a responsibility assignment matrix that helps project teams clarify and communicate the responsible role of individuals across various tasks. It stands for Responsible, Accountable, Supportive, Informed, and Consulted.
This chart offers a structured way to map out these roles in relation to specific tasks or decisions, ensuring clarity and reducing any overlap or confusion. 🤝
RASIC Charts build on the popular RACI planning, adding a new dimension by including ’Supportive’ to help better manage complex projects. By defining who does what, a RASIC Chart promotes efficiency, accountability, and smooth collaboration—all essential ingredients for success.
To fully understand how a RASIC Chart works for capacity building, let’s break down the key components:
The responsible person (or team) tasked with doing the work is the primary doer of the task and is responsible for getting it done. In many cases, more than one person may be responsible for different parts of the task.
“It always falls on the same people!” is a sentiment shared by 65% of workers when it comes to invisible tasks (like supporting that new hire through their first week of onboarding or pulling a weekender to close critical tasks. 👀). But this uneven distribution can quickly become a breeding ground for resentment, burnout, and reduced productivity. Use ClickUp’s RACI Planning Templates to easily customize and define project roles based on your team’s needs. Try it for free!
📌 For instance, in a product launch, the product manager is most likely the person responsible for coordinating the release.
The person who ensures the task gets completed. They hold ultimate ownership and are answerable for the outcomes. To prevent confusion, only one person is typically accountable for each task.
📌 The head of product may be accountable for the overall success of the launch, ensuring the product meets company standards and deadlines.
Individuals who are actively involved in completing the task. While they don’t directly own the task or decision, their role is to provide support and ensure the task’s success.
📌 A graphic designer supports the marketing team’s campaign with visual assets.
These people need to stay in the loop about task progress and outcomes. They don’t have to take action, but they are updated on the status.
📌 The sales team needs to be informed about the new product launch to prepare their pitch.
The people who provide input or advice before a task is completed. They offer insights or expertise but are not responsible for carrying out the task.
📌 The legal team might be consulted to ensure compliance with regulations.
💡Pro Tip: ‘Responsible’ and ‘Accountable’ may sound similar, but they’re not. Responsibility is about fulfilling assigned tasks; accountability is about owning the results of those tasks. An individual is held accountable for tasks that are the responsibilities of their team members.
These components come together to provide a clear picture of who plays what role in a project, ensuring no gaps or overlaps in responsibility throughout the project’s life cycle.
Before we understand how to create a RASIC Chart, let’s address a common question: What’s the difference between a RASIC Chart and a RACI model? 📝
The RACI chart is widely used in project time management. RASIC takes things a step further by adding the Supportive role. This additional element is particularly useful for larger projects where tasks are complex and may require extra help beyond the doer and decision-maker.
Adding a ‘Supportive’ role can clarify who should be lending a helping hand. This avoids the common pitfall of people duplicating efforts or leaving necessary support tasks undone.
In essence, RASIC gives project teams greater flexibility and clarity when distributing responsibilities.
Now that we know what a RASIC Chart is, let’s explore how to create one. 🛠️.
For this guide, we’ll walk through setting up a RASIC Chart in a project management tool like ClickUp. This tool allows you to organize and track your team’s responsibilities visually.

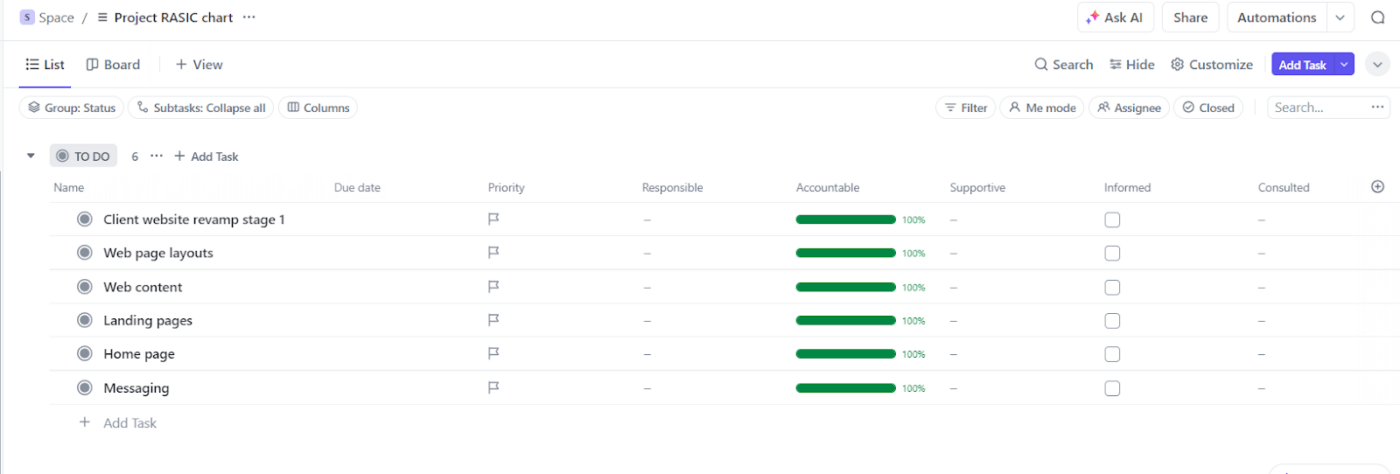
Start by creating a new Space for your project. Then, create a List specifically for your RASIC Chart. For clarity, call it ‘Project RASIC Chart’.

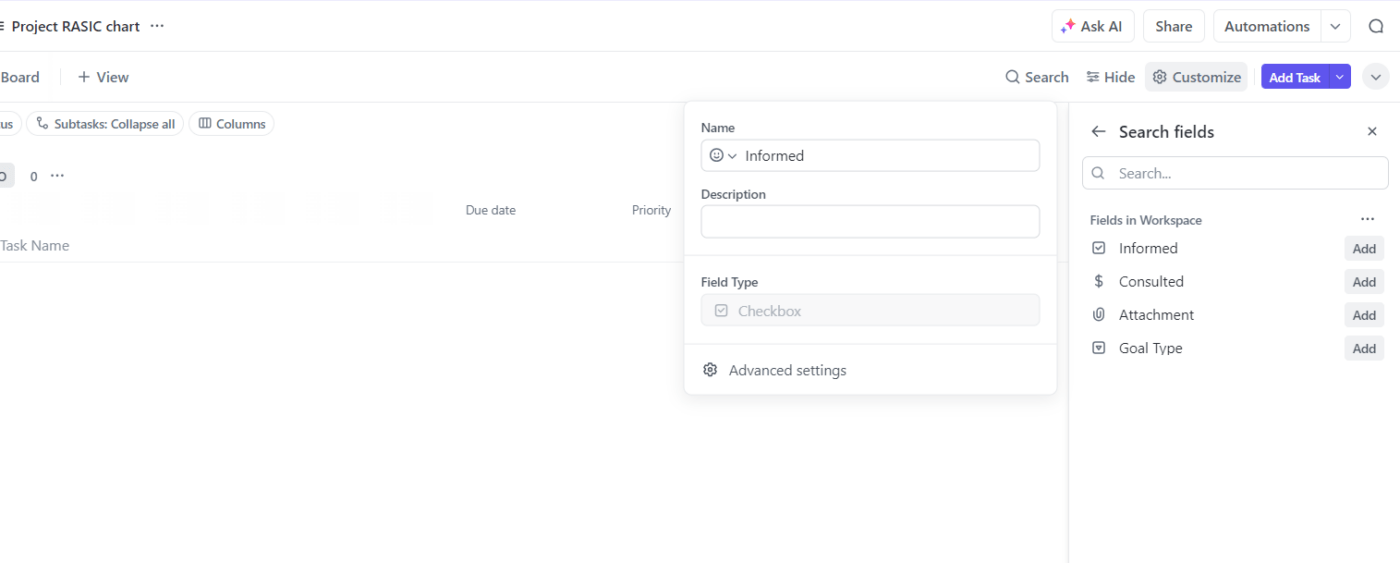
Once your list is created, you’ll need to set up the columns for your RASIC Chart.
Customize the column fields to include:

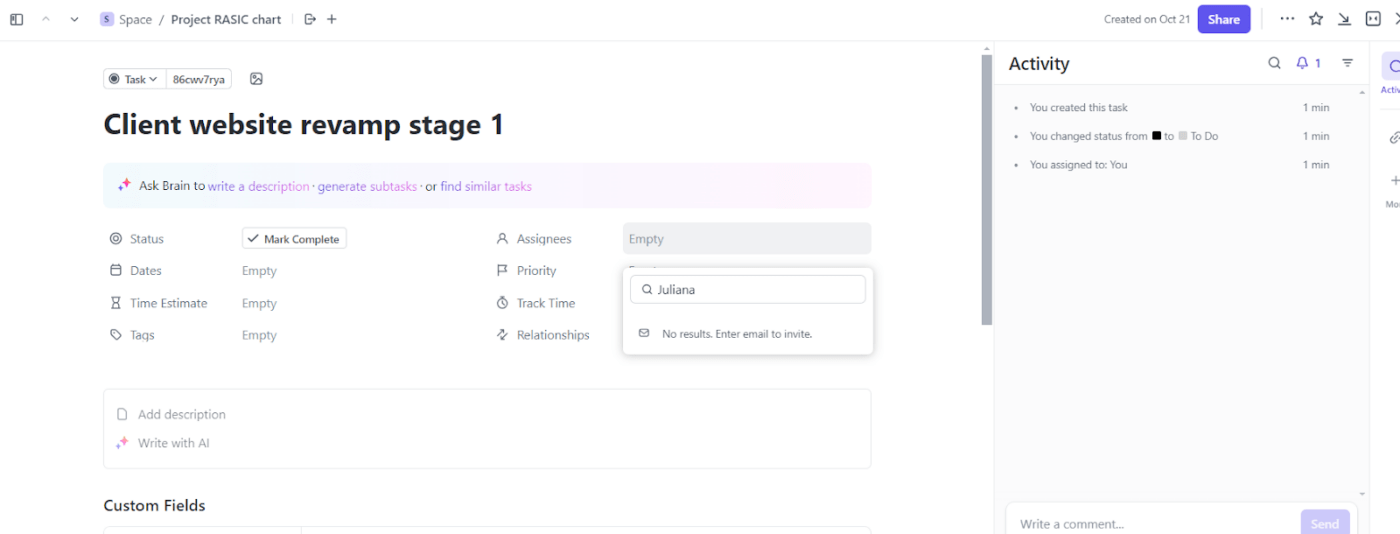
Once your columns are in place, it’s time to define specific roles for each task. Start by identifying the key tasks or decisions within your project. For each task, assign individuals to the Responsible, Accountable, Supportive, Informed, and Consulted columns.
This process ensures that every task has clear ownership and that no steps are overlooked.
📌 Example: If your project is building a new company website, assign ‘Responsible’ to the web developer, ‘Accountable’ to the project manager, ‘Supportive’ to the graphic designer, ‘Consulted’ to the SEO specialist, and ‘Informed’ to the marketing team. This way, everyone knows their role from the start.
📮ClickUp Insight: 70% of managers use detailed project briefs to set expectations, 11% rely on team kickoffs, and 6% tailor their project kickoffs based on tasks and complexity.
That means most kickoffs are documentation-heavy, not context-driven. The plan might be clear, but is it clear to everyone, the way they need to hear it?
ClickUp Brain’s AI features help you tailor communication from the very start. Use it to summarize kickoff docs into role-specific task briefs, generate action plans by function, and surface who needs more detail vs. who needs less.
💫 Real Results: Hawke Media cut project delays by 70% with ClickUp’s advanced project tracking features and automation.

Use the Custom Fields to track additional details, such as deadlines, priority levels, or project stages. Adding these fields helps you monitor each task’s progress, ensuring nothing is forgotten.
Use the ClickUp Gantt Charts to visualize task timelines, dependencies, and ownership.

Additionally, the ClickUp Table View and Board View can help track tasks from different perspectives, ensuring everyone knows their responsibilities and delivery expectations.
Table View also provides:
Tracking progress and making necessary adjustments are crucial for keeping your RASIC Chart effective throughout the project lifecycle.
Monitor task progress: Use the ClickUp Task View to get a detailed update on each task’s status, ensuring that responsibilities are met and deadlines are on track. The platform’s progress bars and completion statuses provide visual indicators to keep everyone informed. In addition, you can add selected folks as ‘watchers‘ on a task in ClickUp, for those who need to be kept ‘Informed’ or ‘Consulted'”
Adjust roles as needed: Projects evolve, and team responsibilities may shift. Regularly review the RASIC Chart and update roles to adapt to changes in project requirements. For example, if a task becomes more complex and requires additional input, update the Consulted or Supportive roles accordingly to maintain clarity and efficiency.
Use automation: Streamline role adjustments by setting up automation that notifies team members when changes are made. This reduces manual communication and ensures that everyone stays aligned.
ClickUp offers several features to foster seamless collaboration and communication among your team members:
Comments and task discussions: Add comments directly to tasks to provide real-time updates, feedback, or clarifications. Tag team members to loop them into discussions, ensuring swift responses and reducing the need for external communication tools.
Mentions and notifications: Use @mentions in comments to notify individuals or groups immediately, directing their attention to crucial updates.
Task attachments and links: Attach files, documents, or relevant links directly to tasks to give team members all the necessary information in one place, minimizing the back-and-forth for resources.
Custom notifications: Set up tailored notifications so that Consulted and Informed roles know when their input is required. Automate alerts to ensure that those in a Supportive role stay engaged at the right stages of the project.
💡Pro Tip: Create a recurring reminder within ClickUp to review your RASIC Chart weekly or bi-weekly, ensuring everyone remains aware of their responsibilities and any potential updates.
Optimizing your RASIC Chart helps maintain clarity and improve workflow throughout the project.
Task dependencies: Define and map out dependencies between tasks to indicate how different roles (such as Consulted or Supporting) need to interact. This proactive approach can prevent bottlenecks and keep the project moving smoothly.
Custom dashboards for KPIs: Design dashboards that display key performance indicators (KPIs) relevant to your RASIC Chart. Include widgets like:
Burnup and burndown charts: Track progress against the project timeline.
Time tracking widgets: Monitor how much time is being allocated to tasks and identify if any adjustments are needed.
Task progress: Visualize which roles are contributing effectively and identify areas for improvement.
Automate workflow reminders: Implement automation that notifies team members of upcoming deadlines or when their input is required. For example, set up alerts for team members in the Informed role to ensure they receive timely updates.
Review and refine: Periodically review the overall structure of your RASIC Chart to identify any inefficiencies. Adjust columns, task views, or Custom Fields to make the chart clearer and more functional.
If you’re looking to save time by using a pre-made RASIC Chart, you can use a variety of free RACI chart templates. For instance, check out the helpful ClickUp RACI Planning Template that can be easily customized to fit your needs.
This RACI chart template helps define project roles and responsibilities, which can also be adapted for RASIC Charts.
It allows you to set up Custom Statuses that represent the different roles in a RASIC Chart: Responsible, Accountable, Supportive, Informed, and Consultted.
This makes assigning and tracking each person’s responsibilities on any task easier.
A RASIC Chart is widely used for project management across industries. Here are some examples:
In construction projects, coordination between multiple stakeholders (architects, engineers, contractors, and government officials) is critical. Let’s say you’re building a commercial complex.
The chart could look like this:
| Responsible for design approvals | Architect |
| Accountable for overall project delivery | Project manager |
| Support in structural engineering matters | Civil engineer |
| Informed about project milestones and approvals | Client |
| Consulted for regulatory compliance | Legal team |
Implementing new technologies in healthcare requires careful coordination to meet regulatory, technical, and patient care standards.
For example, here’s the RASIC chart if you want to implement an Electronic Health Record System:
| Responsible for testing and validating the system | Healthcare providers, software testers |
| Accountable for system integration | IT director |
| Support for technical setup | IT team |
| Informed of new processes and updates | Medical staff |
| Consulted for adherence to medical regulations | Compliance officer |
Software development projects require teams to assign every particular task clearly and unambiguously to guarantee positive project outcomes.
Consider an example project: software development for a banking app. Your RASIC chart could be as follows:
| Responsible for coding and software implementation | Project manager |
| Accountable for project completion | Developers |
| Support with testing | Quality Assurance (QA) |
| Informed about new features and updates | End-users (clients) |
| Consulted for compliance with financial regulations | Compliance officer |
💡Pro Tip: Highlight interactions between roles with Task Dependencies in ClickUp to map out critical handoffs. 🤝
Next, let’s take an example of how to approach RASIC for a marketing project. Say you’re launching a new marketing campaign.
Here’s your RASIC Chart:
| Responsible for designing the campaign assets | Creative team |
| Accountable for the success of the campaign | Marketing director |
| Support for placing ads in the right channels | Media buying team |
| Informed of campaign launch details and performance | Stakeholders |
| Consulted to optimize campaign performance through data | Data analyst |
For teams already familiar with the RACI model, adapting to a RASIC Chart can provide even more depth by including the Supportive role. While the RACI model is an excellent framework for defining roles, RASIC’s added dimension helps teams better navigate complex projects and allocate supporting roles effectively.
Ambiguity can slow teams down, create unnecessary tension, or lead to costly mistakes. The RASIC Chart eliminates these risks by offering a structured, visual approach to roles and responsibilities.
By defining who is Responsible, Accountable, Supportive, Informed, and Consulted, your team can operate more precisely, ensuring that tasks are completed on time and everyone knows their place in the project management process. 📋
It also allows for smoother communication and productivity planning, as each team member knows exactly who to approach for decisions, feedback, or updates.
Using a tool like ClickUp to create and manage your RASIC Charts amplifies these benefits. Its customizable templates, real-time collaboration features, and intuitive visualizations (like Gantt charts) make it easy to adapt RASIC principles to any project, regardless of size or complexity.
By using ClickUp, you ensure that your RASIC Chart evolves with your project, allowing you to adjust roles, monitor progress, and optimize workflows.
Try ClickUp today and work smarter! ✨
© 2026 ClickUp