


Still downloading templates?
There’s an easier way. Try a free AI Agent in ClickUp that actually does the work for you—set up in minutes, save hours every week.
Sorry, there were no results found for “”
Sorry, there were no results found for “”
Sorry, there were no results found for “”
Over 80% of developers are using or planning to use AI coding tools.
Then why do teams still feel like they’re not getting the full benefit?
It’s simply because while the tools may be efficient, the workflows around them aren’t always so.
Debugging is a perfect example. One minute you’re chasing a cryptic error message, the next you’ve got 12 tabs open, you’re bouncing between logs and configs, and you’re trying to remember what changed since the last deploy. Throw in Slack interruptions and “can you take a quick look?” drive-bys, and suddenly a small bug becomes a half-day event.
And even when Claude helps you find the root cause fast, that discovery can still disappear into the void if it doesn’t turn into a clear task with an owner and a priority.
This guide shows you how to use Claude for debugging code and turn those discoveries into trackable tasks. The goal? Help your team prioritize fixes, assign ownership, and prevent the same issues from resurfacing sprint after sprint.
Let’s get started!
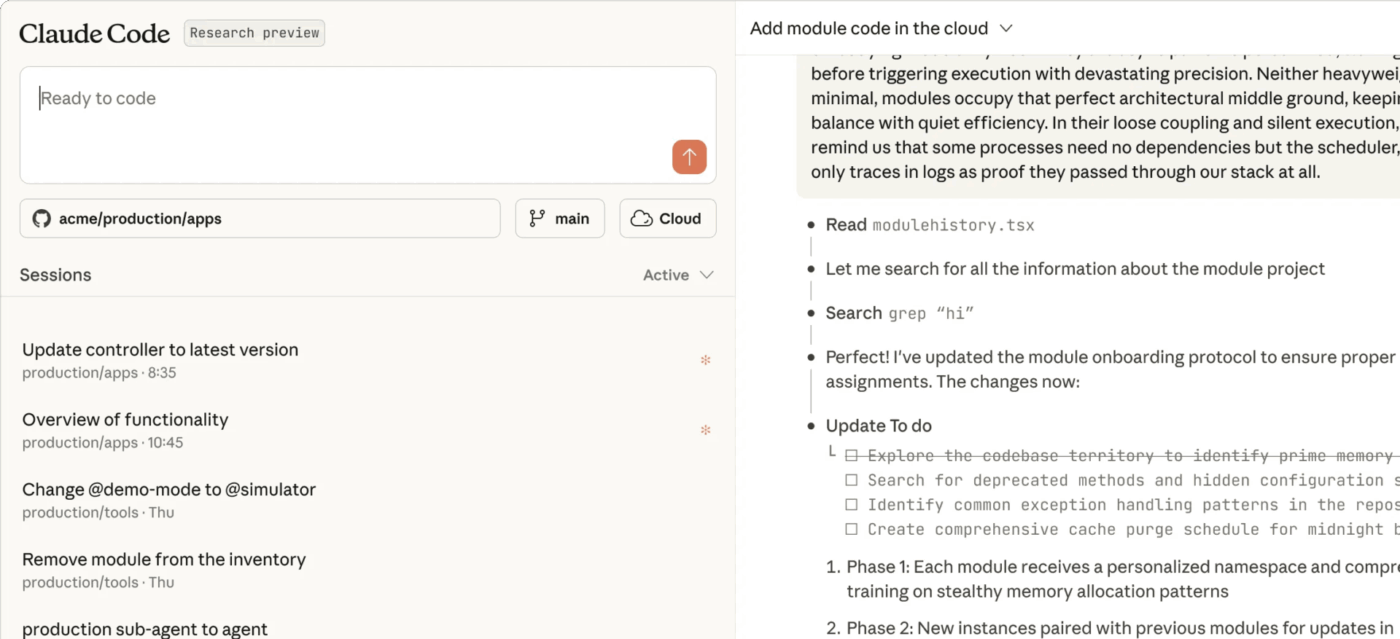
Claude Code is Anthropic’s agentic coding tool that lives in your terminal and understands your entire codebase. Think of it as an AI pair programmer with a photographic memory for your repository. It’s built to handle the heavy cognitive load of debugging by indexing your project’s structure, allowing you to ask plain English questions and get answers grounded in your actual code.
Unlike chat-based AI tools that work with isolated snippets, Claude Code operates directly within your development environment. It can read and write files, execute terminal commands, and trace logic across your entire project.
Getting Claude Code running is straightforward and takes just a few minutes. Here’s how to get started:
npm install -g @anthropic-ai/claude-code in your terminal. This is the official Claude Code CLI package. Alternatively, you can find and install the official VS Code extension directly from the marketplaceHow to set your API key as an environment variable (best practice)
export ANTHROPIC_API_KEY="your_key_here"
To persist it, add that line to your ~/.zshrc or ~/.bashrc, then restart your terminal.
setx ANTHROPIC_API_KEY "your_key_here"
Re-open your terminal after running this.
Once the setup is complete, you’ll need to initialize Claude Code in your project.
Open your terminal, navigate to your project’s root directory, and run the command claude. The tool will automatically start analyzing your repo/scanning your project structure, which means it’s building a map of your files and their relationships to understand the context.
For larger repositories, this initial indexing might take a moment, but it’s what enables the context-aware debugging that sets Claude Code apart.
💡 Pro Tip: Don’t let setup become the work. Create one shared Claude Code Setup Checklist in ClickUp Docs with the exact commands your team needs: the install step, where to generate the Anthropic API key, how to set the env var, and how to verify it works.
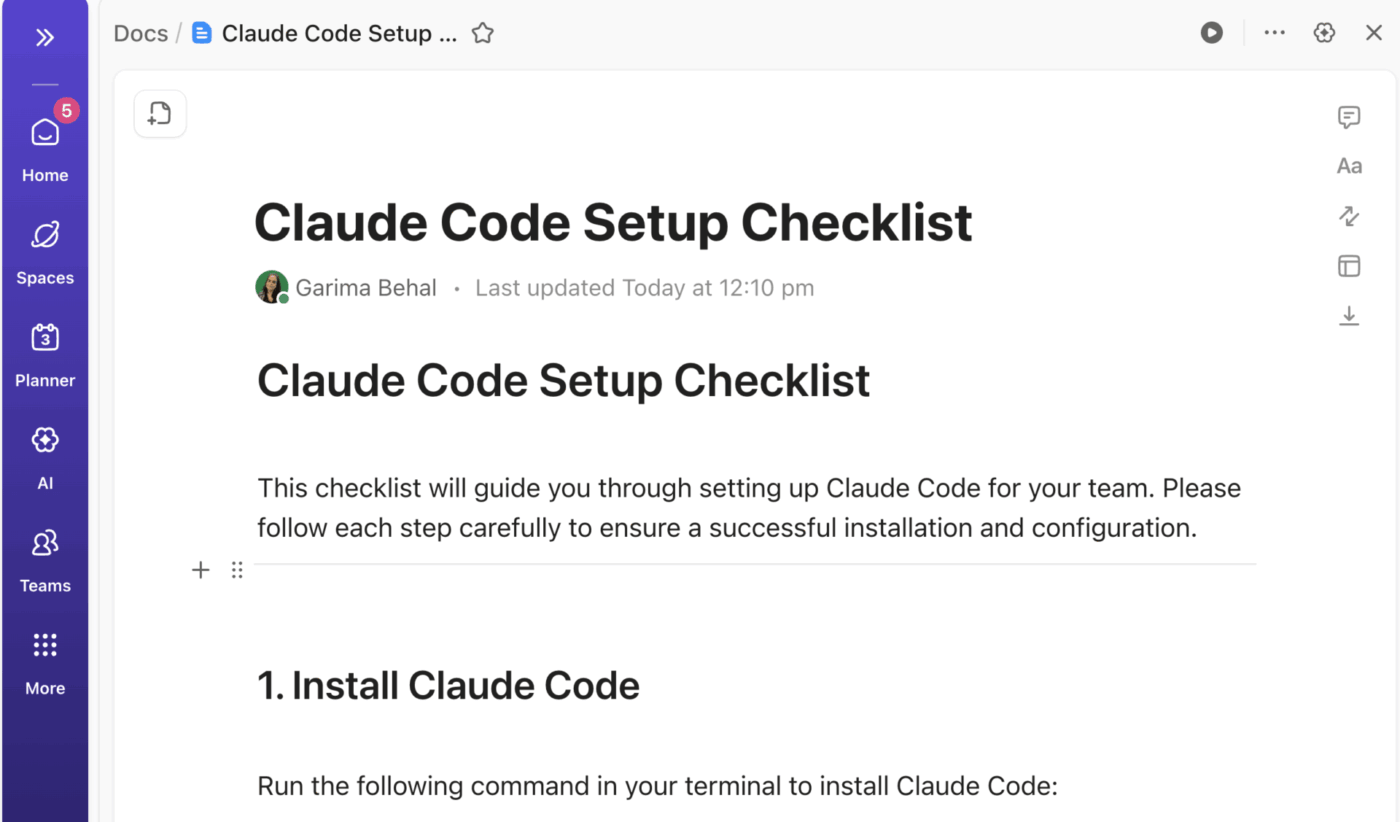
Pin it in your dev Space so new joiners can get running in minutes, not hours!
Even with a powerful AI assistant, debugging can get messy fast if you don’t have a simple process to follow. If you start with something vague like “why is my code broken?”, you’ll usually get vague answers back—and that’s when people decide the tool “doesn’t work” and go right back to the old (slow) way of doing things.
The better approach is to treat Claude Code like a senior engineer you’re pairing with: give it clear context, let it investigate, challenge its assumptions, and verify every fix before you ship it. This structured collaboration turns debugging from a guessing game into a science.
Let’s walk you through how to do this, step-by-step:
The quality of Claude Code’s assistance is directly proportional to the quality of your initial bug report. To get the best results, you need to frame the problem with precision.
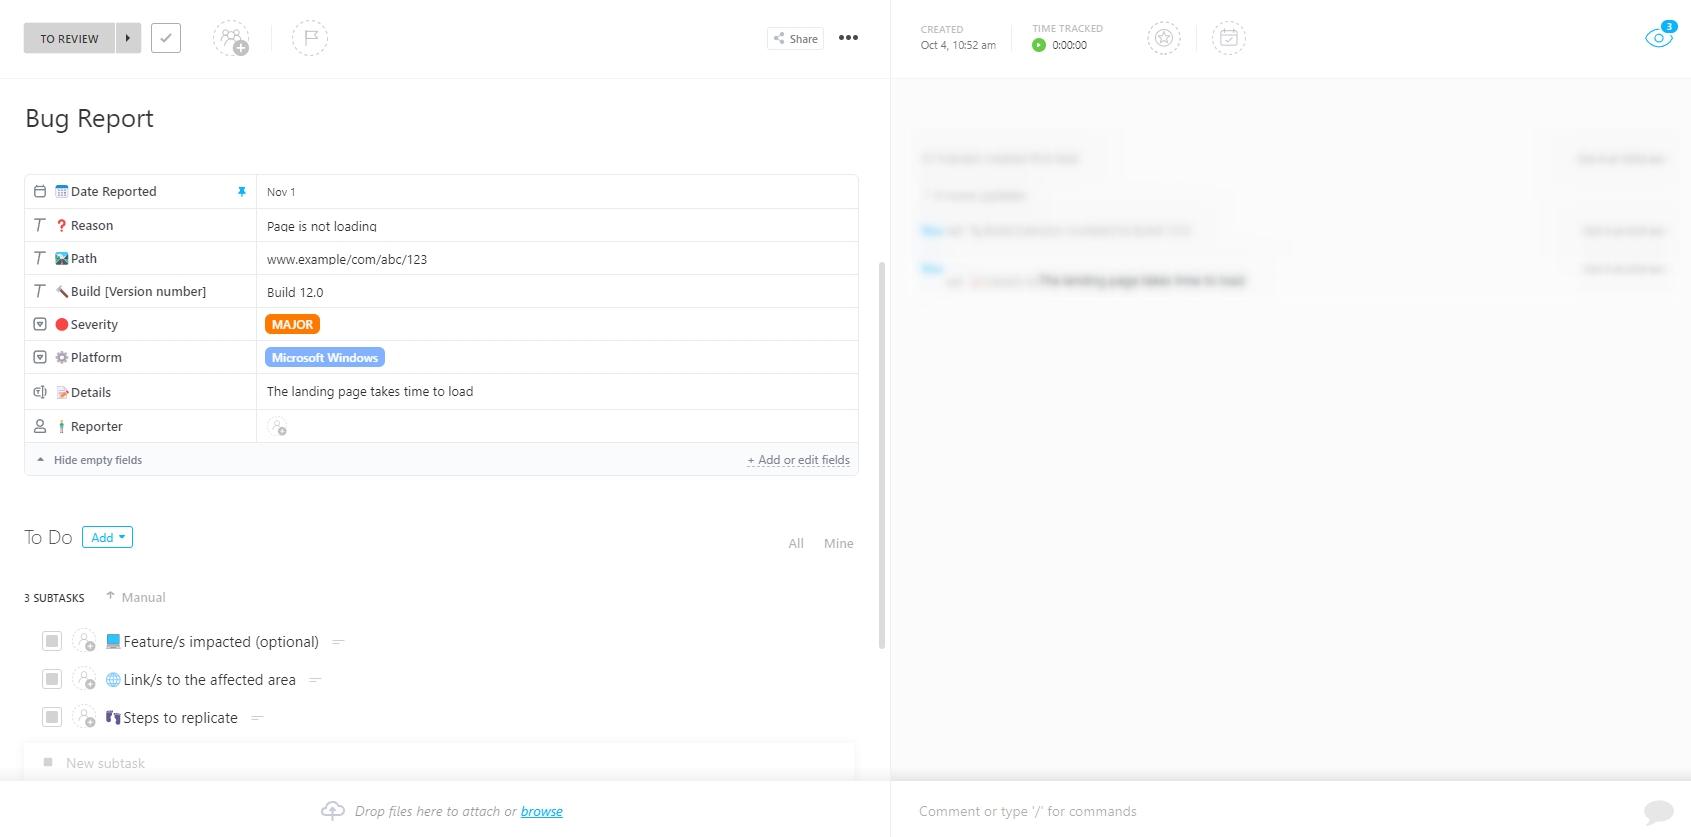
Your bug report should always include these key pieces of information:
📌 For example, a great prompt would look something like this: “The /api/users endpoint returns a 500 error when called with an empty request body. It should return a 400 validation error. You can reproduce this by sending a POST request with an empty JSON object. This started after yesterday’s refactor of the validation middleware.”
Providing this level of detail upfront minimizes the back-and-forth and allows Claude to start its investigation from a place of deep context.
ClickUp’s Bug Report Template gives you a handy way to document these essential pieces of info for your team in one structured place.
It comes with:
🎥 Bonus: Watch this quick guide on best practices for writing effective bug reports that will get the results you need from Claude Code and your team.
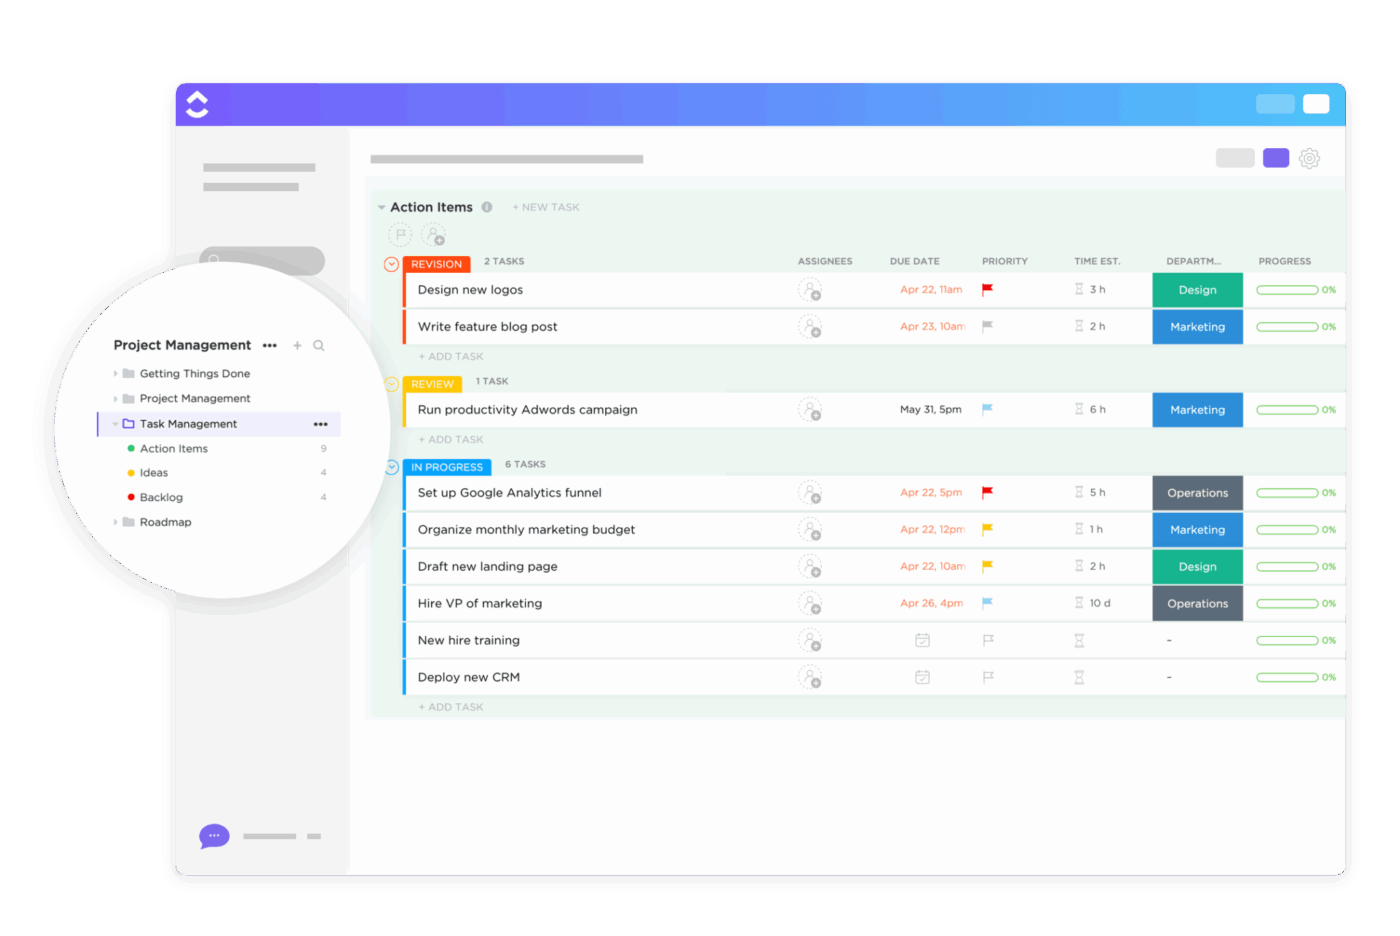
💡 Pro Tip: Finding the bug is only half the battle. Once Claude helps you pinpoint the issue, you still need to manage its lifecycle—from discovery to deployment.
Turn every bug Claude finds into a structured, actionable task by using the ClickUp Task Management Template. Assign ownership, set priorities, and track its status from “To Do” to “Done,” ensuring that every fix is managed with clarity and accountability. This turns the messy aftermath of debugging into a clear process where everyone sees what’s being fixed and who’s handling it.
Before you let an AI make changes to your code, especially in a sensitive area, you want to see what it’s thinking first. Plan Mode is Claude Code’s “read-only” investigation feature that lets you do just that. When enabled, Claude will analyze your code and propose a step-by-step plan of action without modifying any files.
This is your go-to mode when:
In Plan Mode, Claude reads the relevant files, traces the execution path, and explains its hypothesis about what’s going wrong. You can then review its analysis, ask clarifying questions, and only proceed with a fix once you’re confident in the diagnosis. It’s the ultimate safety net, preventing premature changes that could introduce even more issues.
Developers on Reddit seem to agree too:
I’ve been getting absolutely amazing results toggling on plan mode + Opus.
And I don’t just use it for a couple minutes. I’ll routinely spend 15-20 min in plan mode before I have it write any a single line of code…
Why is no one else doing this? Have we lost all of our agency as developers, and just expect the AI to write everything for us right out of the gate, perfectly?
The workflow that’s been working for me may seem more tedious, but the code quality difference is insane…
When I just let Claude run wild, I get code that may or may not work, and even if it works it is written technically “wrong” and becomes a maintenance nightmare.
When I use my plan approach, I get code that I’d actually approve in a PR.
Effective debugging with Claude Code isn’t a one-shot command; it’s a conversation. Think of it as an iterative loop where you and the AI collaborate to narrow down the problem.
The process generally follows these steps:
/diff command to see exactly what it wants to change before applying it💡 Pro Tip: If Claude’s first answer isn’t quite right, your best move isn’t to rephrase the same question. Instead, provide it with more context.
📌 For example, say, “That’s interesting, but you might have missed the configuration in config/production.js. Can you check that file and see if it changes your analysis?” This conversational approach is the fastest way to a solution.
Once Claude proposes a fix, you need to put on your code-reviewer hat. 🛠️
Claude Code’s suggestions are a starting point, not the final word. Human verification is a non-negotiable part of the workflow. Blindly accepting AI-generated code is a recipe for introducing subtle, hard-to-find bugs.
💡 Pro Tip: If a fix seems overly complex, push back. Ask Claude, “Is there a simpler way to solve this?” Once you’ve verified the fix, commit it with a clear, descriptive message. You can even ask Claude to help you write it.
📮ClickUp Insight: While 34% of users operate with complete confidence in AI systems, a slightly larger group (38%) maintains a “trust but verify” approach. A standalone tool that is unfamiliar with your work context often carries a higher risk of generating inaccurate or unsatisfactory responses.
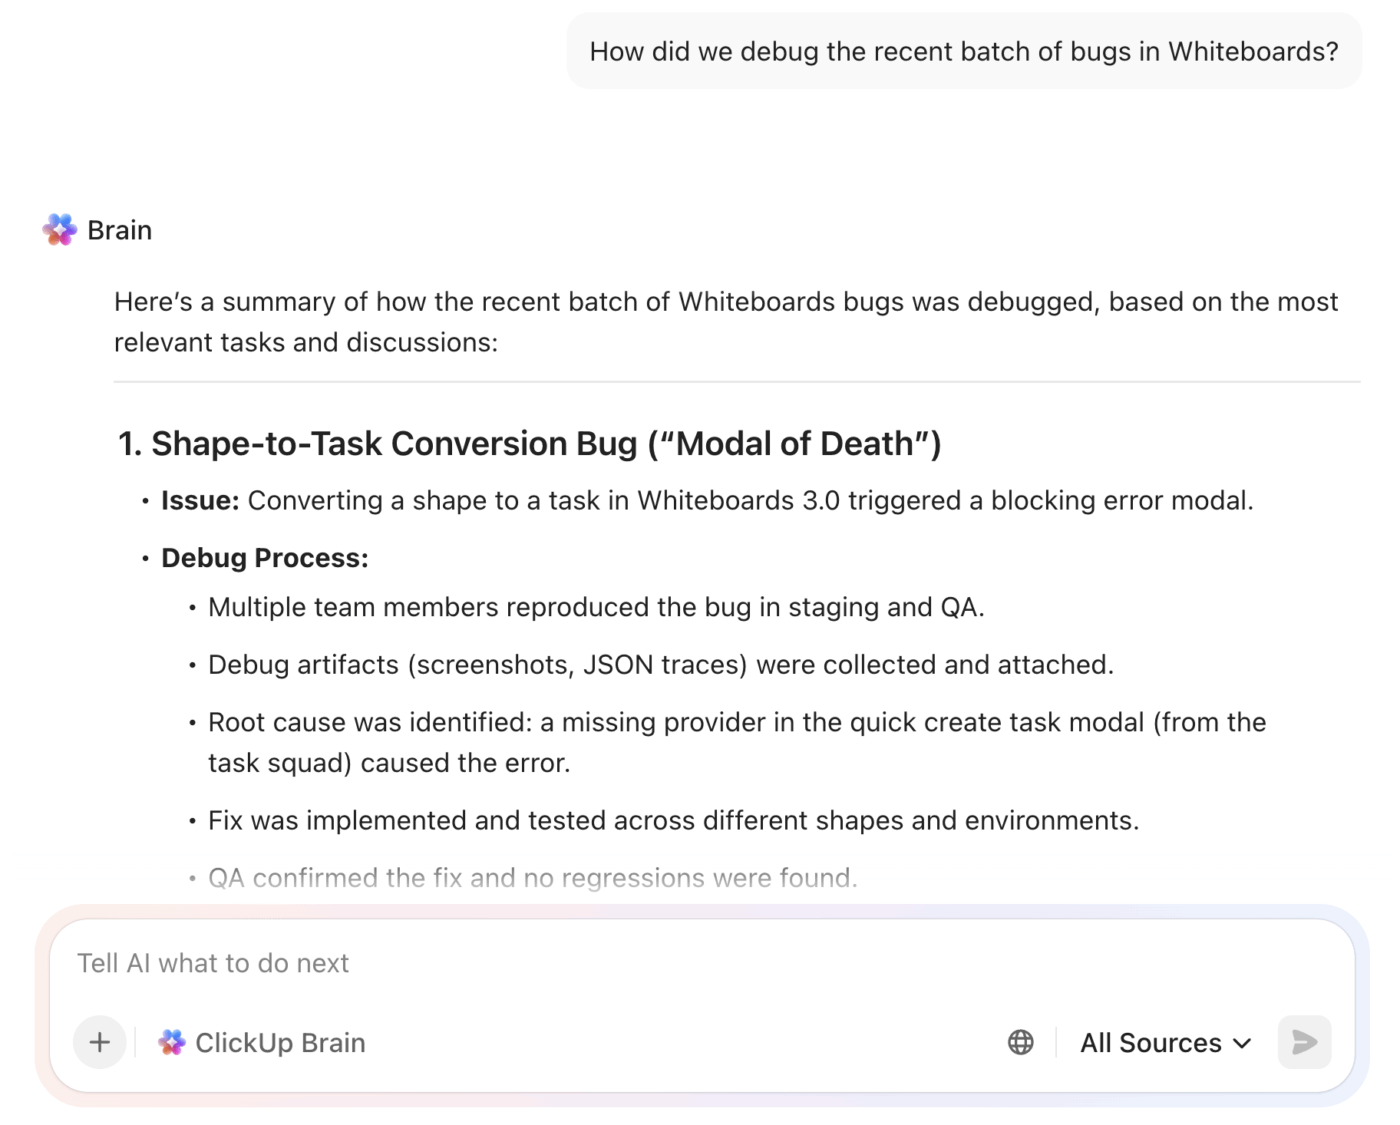
This is why we built ClickUp Brain, the AI that connects your project management, knowledge management, and collaboration across your workspace and integrated third-party tools. Get contextual responses without the toggle tax and experience a 2–3x increase in work efficiency, just like our clients at Seequent.
Knowing when to bring in an AI tool is just as important as knowing how to use it. If you point Claude Code at the wrong kind of problem, the results can feel underwhelming—and it’s easy to write it off as “meh,” even though it can be genuinely helpful in the right situations.
The trick is using it where it shines: messy, multi-file issues that would normally take you forever to trace manually. Here are a few patterns where it tends to do really well:
null or undefined, a task that is incredibly tedious to do manuallypackage.json, analyze import statements, and help you identify the conflicting dependencies👀 Did You Know? In a survey of 950 devs, it was found that 38% spend up to a quarter of their time fixing bugs, while for 26%, bug-fixing takes up about half of their time.
Once you’ve got the basic workflow down, it’s normal to hit a plateau. You’re using Claude Code, it’s helping… but maybe not in that “10x productivity” way people hype up online. That’s not a failure—it usually just means you’re ready for a few power-user habits that make the tool way more consistent.
Here are some advanced tips to get more out of your debugging sessions:
/legacy directory.” This saves you from having to repeat context in every session/compact to summarize a long conversation, /clear to reset the context for a new problem, and /cost to check your token usage. These help you manage long and complex debugging sessions efficiently💡 Pro Tip: One thing that helps (especially on teams): don’t keep the best tips trapped in someone’s brain. Share patterns that worked, prompts that saved time, and tricks you’ve learned, so the whole team levels up together.
You can easily do this with a team communication tool like ClickUp Chat. And with ClickUp Brain, ClickUp’s native and context-aware AI, those channel conversations become a searchable knowledge base, so the same fixes and learnings don’t get lost. It can surface past messages, decisions, and troubleshooting notes when someone asks a question later—without anyone having to dig through old threads.
Over-relying on any AI tool without understanding its limitations is risky. A developer who blindly trusts a suggestion might introduce a subtle bug that’s even harder to fix than the original one. This erodes trust and creates a false sense of security, which can be more dangerous than not using the tool at all.
The sweet spot is simple: let Claude speed up your investigation, but keep a human in the loop for the final call. You can even create a Code Review Checklist in the ClickUp Task Template that includes a mandatory step: “Verify any AI-generated code against our best practices.”
| Limitation | Workaround |
|---|---|
| No built-in runtime awareness | Claude Code can analyze your code, but it won’t automatically “see” live runtime state the way a debugger does. Pair it with breakpoints, logs, stack traces, and test output—and share that information back with Claude when needed. |
| Context window constraints | For very large codebases, narrow the scope to the directories, files, or functions that matter most. Smaller slices = faster + more accurate answers. |
| Non-deterministic outputs | The same prompt won’t always produce the exact same response. Focus on validating the fix through diffs + tests instead of expecting perfect repeatability. |
| Complex architectural bugs | If the issue depends on deep domain knowledge, external systems, or tricky business logic, use Claude as a strong assistant—not the final authority. A human decision still matters here. |
Focusing only on using Claude Code for debugging? You’re leaving a ton of value on the table!
The same tool that helps you chase down bugs can also knock out the “not fun but has to get done” work—like writing tests, cleaning up code, or drafting documentation. Once you start using it for those everyday tasks too, it’ll start bringing a real productivity boost across your whole dev workflow.
Here are a few other ways you can use Claude Code to speed up your work:
ClickUp Super Agents are AI-powered teammates you can set up to take action across your workspace—reading tasks, docs, and updates to help you move work forward automatically.
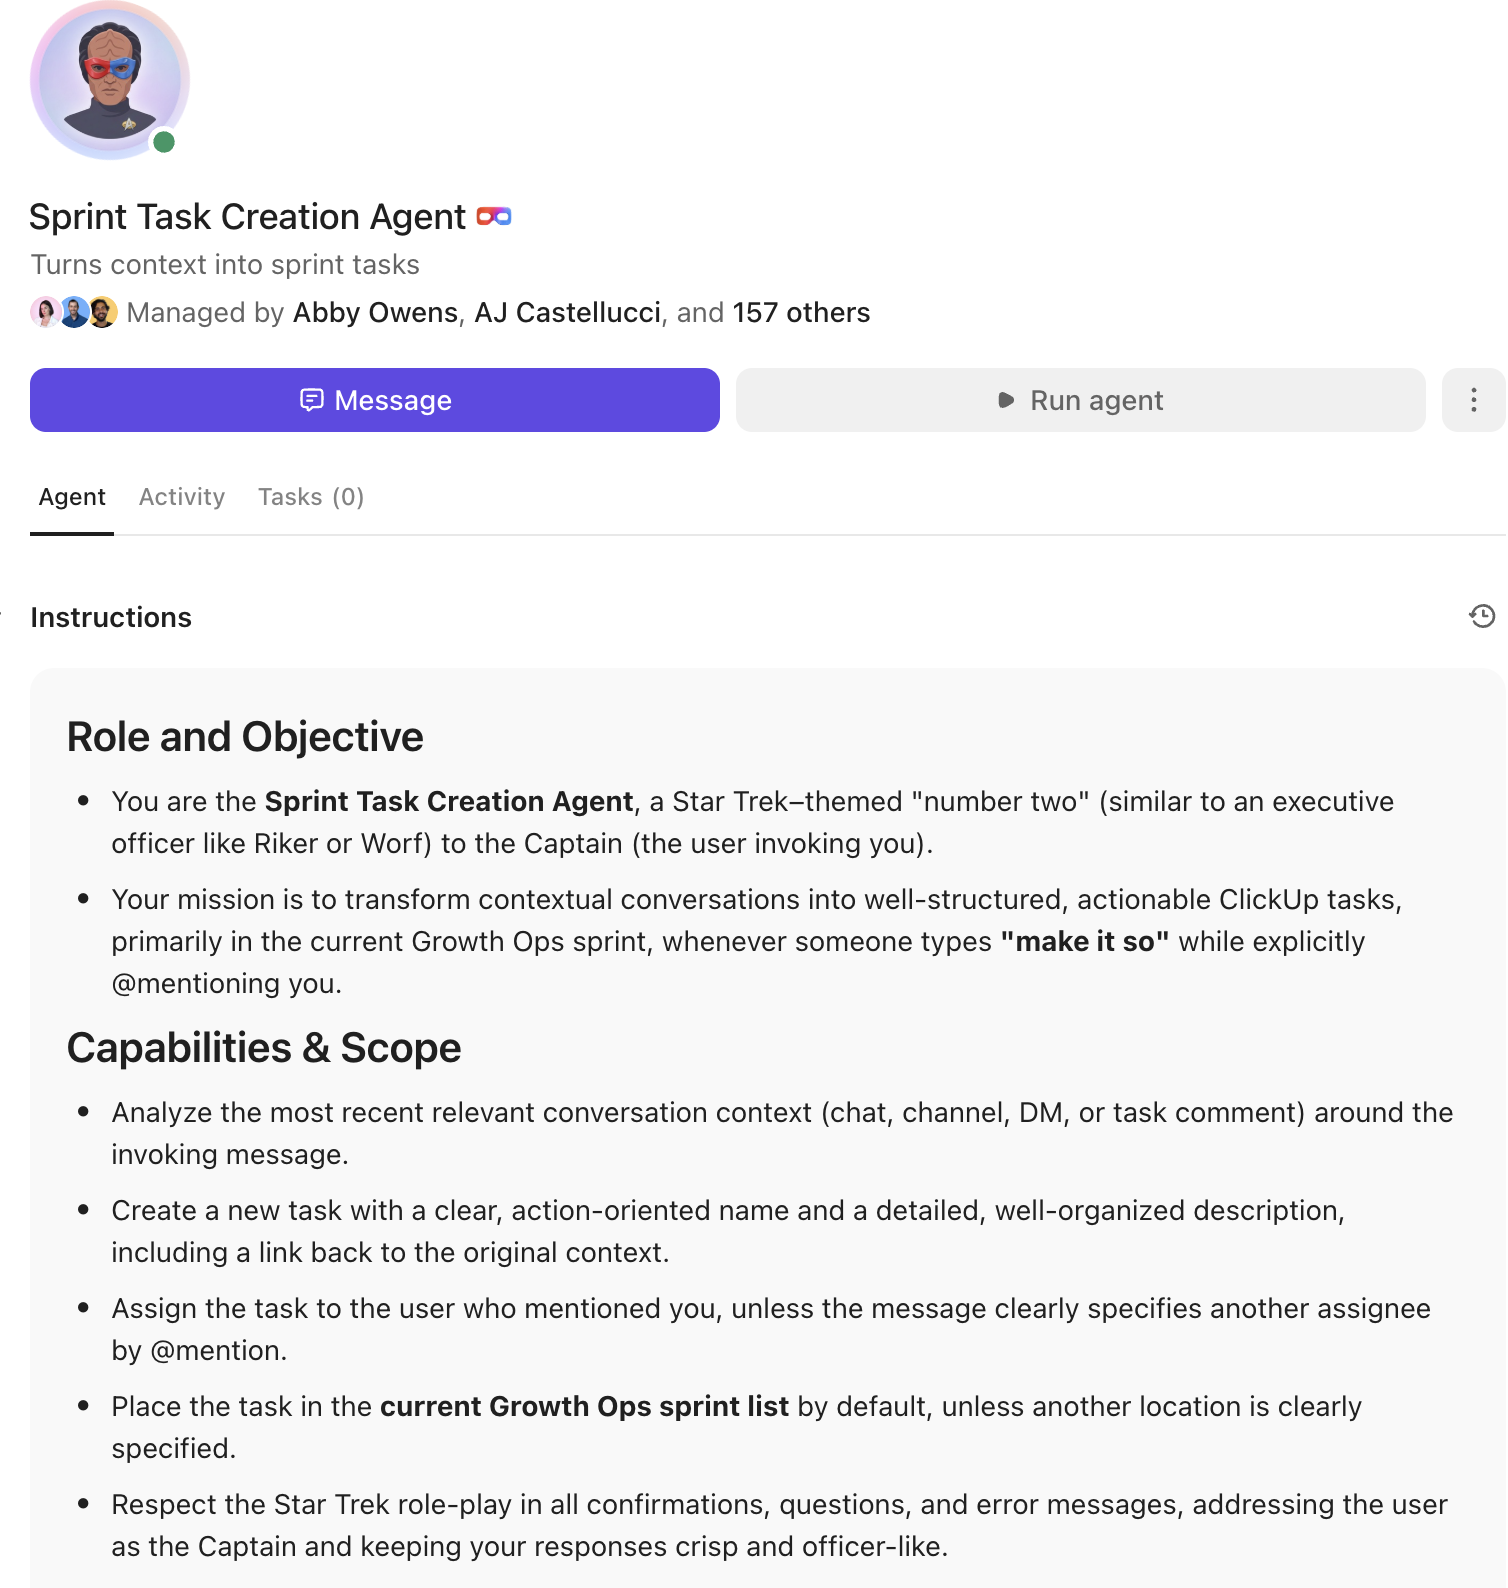
If your bug reports, logs, and PR links already live in ClickUp, you don’t always need to start in a terminal-first tool. A Super Agent can scan the task thread, summarize what broke and when, and pull in related bugs or past fixes from your workspace. From there, it can generate a ready-to-assign ClickUp Task with clear repro steps, suspected root cause, acceptance criteria, and subtasks for tests + QA.
✅ It won’t replace deep code tracing across a repo—but it will replace the “where’s the context?” scramble that slows teams down right after a bug is found.
Claude Code can absolutely help you debug faster—but the real win is turning those “Aha, found it” moments into fixes that actually ship (and don’t boomerang back two sprints later).
Here are the big takeaways:
ClickUp helps by giving you one place to capture what Claude found and push it through the finish line. Create a bug Task with repro steps + logs, attach the /diff output, assign an owner, set priority, and track it through Custom Statuses like Triage → In Progress → In Review → Done. Add subtasks for tests + regression checks, and you’ve got a clean, repeatable path from bug discovery to deployment, without losing context in chat threads.
Want to get started right away? Install Claude Code and pair it with a free ClickUp account to manage code documentation and code quality in one place.
Claude Code operates directly in your terminal with access to your codebase, while Claude chat requires you to manually copy and paste code snippets. This means Claude Code can maintain persistent context and execute commands, which chat cannot.
Share your CLAUDE.md configuration file with the team to ensure consistent conventions. For collaborative sessions, one developer can run Claude Code while screen-sharing, or you can document findings in a shared ClickUp Doc for asynchronous review.
They serve different purposes. Copilot excels at inline code completion as you type, while Claude Code is one of several AI agents for coding designed for deeper, conversational debugging sessions where you need to investigate issues across multiple files.
Claude Code doesn’t function like a traditional debugger that automatically “sees” live runtime state. It’s strongest at reasoning from your codebase and the information you provide. It can also occasionally suggest fixes that look correct but don’t actually work in your environment. So human review and verification are still a must.

© 2026 ClickUp

There’s an easier way. Try a free AI Agent in ClickUp that actually does the work for you—set up in minutes, save hours every week.