
Sorry, there were no results found for “”
Sorry, there were no results found for “”
Sorry, there were no results found for “”
When working with large datasets with Microsoft Excel, duplicates often creep into spreadsheets.
This duplicate data leads to an inaccurate spreadsheet that can throw your analysis off track. If you’re a data manager or a pro-Excel user, you might be familiar with this issue.
The good news? You can identify duplicate rows and entries and remove them effortlessly with a few quick steps involving conditional formatting and Excel formulas.
This guide will walk you through methods for identifying, highlighting, and removing duplicate values from your Excel sheets to improve accuracy and performance. We will also discuss an alternate tool that will make data management 10X easier!
Here’s a quick overview of how to find duplicate rows and cells, delete data, and more:
📝 Ways to Find Duplicates in Excel
➡️ Remove Duplicates
❌ Drawbacks of Using Excel for Finding Duplicates
✅ Use ClickUp: A Better Excel Alternative
Excel allows you to identify duplicate cells and rows using built-in tools like Conditional Formatting, formulas such as COUNTIF, and PivotTables—each suited for different data sizes and use cases.
Whether you need to locate duplicate values or duplicate rows, Excel offers multiple methods to make this task simple and efficient.
Skip the manual search for duplicates in Excel. With ClickUp’s Editable Spreadsheet Template, you can easily organize your data, spot duplicates faster, and keep everything accurate—no complex formulas needed.
Let’s explore three popular ways to identify duplicates in your data.
Select the data range, apply Conditional Formatting from the Home tab, choose “Duplicate Values,” and assign a highlight style. Excel instantly flags repeated cells visually without altering the original data.
Conditional formatting is a quick way to highlight duplicate values in a worksheet. It works well for finding duplicates in a single column or across a range of data.
Here’s how you can use this:
Highlight the cells containing the list of names to find any duplicates.

Navigate to Home on the Excel ribbon. Click on Conditional Formatting in the Styles group.

In the dropdown, choose Highlight Cells Rules, then click on Duplicate Values.

A dialog box will appear. Choose a color scheme, such as red or green, to highlight duplicate cells.

Click the OK button, and Excel will highlight the duplicate values or duplicate names in the selected cells automatically.

💡 Pro Tip: Master Excel like a pro! This Excel cheat sheet [with formulas and tips] covers essential formulas, shortcuts, and tips to enhance productivity and simplify complex tasks. A must-read for anyone aiming to level up their spreadsheet skills! 📊
Add a helper column and apply the COUNTIF formula to count how often a value appears within a selected range. Any result greater than one indicates a duplicate, allowing you to identify repeated rows systematically.
The COUNTIF Excel formula is particularly helpful when you need to count duplicates or identify duplicate rows.
Follow these steps:
Let’s assume column D, next to the Purchase Order Number (Feb) column, is a helper column.

🔍 Did you know? A single spreadsheet can hold 1,048,576 rows by 16,384 columns. That’s a lot of data!
In the helper column in cell D2, enter the following formula:
=COUNTIF($A$2:$A$11, A2)

Drag the formula down to the rest of the rows in column D. Any value greater than 1 indicates a duplicate product code.

💡 Pro Tip: Check out 25 Excel hacks and tricks to boost your productivity and transform the way you work with Excel! Discover game-changing shortcuts, hidden features, and time-saving tricks to skyrocket efficiency. 🚀
This is how PivotTable helps to find duplicate rows:
Pivot tables are a powerful tool for summarizing data and spotting duplicates. They are ideal for larger datasets or when analyzing duplicates with multiple columns.
Here’s how to use them:
Highlight the entire dataset, including the header row.

Go to the Insert tab on the Excel ribbon. Click PivotTable and select From Table/Range.

A dialog box will appear. Click the OK button.

Drag the Product Code field to the Rows area of the PivotTable. Then, drag the same Product Code field to the Values area. By default, it will be set to Count.

The PivotTable will display a list of unique product codes along with the count of each. Any product code with a count greater than 1 is a duplicate.

💡 Quick Hack: Reduce errors by learning how to automate Excel to streamline your workflow and tasks! 🔄✨
Select the dataset, open the Remove Duplicates tool from the Data tab, choose the columns that define uniqueness, and confirm. Excel deletes duplicate rows permanently while retaining one unique entry.
Learning how to remove duplicates in Excel is even easier. Here’s how:
Select all the cells containing your data, including the header row, by clicking and dragging your mouse.

Go to the Data tab on the Excel ribbon. In the Data Tools group, click on Remove Duplicates.

➡️ Read More: Unlock the power of Excel by understanding how to use Excel for project management! Learn how to create timelines, track tasks, and streamline workflows—all within a familiar spreadsheet format. 📊✅
A dialog box will appear. In the Columns section, make sure all the headers are checked to identify and remove duplicates. Click the OK button.

Another dialog box will appear, stating how many duplicate values were found and how many unique values remain. This will automatically remove duplicates from the lists.

➡️ Read More: Master the art of Excel with this ultimate guide to the top Excel formulas everyone should know! From basic calculations to advanced functions, these formulas will transform your data management skills and save time. 🧮✨
Excel relies heavily on manual actions, permanently deletes data when removing duplicates, struggles with real-time collaboration, and lacks automation—making it risky for dynamic or multi-user datasets.
Excel is a powerful tool, but it’s not without its challenges—especially when dealing with duplicate data. While it offers many features, like Conditional Formatting, to find duplicate values, it comes with limitations that slow down your workflow or lead to inaccuracies.
Let’s look at some of them:
➡️ Read More: How to Apply Data Validation in Excel
Given these limitations, opting for a database software like ClickUp would be a better step. ClickUp is an all-in-one productivity tool with advanced automation capabilities to simplify your data management and workflows.
Let’s look at what makes ClickUp the best Excel alternative for productivity and efficiency.
ClickUp combines spreadsheet-style data handling with automation, collaboration, and task management—reducing duplicate errors while keeping data connected to real workflows.
ClickUp is a reliable Excel alternative and doubles up as a spreadsheet software that helps you manage your database with expertise. That’s not all; it has advanced project management features, so you can bring your entire workflow under one roof.
Here’s how ClickUp can help you manage your database and spreadsheets effectively:
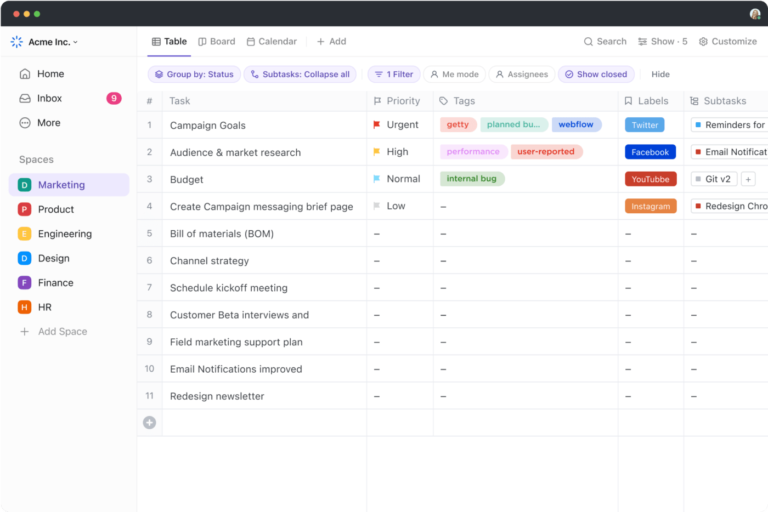
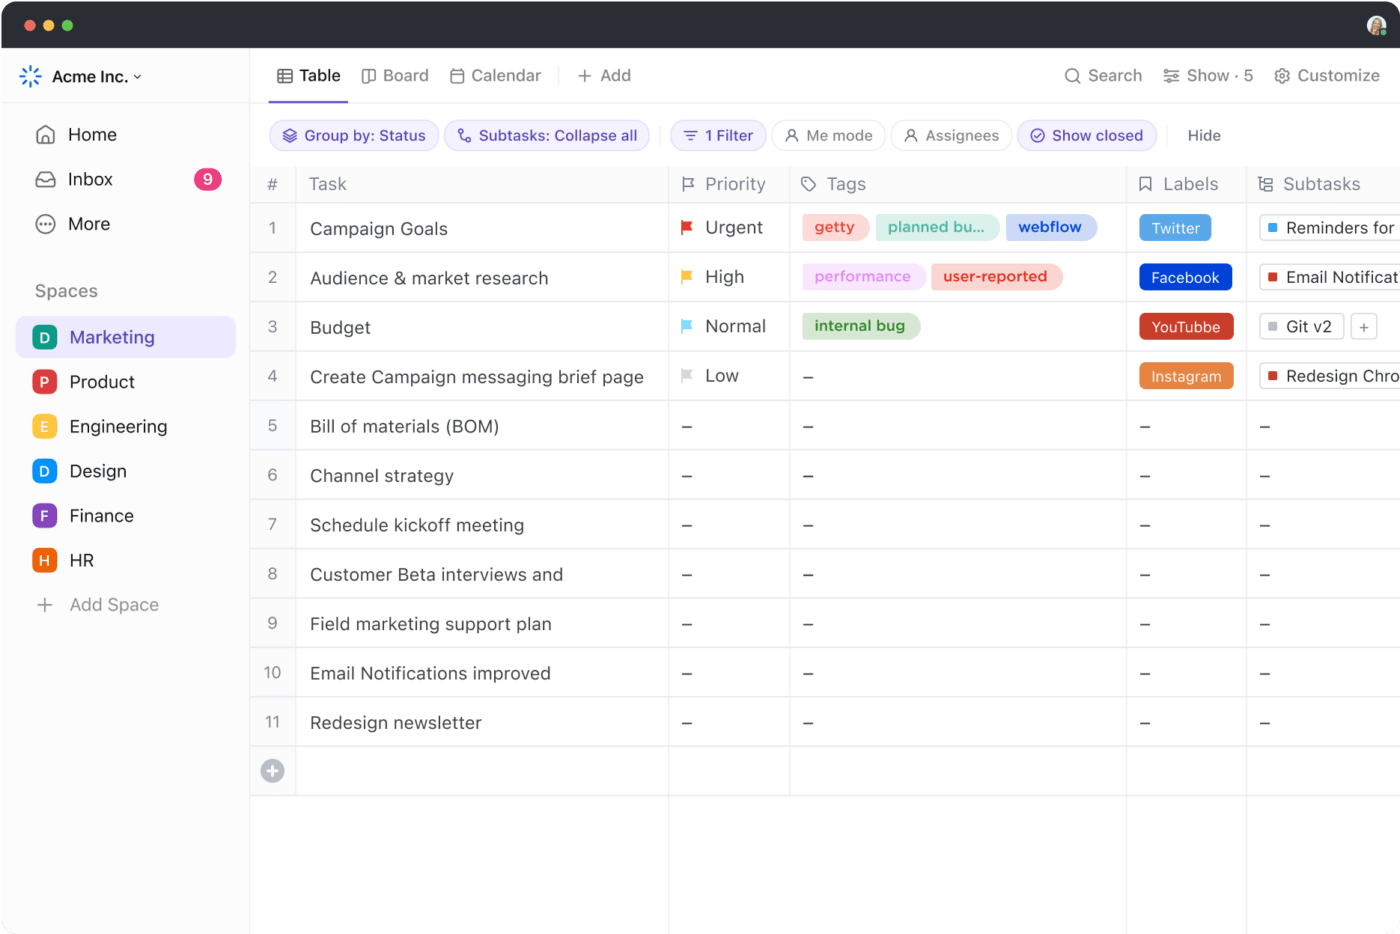
ClickUp Table View stores data in structured fields, applies filters and formulas automatically, and keeps entries synced in real time—reducing duplicate creation while maintaining a spreadsheet-like experience.
ClickUp Table View is your go-to tool for easy data management. It allows you to create clean, organized spreadsheets and databases in a snap.
Whether you’re tracking projects, evaluating budgets, managing clients, or organizing your team, it gives you all the required details at a glance.
📮 ClickUp Insight: 92% of knowledge workers risk losing important decisions scattered across chat, email, and spreadsheets. Without a unified system for capturing and tracking decisions, critical business insights get lost in the digital noise. With ClickUp’s Task Management capabilities, you never have to worry about this. Create tasks from chat, task comments, docs, and emails with a single click!
ClickUp Table View allows you to see tasks, data, and Custom Fields in a structured grid format—just like a spreadsheet but with way more flexibility. It allows you to customize your columns to suit your needs and add fields for numbers, dates, dropdowns, and even formulas.

Need to track revenue, timelines, or priority levels? It’s all in one place, neatly arranged. Filter and sort your data, prioritize it, attach files, add formulas, and have access to 15+ other flexible views to visualize data however, it suits your needs.
💡 Quick Hack: Learn how to consolidate data from multiple sheets in Excel with these simple steps:
ClickUp’s Formula Fields help you calculate, analyze, and automate data effortlessly, so no manual math is required, even in your worst nightmare.
Formula Fields allow you to calculate directly in ClickUp using numbers, dates, or even other formulas. Create simple calculations like addition or subtraction, or write more advanced formulas with logic and conditions.
The results are automatically updated, saving time and reducing manual errors. Let’s look at some examples to understand how they work.
In Table View, click the plus icon above the task list, select Formula, name your Formula Field, and start building your formula.

For instance, if you have two numeric Custom Fields, Revenue and Cost, create a Profit field to keep an eye on project profitability with this simple formula:
field(“Revenue”) – field(“Cost”)
Once values are entered for Revenue (e.g., $10,000) and Cost (e.g., $7,000), the Profit column will display $3,000 automatically.
To create an Advanced Formula in ClickUp, click the plus icon, select Formula, name it, and click Create. Then, click the fx symbol, toggle on Advanced Editor, type your formula, and press Calculate.

For instance, if you want to know how late a task is, use this formula to calculate days overdue:
DAYS(field(“Due Date”), field(“Start Date”))
This formula calculates the difference between the Due Date and the Start Date, showing how many days a task is overdue. Let’s say the Due Date for a task was December 1, and today’s date is December 5. When you apply the formula, it returns 4, meaning the task is 4 days overdue.
💡 Pro Tip: Enable ClickUp AI to generate an advanced formula for you! While results may vary with complex syntax, this tool continues to improve, saving time on intricate setups. 🔢

ClickUp Automations takes the busywork off your plate by automating repetitive tasks. With just a few clicks, set up workflows to handle task assignments, status updates, email notifications, and more.
This feature helps you save time and eliminate human errors, whether you’re managing marketing campaigns, engineering projects, or client handoffs.

Using ClickUp Automations, view a task and move it to In Progress. The system automatically assigns it to the right person, updates the task’s priority, and notifies your team. Or, when a client submits a form, ClickUp sends an email confirmation and creates a task with all relevant details.
ClickUp Automations can even handle complex workflows. It enables you to integrate with tools like HubSpot, GitHub, and Twilio to ensure seamless communication between apps.
The result? Smoother processes and more time to focus on high-value work!
Formula Fields in Automations take flexibility to another level.
They allow you to use formulas as triggers or conditions, creating dynamic automation. For instance, trigger a status change if a calculated field, like total project cost, exceeds a specific amount. You can also notify when a formula identifies underperforming metrics, such as a drop in sales.
Regardless of the level of tasks—simple task updates or advanced calculations, ClickUp Automations transforms how your team works!
ClickUp also comes with several templates that help with data management. The ClickUp Editable Spreadsheet Template simplifies data management, whether you’re tracking finances, analyzing budgets, or organizing project information.
For example, you could automate calculations like Gross Profit using formulas or set up recurring tasks to remind yourself to update data regularly.
➡️ Read More: Streamline your workflows and save time with these ready-to-use free spreadsheet templates in Excel & ClickUp! Perfect for tracking, planning, and organizing tasks effectively. Don’t miss out on these free resources to boost productivity. 📊✨
Advanced data management, such as effectively finding and removing duplicates, transforms your workflow.
You can boost productivity and reduce minor inefficiencies with streamlined processes, real-time collaboration, and improved organization.
ClickUp offers a comprehensive solution for project management and data visualization. It organizes tasks effectively and easily monitors progress so you do not have to deal with hectic duplicates.
Its features, such as the Table View, Automations, and pre-built spreadsheet templates, make managing data simple and intuitive.
Ready to optimize your work? Sign up for ClickUp today and take your productivity to the next level!

Praburam Srinivasan
Max 11min read

Arya Dinesh
Max 11min read
Praburam Srinivasan
Max 15min read

© 2026 ClickUp


