


Still downloading templates?
There’s an easier way. Try a free AI Agent in ClickUp that actually does the work for you—set up in minutes, save hours every week.
Sorry, there were no results found for “”
Sorry, there were no results found for “”
Sorry, there were no results found for “”
You’ve color-coded your calendar entries and blocked off time for tasks. Reminders are in place, too. Maybe you’ve even set up multiple calendars to keep your team organized. Google Calendar does seem like a great way to get things done on time.
But when it comes to tracking the complete project timeline? It starts to fall short.
That’s because it isn’t built to show how all your tasks connect across time, teams, or dependencies. What you need is a Gantt chart—a visual, zoomed-out view of how your project unfolds from start to finish.
Now, Google Calendar doesn’t offer a Gantt chart out of the box. But with a few manual tweaks (and a little patience), you can create a workaround.
In this guide, we’ll show you how to simulate a Google Calendar Gantt chart. We’ll also discuss its limitations and how tools like ClickUp give you a faster, more brilliant way to manage timelines without the hassle of a tedious setup.
👀 Did You Know? According to a study by PMI, 37% of projects fail due to unclear goals and poor timeline planning. That’s why visual tools like Gantt charts are more than just pretty timelines—they’re planning essentials.
Technically? Yes.
Effectively? That’s not so straightforward.
Google Calendar offers no built-in Gantt chart features—no drag-and-drop scheduling, dependencies, or visual bars stretching across dates. There’s no way to track task progress, group timelines, or shift things dynamically when deadlines change.
But if you’re up for some manual effort, you can simulate a Gantt chart by exporting data and formatting tasks and timelines in Google Sheets or Excel. You can also get a rough visual timeline by creating separate calendars, setting start and end dates for each task, and color-coding your events.
It works. For personal projects or maybe even a single campaign with limited tasks. But the moment your team, scope, or timelines grow, it gets messy fast.
When you need to track dependencies, manage multiple calendars, or coordinate across teams, Google Calendar starts to feel more like a stopgap arrangement than a true project management solution.
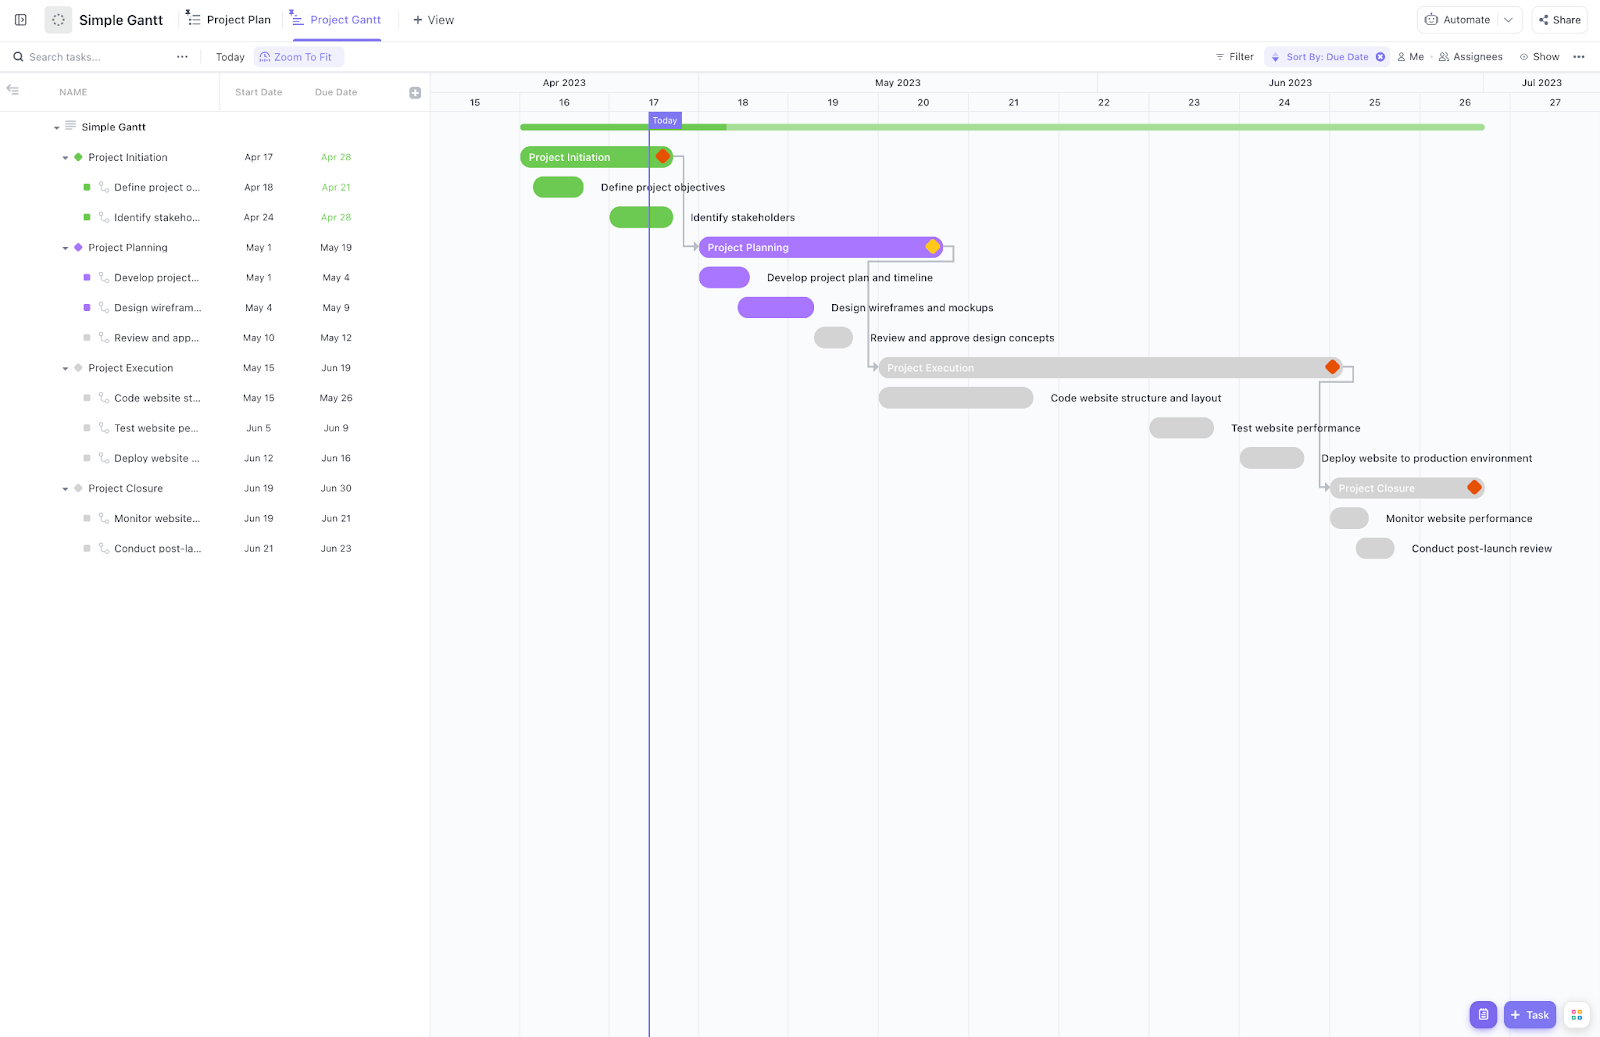
Want a clear, color-coded timeline view of your project so you can instantly track progress and spot roadblocks? ClickUp’s Simple Gantt Chart Template automatically pulls tasks from your List into a Gantt chart, complete with status-based colors to show what’s open, in progress, or done at a glance. With multiple view options and flexible use across teams—from design and engineering to HR and ops—it’s a fast, visual way to bring structure to your planning.
Here’s the easiest way to create a Gantt chart in Google Calendar:
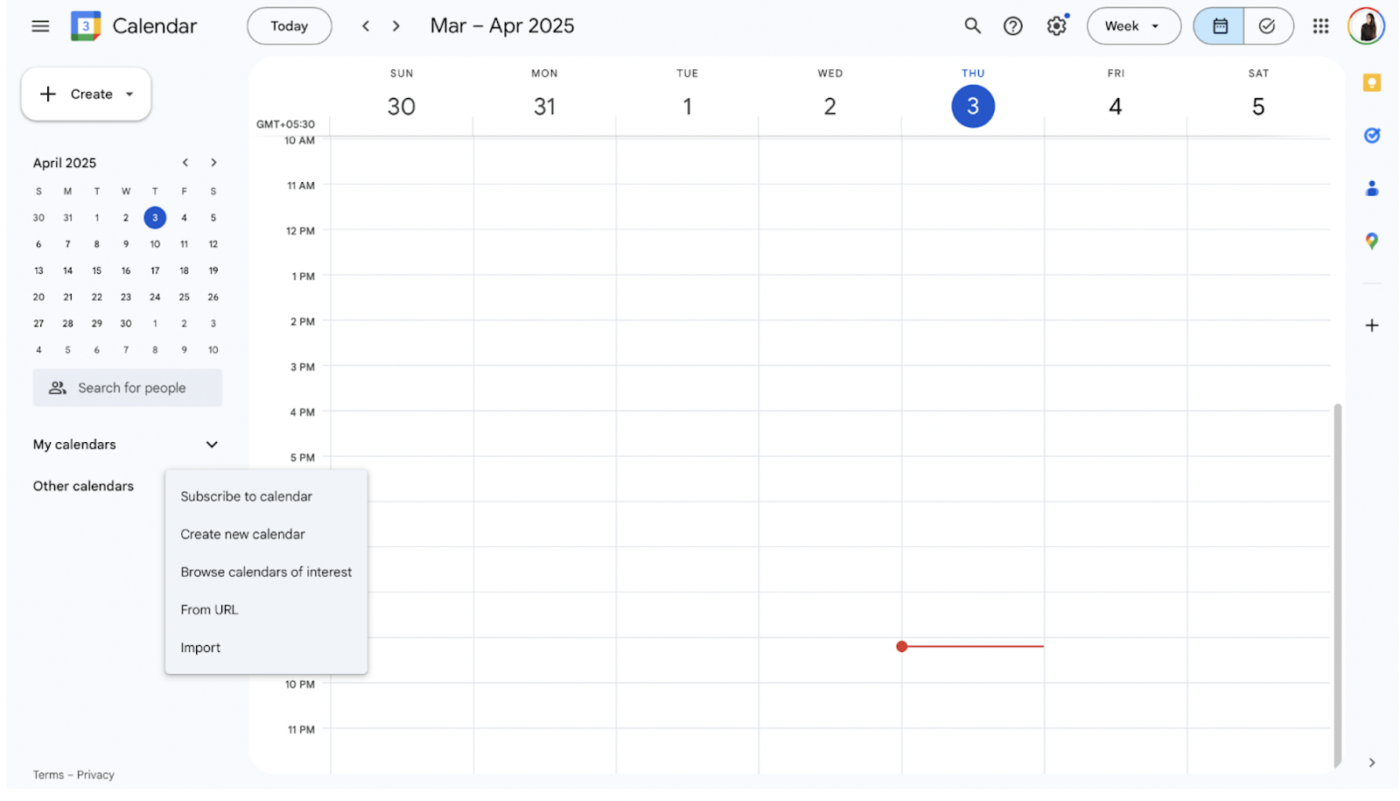
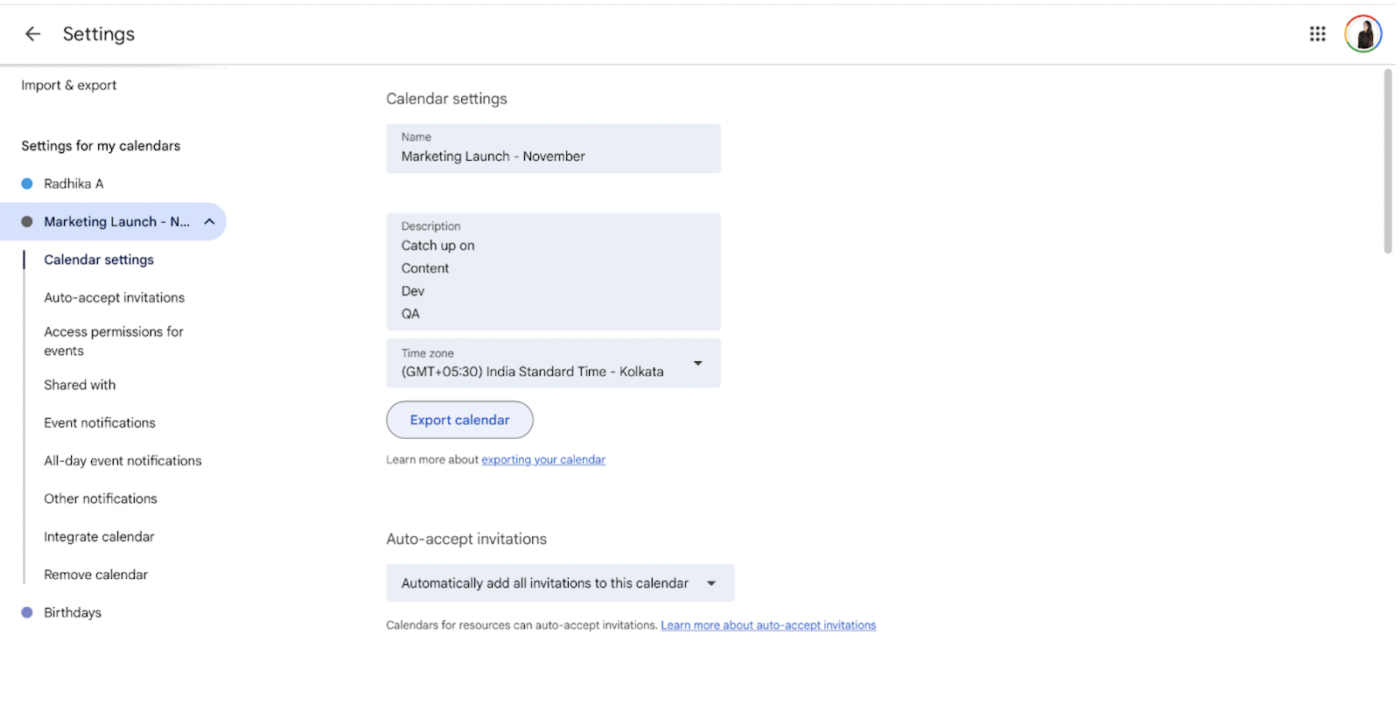
Let’s create a dedicated calendar just for your project to start afresh and avoid clutter or overlap with your existing commitments and priorities. Follow these steps:
This calendar will double as the canvas for your project timeline, where each task becomes an event on the calendar.
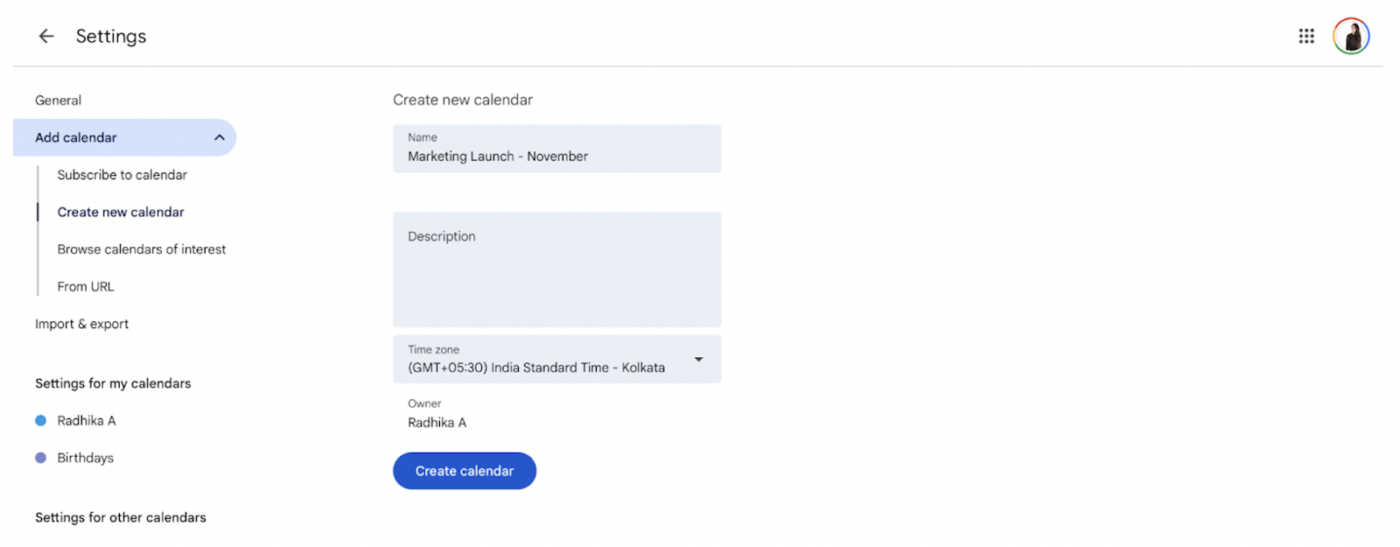
📌 Creating a separate calendar helps group relevant tasks, timelines, and team responsibilities together, enhancing your calendar organization and making your Gantt chart easier to manage.
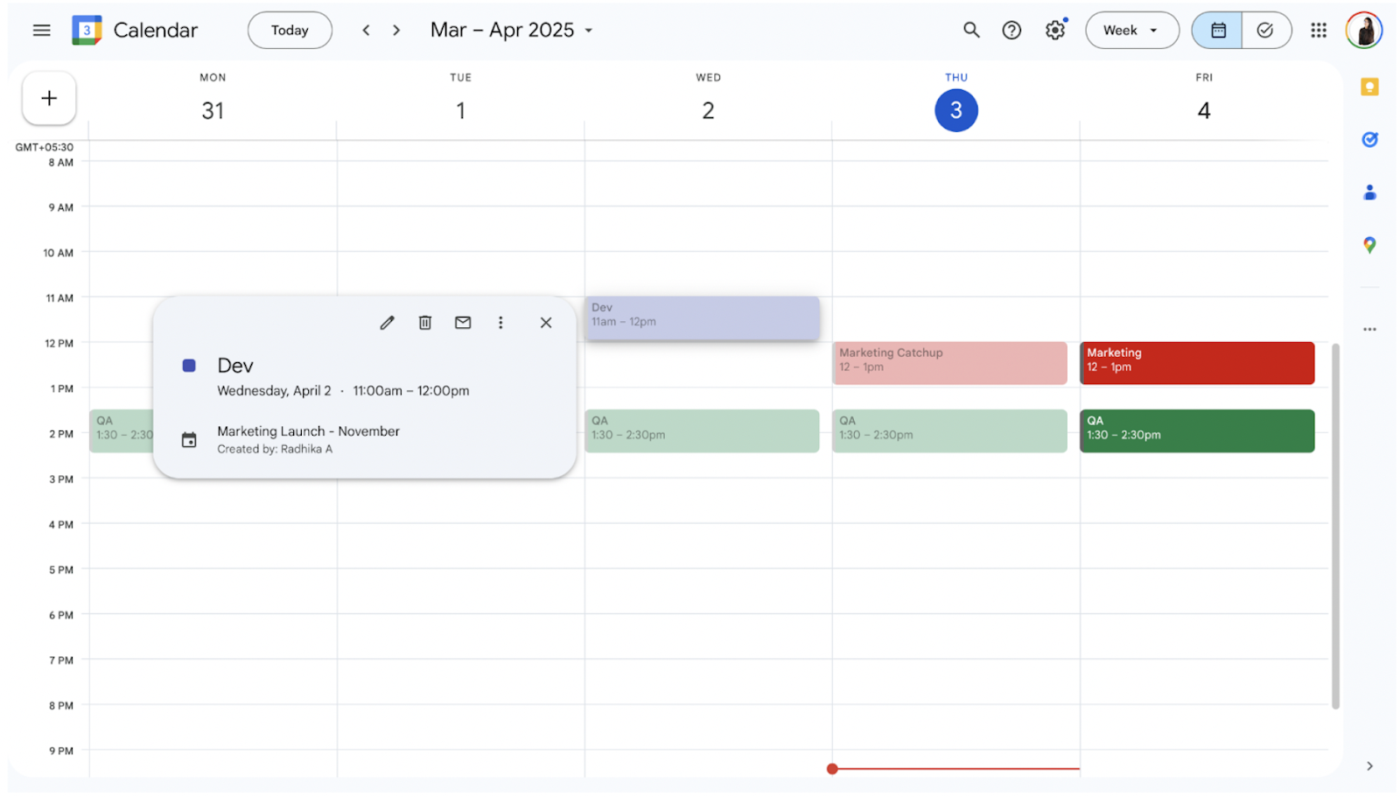
Now, list every task your project needs for effective completion, from kickoff to delivery.
📌 These all-day, color-coded blocks visually resemble Gantt chart examples, helping you simulate a timeline without investing in extra tools.
💡 Pro Tip: Use the “Description” field to log the task owner, deadline, or any important links—this avoids confusion later. More on this in the next step!
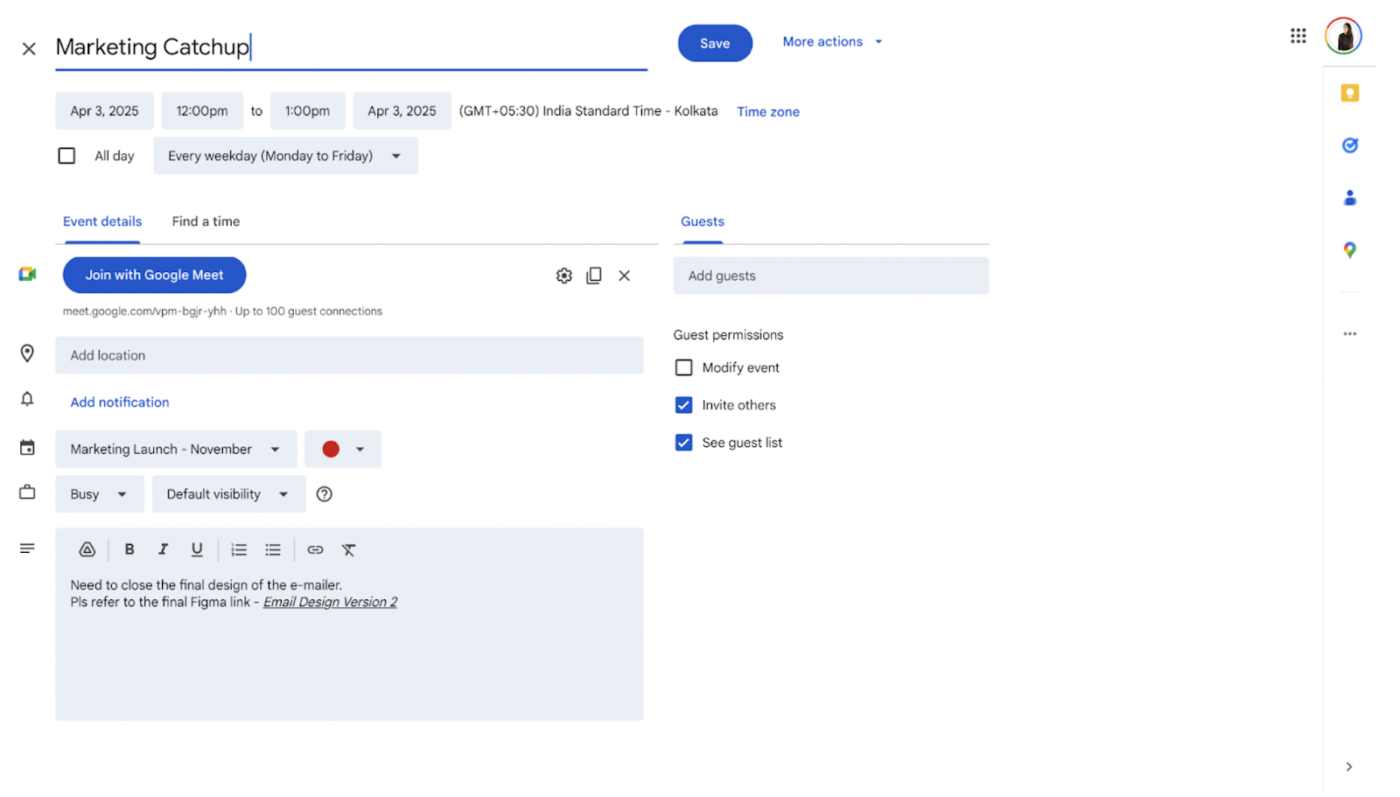
To fully understand what needs to be done, it helps to go beyond just writing task titles—adding details can clarify scope, priority, or blockers. Since Google Calendar doesn’t support task dependencies, you must manually add context to your tasks.
Here’s how to keep things clear:
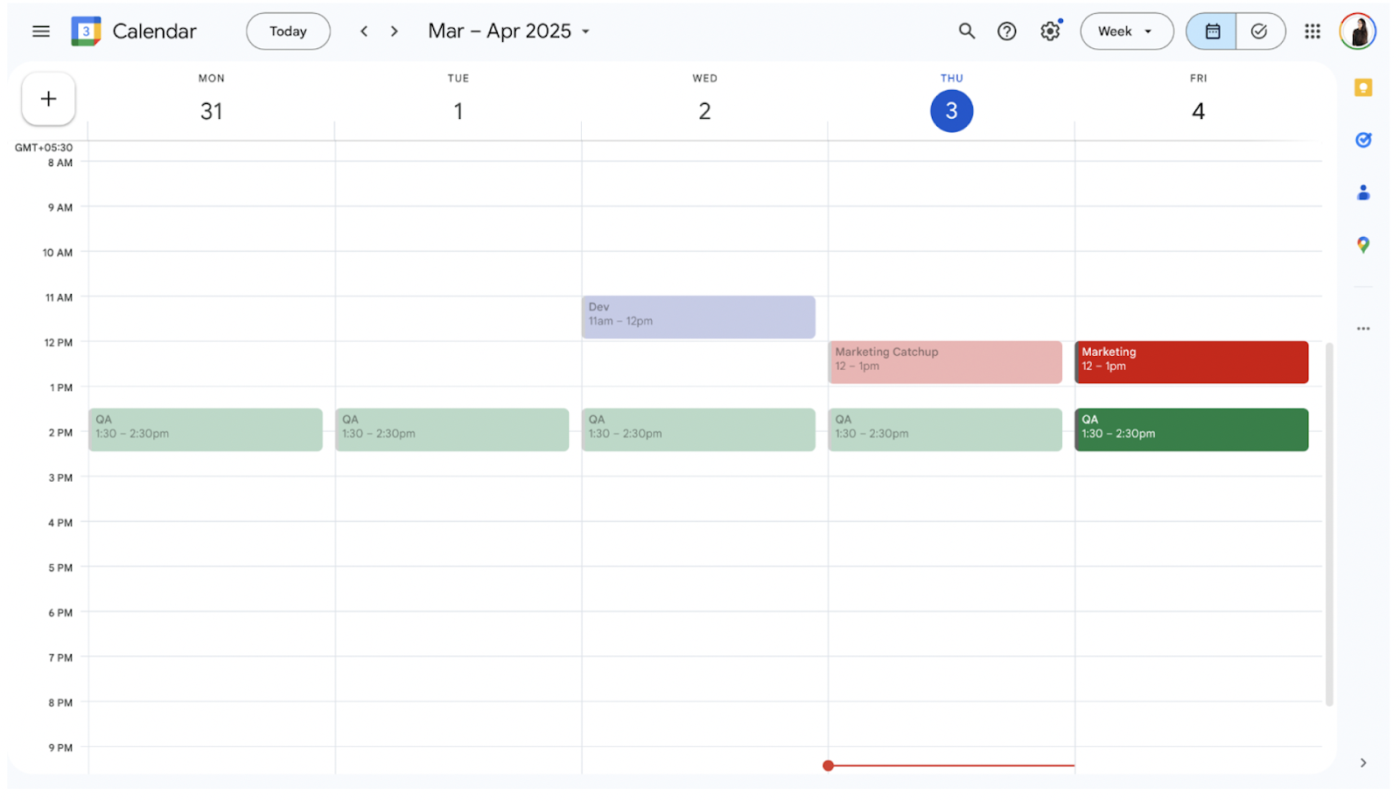
Now that your tasks are mapped out, it’s time to visualize them.
📌 This isn’t a full Gantt chart, but it helps you mimic the format by stacking tasks over time and observing overlaps.
Want a more visual, editable Gantt chart? Here’s a method that gives you more control:
📌 This format allows more flexibility in tracking progress and dependencies. It’s also great for sharing updates or syncing with teams.
🧠 Fun Fact: The original Gantt chart was designed over a century ago to manage factory production schedules.
It’s still one of the most effective tools for visualizing timelines. But with the right platform, you don’t need to figure out how to create a Gantt chart from scratch or juggle between spreadsheets and static calendars!
While it’s possible to cobble together a Google Calendar Gantt chart, this workaround has some serious trade-offs. It’s neither scalable nor collaborative, and definitely not designed for dynamic project needs.
Here are some issues you’ll run into while turning your Google Calendar into a Gantt view:
📮ClickUp Insight: 31% of managers prefer visual boards, while others rely on Gantt charts, dashboards, or resource views. But most tools force you to pick one. If the view doesn’t match the way you think, it just becomes another layer of friction.
With ClickUp, you don’t have to choose. Switch between AI-powered Gantt charts, Kanban Boards, Dashboards, or Workload View in a single click. And with ClickUp AI, you can auto-generate tailored views or summaries based on who’s looking—whether it’s you, an exec, or your designer.
💫 Real Results: CEMEX sped up product launches by 15% and cut communication delays from 24 hours to seconds using ClickUp.
For simple scheduling, Google Calendar works fine. But once your project involves interdependencies, dynamic task shifts, collaboration, or timeline adjustments, ClickUp’s purpose-built Gantt system is substantially more powerful and efficient, with automation, clarity, and integration.
As the everything app for work, ClickUp offers a full-featured project management ecosystem with built-in chat/comments, time‑tracking, whiteboards, AI‑summaries, and real-time sync across list, board, table, calendar, and Gantt views.
No manual exports. No clunky workarounds. Just complete visibility and control from start to finish—with automations!
With Gantt chart project templates, ClickUp also helps you get started instantly, skipping the manual setup process altogether. You can choose from templates for marketing campaigns, agile sprints, product roadmaps, and more.
Here’s a quick summary of why ClickUp is a better Gantt chart tool than Google Calendar:
| Feature | ClickUp Gantt Chart | Google Calendar + DIY Gantt |
| Task dependencies | ✅ Automatically handled | ⚠️ No built-in support |
| Critical Path & Slack | ✅ Fully visible and manageable | ❌ Not available |
| Drag‑and‑drop timeline | ✅ Direct interactivity | ❌ Manual & static events only |
| Progress tracking | ✅ % complete, milestones, color-coded | ⚠️ Limited to manual notes or events |
| Collaboration & comments | ✅ Rich chat, comments, whiteboard built-in | ❌ None (requires separate tools) |
| Integration ecosystem | ✅ Gantt + calendar + Slack + GitHub sync | ✅ Calendar integration only |
Now, let’s break down why it’s the smarter choice for visual project planning.
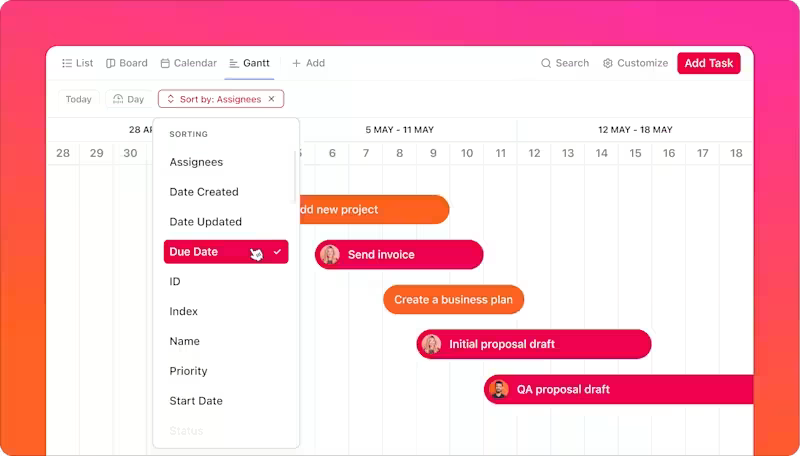
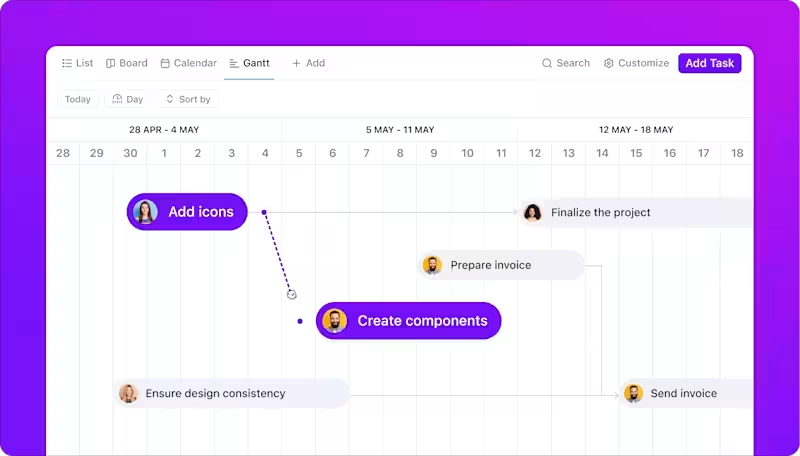
ClickUp includes a dedicated Gantt Chart View, allowing you to assign, link, and drag tasks along a visual timeline. Dependencies, critical paths, slack, milestones, progress percentages, and color‑coding are all built in, so you don’t need to grapple with multiple tools to make progress.
The ClickUp Gantt Chart View helps you do more than view timelines—it enables you to orchestrate your entire project flow from one screen.
Here’s what you can do with it:
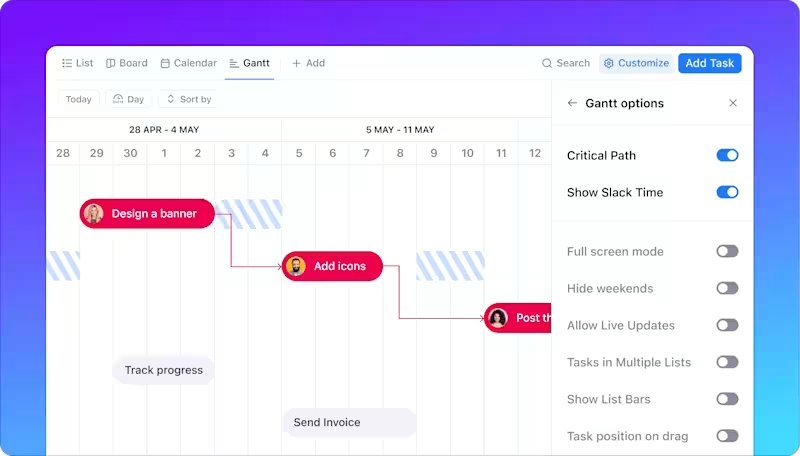
💡 Pro Tip: Use the critical path view to identify which tasks directly impact your project’s timeline—so you know exactly where delays will hurt most. Display Slack Time to show which tasks have room to move without affecting deadlines.
🎥 Watch it in action:
You can create custom Gantt charts in ClickUp by clicking the +View button at the top of a List, Folder, or Space in ClickUp and choosing Gantt.
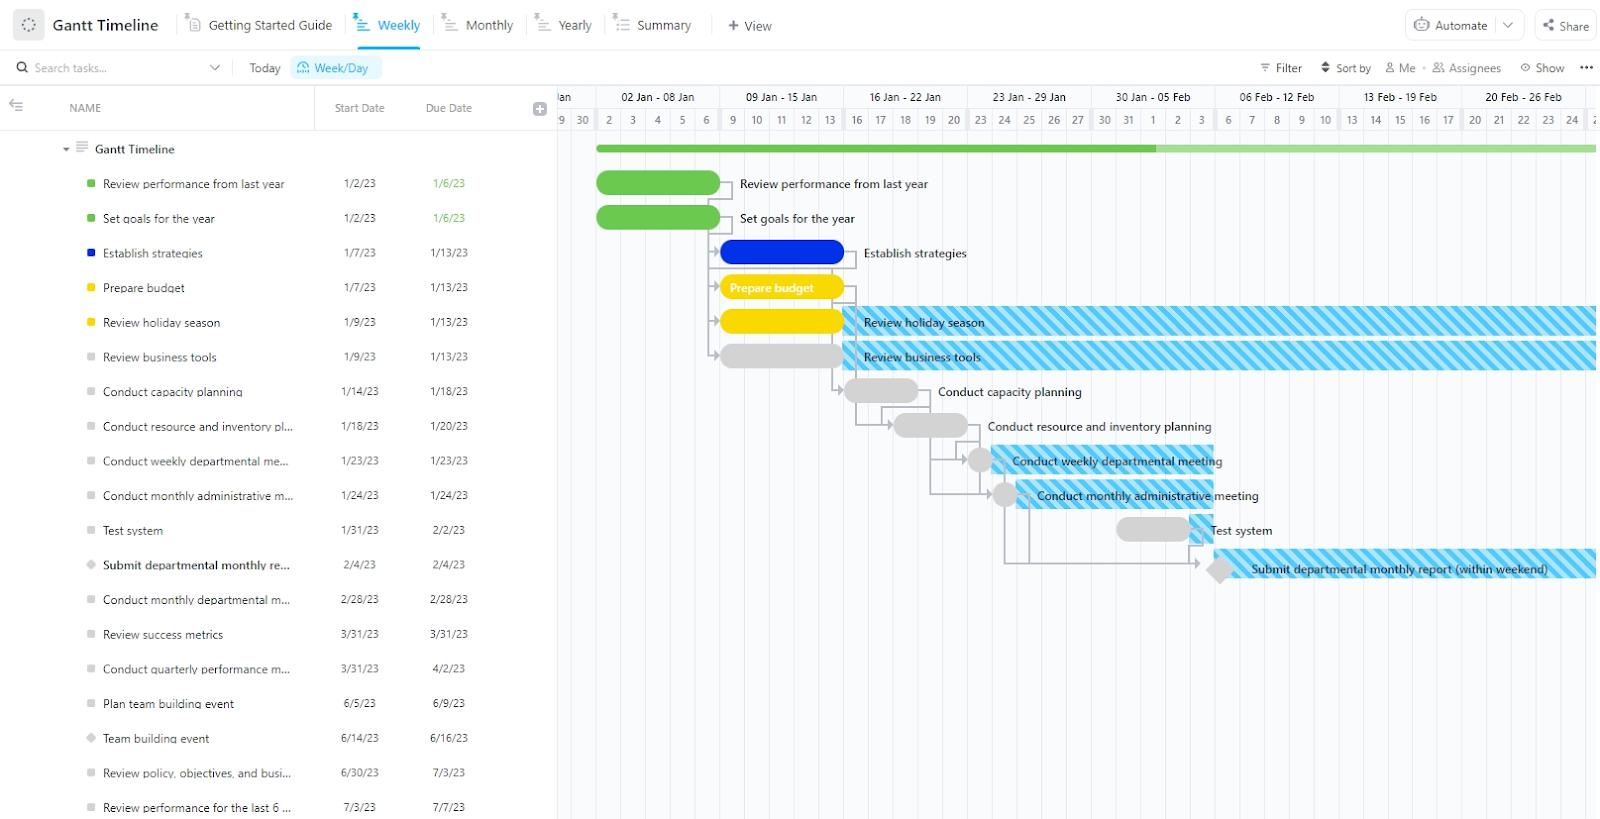
Or you can pick and choose from dozens of Gantt templates, such as the ClickUp Gantt Timeline Template. This free template helps teams build structured timelines, allocate resources, and track progress easily.
Use it to:
You shouldn’t need three different tools just to figure out your week.
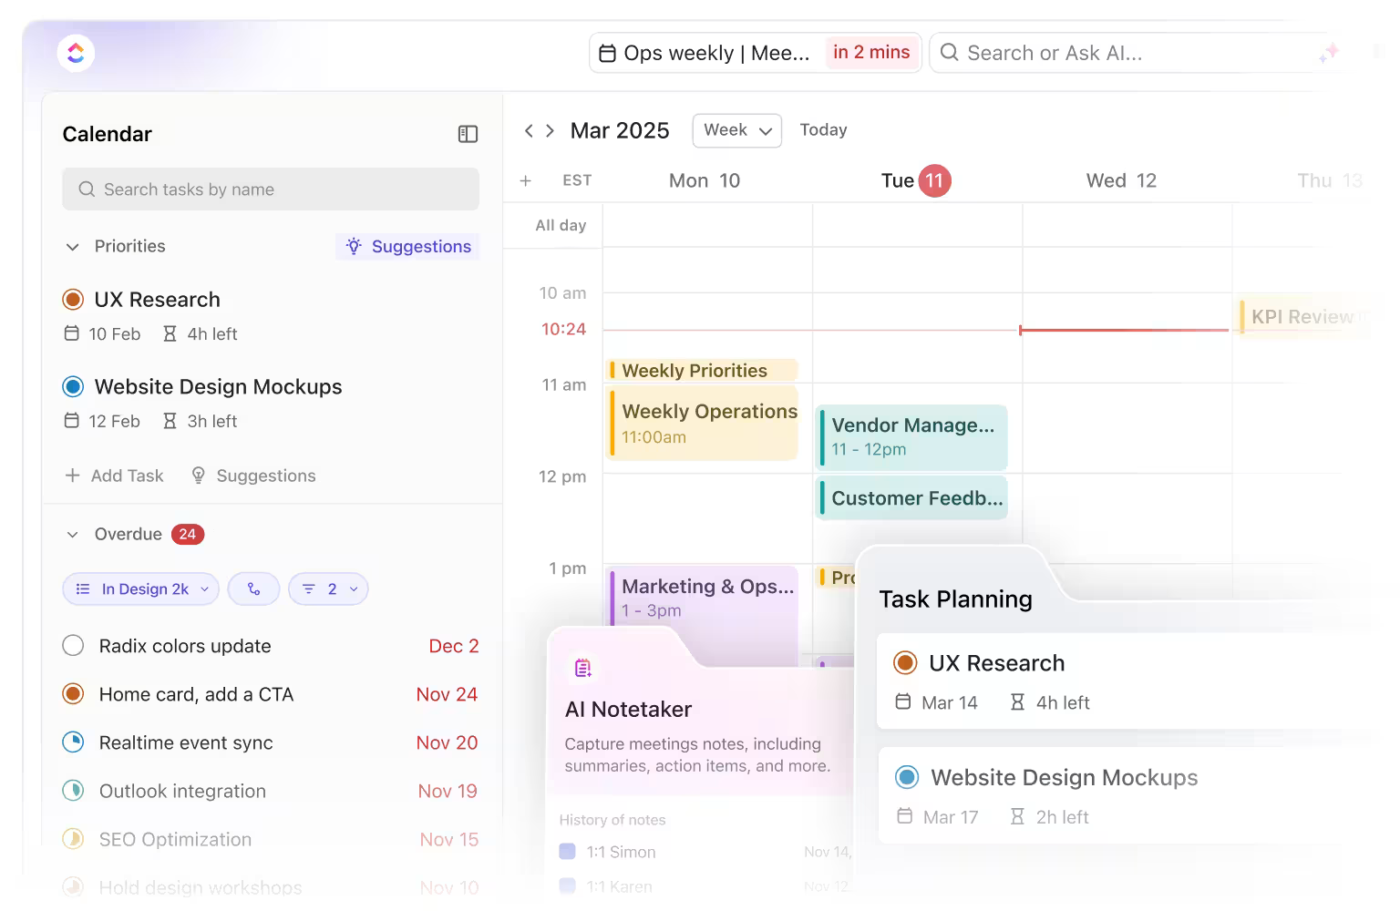
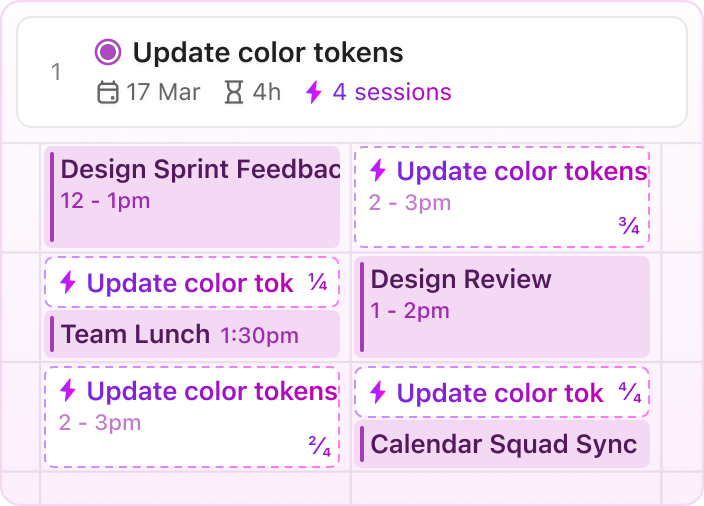
That’s the problem ClickUp’s AI-powered Calendar solves. It’s more than a place to drop tasks and hope for the best—it’s a fully integrated project scheduler that lets you see your priorities, meetings, and team timelines all in one view.
🧠 Fun Fact: Choose from Day, 4‑Day, Week, Month, or a tailored timescale view in ClickUp Calendar. Infinite horizontal scrolling ensures you never run out of viewable timeline .
Unlike Google Calendar, which doesn’t natively support Gantt-style scheduling or dependencies, ClickUp gives you drag-and-drop rescheduling, AI-powered task blocking, and live syncing with Google and Outlook calendars. Built-in features also include time tracking, work-hour visibility, and collaborative location/timezone settings!
Here’s all you can do with it:
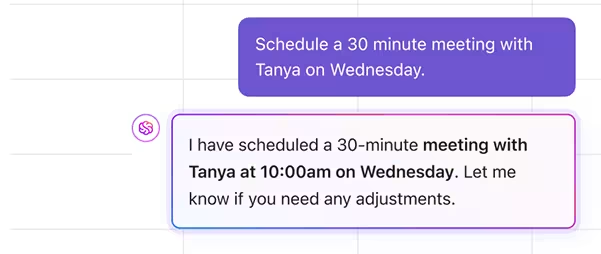
With ClickUp Calendar, your meetings, task progress, dependencies, and even transcripts from Zoom calls all live in one smart, flexible calendar that actually adapts to how your team works.
So instead of stitching together Google Calendar, a Gantt tool, and a separate meeting tracker, you can do it all in ClickUp—with context and collaboration built in. 🪄
👥 How teams are using it:
💡Pro Tip: Use tags and filters in the ClickUp Calendar View to create custom views for different departments or project phases—perfect for marketing campaigns, product sprints, or launch roadmaps.
One thing is clear: Google Calendar isn’t built to manage complex projects. You need a smarter tool designed for dynamic projects, distributed teams, and cross-functional stakeholders.
Here’s what ClickUp gives you instead:
Creating calendars from scratch, manually adjusting each event, and color-coding them individually may be doable, but it’s far from a productivity hack. The moment your project gets bigger or your team gets involved, those workarounds start to crumble.
Leave Gantt charts for project time management to the experts—ClickUp! Not only does it let you build dynamic timelines effortlessly, but it also acts as a powerful, free Gantt chart software solution built for real-time collaboration.
The best part? It can replace (or sync with) Google Calendar as your scheduling and time-blocking tool, so you won’t have to constantly switch tabs between your tasks and meetings.
With dynamic Gantt charts, real-time updates, built-in dependencies, and full calendar functionality, you get a complete project management solution instead of a complicated and temporary fix.
Build your Gantt chart—without the hassle. Sign up for ClickUp today!

© 2026 ClickUp

There’s an easier way. Try a free AI Agent in ClickUp that actually does the work for you—set up in minutes, save hours every week.