


Still downloading templates?
There’s an easier way. Try a free AI Agent in ClickUp that actually does the work for you—set up in minutes, save hours every week.
Sorry, there were no results found for “”
Sorry, there were no results found for “”
Sorry, there were no results found for “”
Whether you’re part of a small or big team, engineering inefficiencies frustrate the whole squad, hurt client relationships, and lead to financial loss. They waste valuable resources, causing your projects to fall short of expectations and timelines.
On that note, let us explore a concept that saves engineering teams from tricky situations—engineering efficiency. We’ll discuss everything from what it is to how to implement it effectively.
Engineering efficiency refers to achieving desired results or outcomes with minimal waste of resources such as time, materials, energy, or workforce. The closer your output is to the planned outcome, the higher your engineering efficiency. This is useful when managing engineers and involves optimizing processes, designs, and methodologies to maximize output while minimizing input.
The goal is to improve productivity and reduce costs.
Engineering efficiency ensures:
Engineering efficiency is particularly crucial for projects in the following areas:
You might come across another closely related term regarding engineering efficiency—Systems Development Life Cycle (SDLC).
SDLC is a structured approach explicitly used in software engineering and information systems development. You have a series of phases that ensure the efficient and effective development of software or information systems while meeting the needs of stakeholders.
The typical phases of the SDLC include:
The concept promotes a cyclical approach to project development, offering ample evaluation and iteration opportunities. If executed correctly, the SDLC will improve engineering efficiency by optimizing resource utilization, streamlining processes, and managing risk.
You can continuously improve without breaking your workflow by adopting agile software development, which brings us to the next topic.
Agile software development is an iterative approach that prioritizes flexibility, collaboration, and delivering consistent customer value through incremental improvements and rapid iterations.
Engineering leaders who use it focus on three things:
Engineering teams that adopt agile methodologies can respond quickly to changing requirements and market demands.
According to Harvard Business Review, companies that adopt agile methodologies experience a 60% growth in revenue, indicating this approach’s effectiveness in increasing efficiency.
Efficiency metrics are standardized quantifiable measures that help gauge the success rate of your efforts for efficiency in engineering.
They provide insights into project cost, time, resource allocation and utilization, performance, and quality, helping you take strategic, measured steps to improve them.
Here are more details on these valuable metrics to help you improve engineering efficiency.
Cycle time is the duration required to complete a specific task or process (from start to finish) and is usually tracked using timestamps or time-tracking software.
Formula to measure cycle time: Cycle time = total time/number of cycles
For example, suppose a software team completes 10 features over 20 working days. In this case, the total time would be 20 working days, and the number of cycles would be 10.
Cycle time = 20 working days / 10 features = 2 working days per feature.
Reduced cycle times mean enhanced productivity, throughput, and minimized delays, while long cycle times point towards inefficiencies.
Coding time measures the duration software engineers spend writing or modifying code. Track it using time-tracking tools, project management tools for software engineers, or version control systems. The metric is essential for meeting deadlines, identifying bottlenecks promptly, and scheduling resources effectively.
Long coding time means your developers take too long to write code, indicating there is scope to optimize processes.
Downtime measures the unit of time for which equipment or production processes are non-operational due to maintenance, breakdowns, or other factors. Track it with downtime logs or equipment monitoring systems and use the downtime to identify recurring problems and find permanent solutions.
A high downtime suggests frequent interruptions or process failures, while a low downtime points towards reliable processes.
Pickup or response time measures the time to respond to and address incoming requests or tasks, such as customer inquiries or support tickets.
Track this metric through standard ticketing systems like SupportBee or Help Scout.
A short pickup time means your issue resolution process is efficient, while a long pickup time indicates you need to speed up customer service.
Review time is the time taken to evaluate tasks or deliverables. It can be tracked using process mapping tools or manually tracking feedback cycles.
Unlike downtime, deployment time is an efficiency metric specific to software updates—critical in process analysis for software engineering.
Also called implementation time or deploy lead time, deployment time measures the time taken from initiating a feature request or task until its release into testing or a production environment.
A low deployment time means faster release cycles, quicker delivery of new features or fixes to end-users, and overall agility in software development. A high deployment time indicates complications in the deployment process and a need to improve engineer efficiency. Optimizing this metric can accelerate time to market.
Deploy frequency refers to how often you deploy software updates or changes within a specific timeframe. You can track it using deployment logs or release calendars.
This metric is most important for teams operating in hyper-competitive environments like SaaS, e-commerce, and finance. A high deployment frequency indicates you can provide value to users faster, while a lower frequency means it’s taking you longer to improve your product.
First-time fix rate evaluates the percentage of equipment or system issues resolved successfully on the first attempt.
Formula to measure first-time fix rate: First-time fix rate = (Number of incidents resolved on the first attempt /total number of incidents) x 100
For example, let’s say your technical support team receives 100 support tickets in a month, and out of those, they successfully resolve 80 tickets without needing further assistance or callbacks.
The first-time fix rate would be FTFR = (80 / 100) x 100 = 80%.
A low FTFR indicates inefficiencies in the issue resolution process, which may lead to customer dissatisfaction. A high FTFR means your customer support or maintenance team is highly efficient at diagnosing and resolving issues at the first contact.
Ideally, you would want all machines/code to be flawless and never break down. However, mistakes happen during the assembly process or software development cycle.
In software development, the rework ratio is the percentage of code changes in which an engineer rewrites recently updated code (less than 30 days old).
While some rework is a natural part of the software development process (this number varies based on contributor experience and work), a high rework ratio indicates unclear specifications, changing product requirements, and a lack of codebase familiarity.
Resource planning is an integral KPI for engineering efficiency since it helps project managers measure performance and effort over a specific amount of time.
This insight allows project managers to foresee the resources available across multiple categories so they can plan their workforce schedules to ensure the optimal health of projects.
The formula to calculate resource utilization is: Total billable hours/ Total available working hours x 100
WIP is any task that was started but not completed. Organizations need to lower the WIP stage because the longer a task or item remains in the work-in-progress stage, the less efficient the team and the company are.
In agile product development, setting WIP limits allows you to identify inefficiencies and bottlenecks, clear the pipeline to avoid multitasking, meet customer requirements with regular updates, and maintain the ideal pace between idleness and overwork.
How do you determine your WIP balance?
First, remember that WIP balance is interchangeable, and if you’re doing it for the first time, there’s a good chance you’ll make mistakes.
Consider two things to start with:
The WIP balance will fall in the range of:
For a team of 15 people, your WIP limit should be between 16 (15+1) and 30 tasks (15×2).
However, remember to iterate the WIP limits until they work best for your team.
If you’re a project manager or a part of a fast-moving software development team, this question would sound familiar: How long will that take you?
A recent survey found that the average planning accuracy for over 2,000 teams was below 50%.
Planning accuracy is defined as the number of products, product backlog, or iterations your team can ship within a specific time.
This estimate will be based on the scope and complexity of the project, resource availability, the team’s experience, and access to relevant resources.
Use project management tools ClickUp to measure planning accuracy for developer productivity. This will enable you to understand your team’s capabilities and how much work you can handle in the future.
The first step to measuring engineering efficiency is mapping out your processes. Your overall engineering efficiency is the aggregate of individual processes’ efficiency, so it’s essential to have a clear picture of them.
To map out a process, list the steps and arrange them chronologically (or logically).
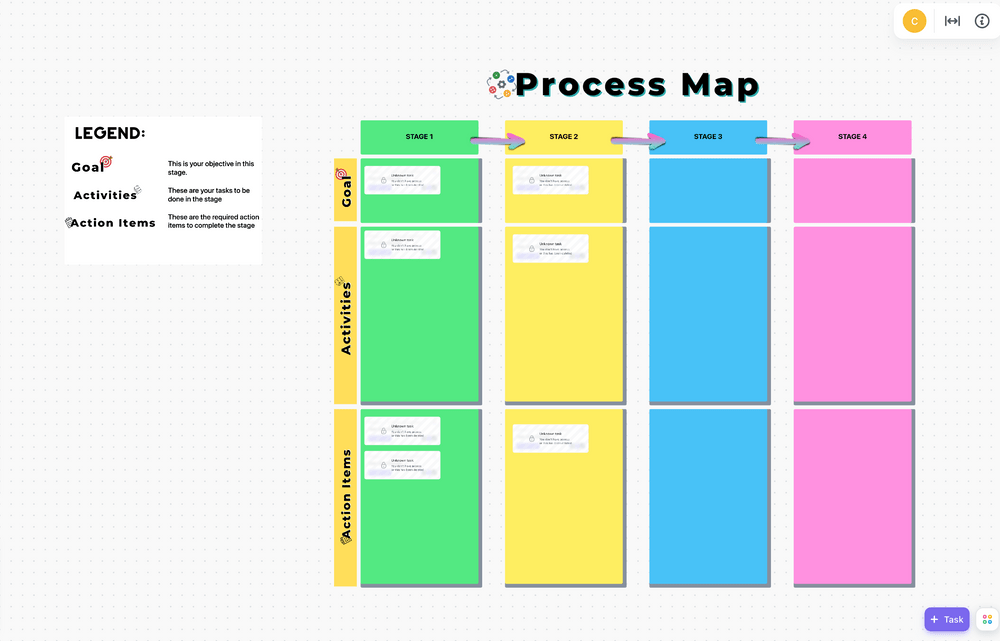
You might also want to use a visual aid like the ClickUp Process Map Whiteboard Template to make things easier:
The template lets you determine each process stage’s goal, activities, and action items and understand dependencies. Why not use a piece of paper to map out processes? This template offers several benefits:
The next step is data collection. Once you’ve mapped out your processes, you want to collect relevant data for each stage to calculate the metrics. There are three main categories of data to collect:
The most important category here is time, which helps calculate most of our efficiency metrics. ClickUp offers a free Chrome extension that tracks time from desktops, mobiles, and web browsers.
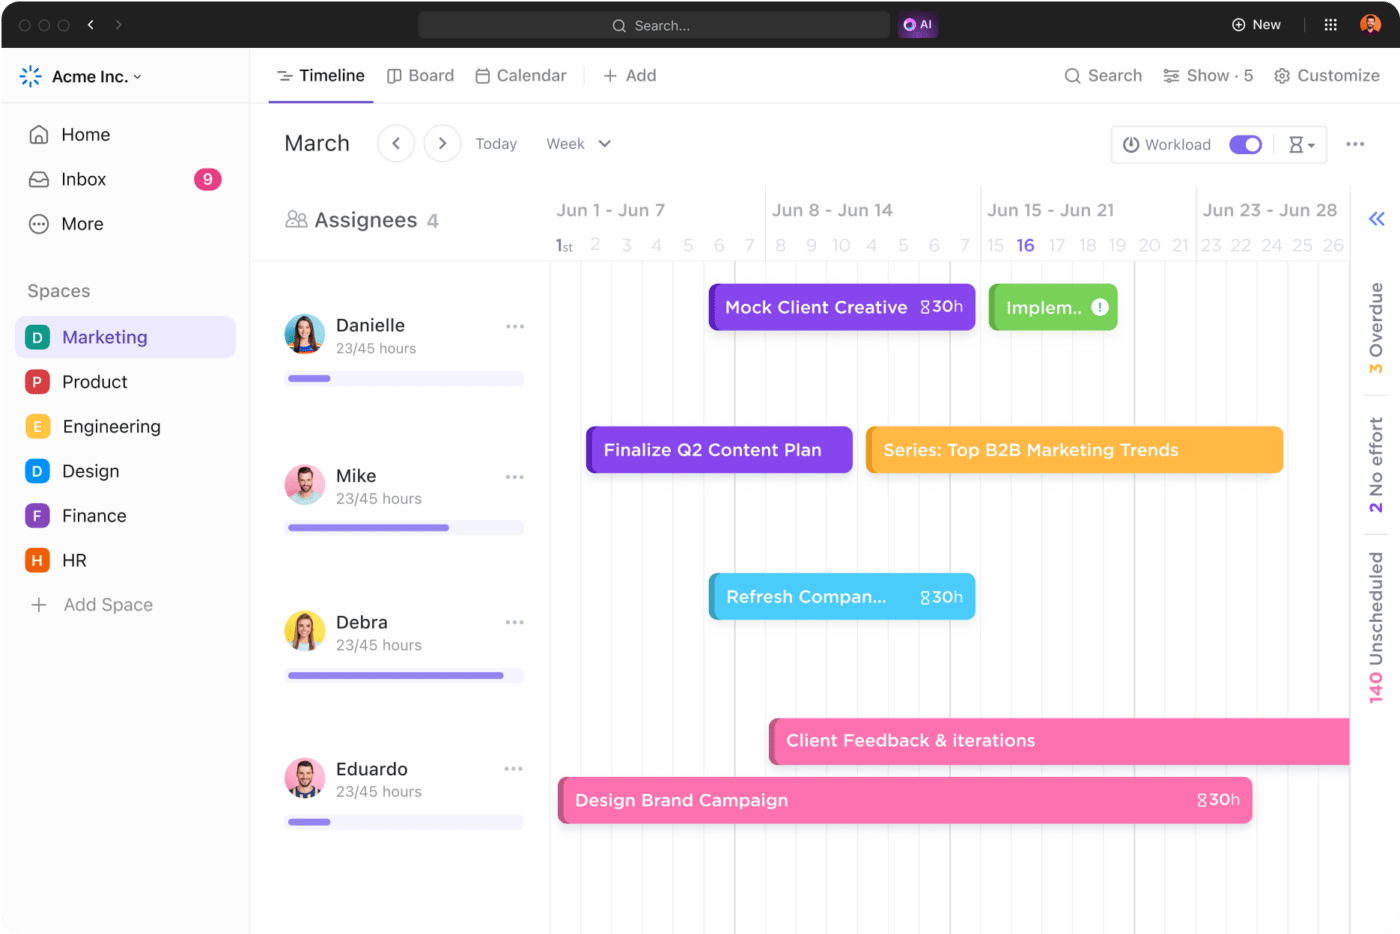
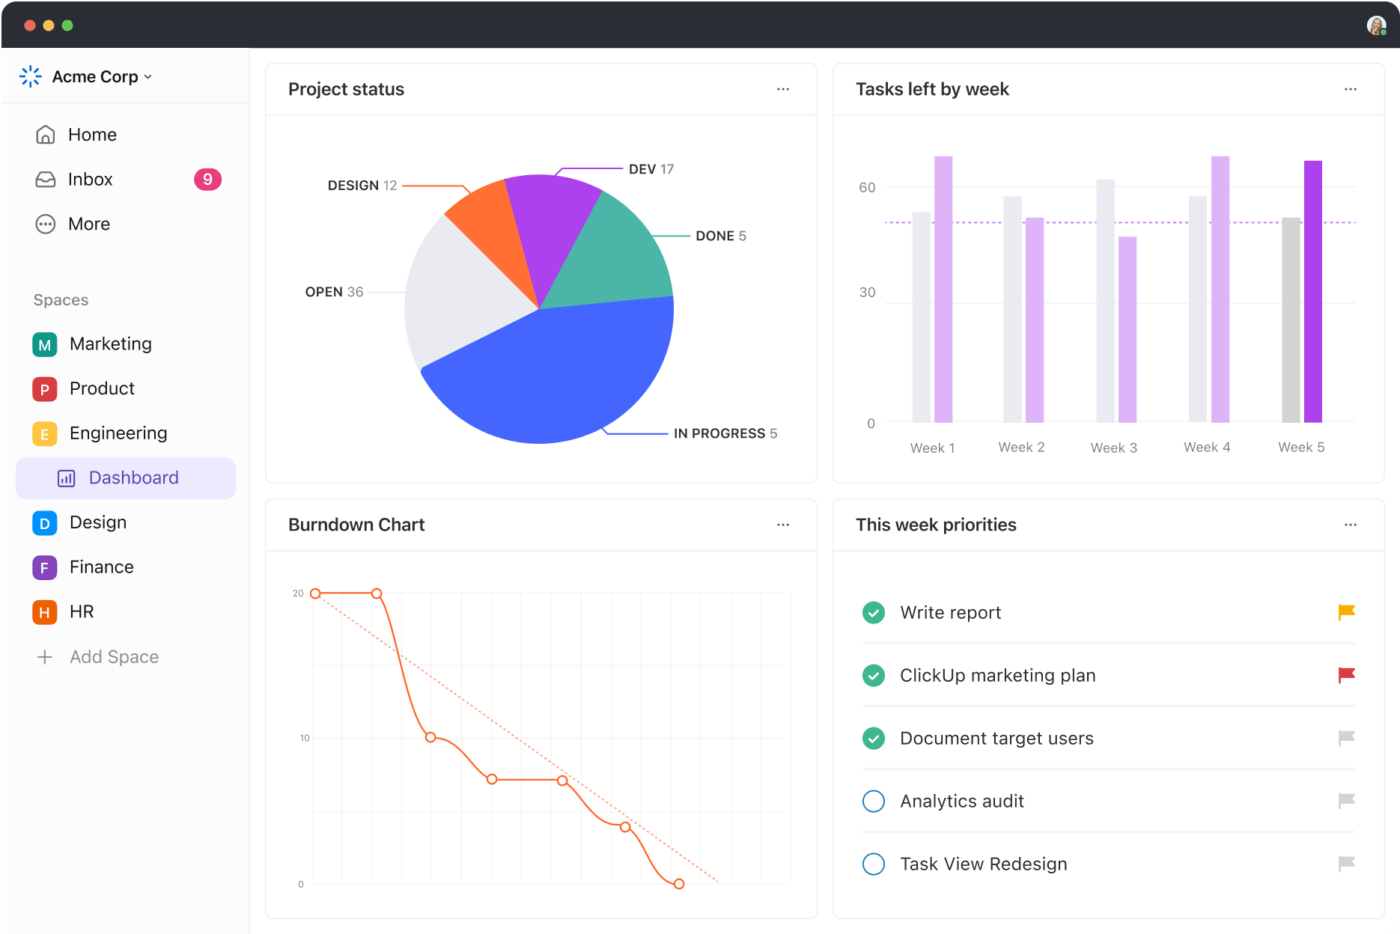
Link this time to any tasks your team is working on in ClickUp, then use ClickUp Dashboard to determine how long each process takes.
Here’s how the time-tracking dashboard looks:
The final step is calculating engineering efficiency metrics for data-driven insights. The ClickUp KPI Template is a real lifesaver here. The template lets you create custom metrics to track and set goals and track progress to see how you’re doing against them.
Here are some common mistakes in measuring engineering efficiency that should be avoided:
One of the easiest ways to avoid these mistakes is to use ClickUp for Software Teams. Here’s why:
Other considerations to avoid engineering efficiency mistakes include:
Here are four best practices you can implement to improve overall efficiency and output as an engineering leader.
Both managers and developers should prioritize tasks and projects based on their potential return on investment (ROI) for the organization.
Assess the value and impact of each engineering effort and allocate resources strategically to maximize overall efficiency and outcomes. Avoid investing time in overly-complicated new features or the latest trends if they do not bring a high ROI.
Such a mindset also helps teams find the right balance between building new features and reducing tech debt.

Identify repetitive and tedious tasks and workflows, then select appropriate tools or develop custom automation scripts to streamline processes.
Various tools increase engineering process efficiency by identifying areas for automation. For example, Ansible automates cloud provisioning and application deployment, while Travis CI helps run automated tests. If you are using ClickUp for your project management processes, it also lets you automate repetitive tasks and trigger-based workflows.
Help your engineers adopt modular design principles and strive for code simplicity and reusability. Focus on breaking down projects into smaller, self-contained modules, functions, or classes and minimize code duplication by consolidating common functionalities into reusable components.
It’s also a good idea to teach your team to leverage existing libraries, frameworks, and design patterns whenever possible to avoid reinventing the wheel, improve developer productivity, and deliver better code quality promptly.
Choose a comprehensive solution that offers all the tools you need to plan and develop your product in one place.
For example, ClickUp’s product management solution offers everything you need to plan and execute your project in one intuitive platform:

Engineering efficiency measures your ability to achieve your goals without wasting resources. Several efficiency metrics help you determine your engineering processes’ efficiency, such as cycle time, deployment time, and coding time.
When calculating these metrics, you should map out your processes, collect data around each, and build reports using ClickUp.
Use ClickUp’s pre-built templates to organize and track important efficiency metrics to see how well you’re doing. Don’t forget to read up on the common mistakes teams make when determining efficiency so your analysis is valid, helpful, and actionable.
Interested in seeing how a platform like ClickUp can help you improve engineering efficiency?
Sign up today for a free trial.
Engineering efficiency refers to the ability to achieve maximum output with minimum resources, all the while maintaining quality standards. You optimize workflows and use resources efficiently to enhance productivity, reduce waste, and improve engineering prowess.
You measure engineering efficiency using various quantitative and qualitative metrics. These include metrics such as:
Engineering effectiveness means achieving desired outcomes or objectives in engineering tasks and projects. The goal is to meet or exceed performance targets.

© 2026 ClickUp

There’s an easier way. Try a free AI Agent in ClickUp that actually does the work for you—set up in minutes, save hours every week.