Sorry, there were no results found for “”
Sorry, there were no results found for “”
Sorry, there were no results found for “”
About 80% of businesses use CRM software for sales reporting and process automation.
But here is the thing: just having a CRM doesn’t mean you are using it to its full potential. If you are only logging calls and updating deal stages, you are missing out.
CRM reporting can actually show you the story behind your numbers, what’s moving, what’s stuck, and what needs fixing. Whether you are a sales manager trying to spot trends or a rep wanting to hit your targets, good reporting can make your life easier.
In this article, we will walk through what CRM reporting is, why it’s useful, and how to do it without getting overwhelmed.
CRM reporting is the process of using data from your CRM to track sales activities, monitor team performance, and understand your pipeline. It helps you see what’s working, what’s not, and where you need to focus in your CRM workflow.
A good CRM report typically includes key metrics such as deal stages, win/loss rates, revenue forecasts, call logs, and follow-ups. You can filter by rep, time period, and lead source to spot patterns or gaps. Some reports give a big-picture view of the whole team as well as individual performances, while others can give you insights into your sales effectiveness.
In short, CRM reporting makes it easier to stay on top of your sales game without digging through a mess of spreadsheets.
👀 Did You Know? Over 45% of analysts’ time is spent prepping or cleaning data instead of analyzing it.
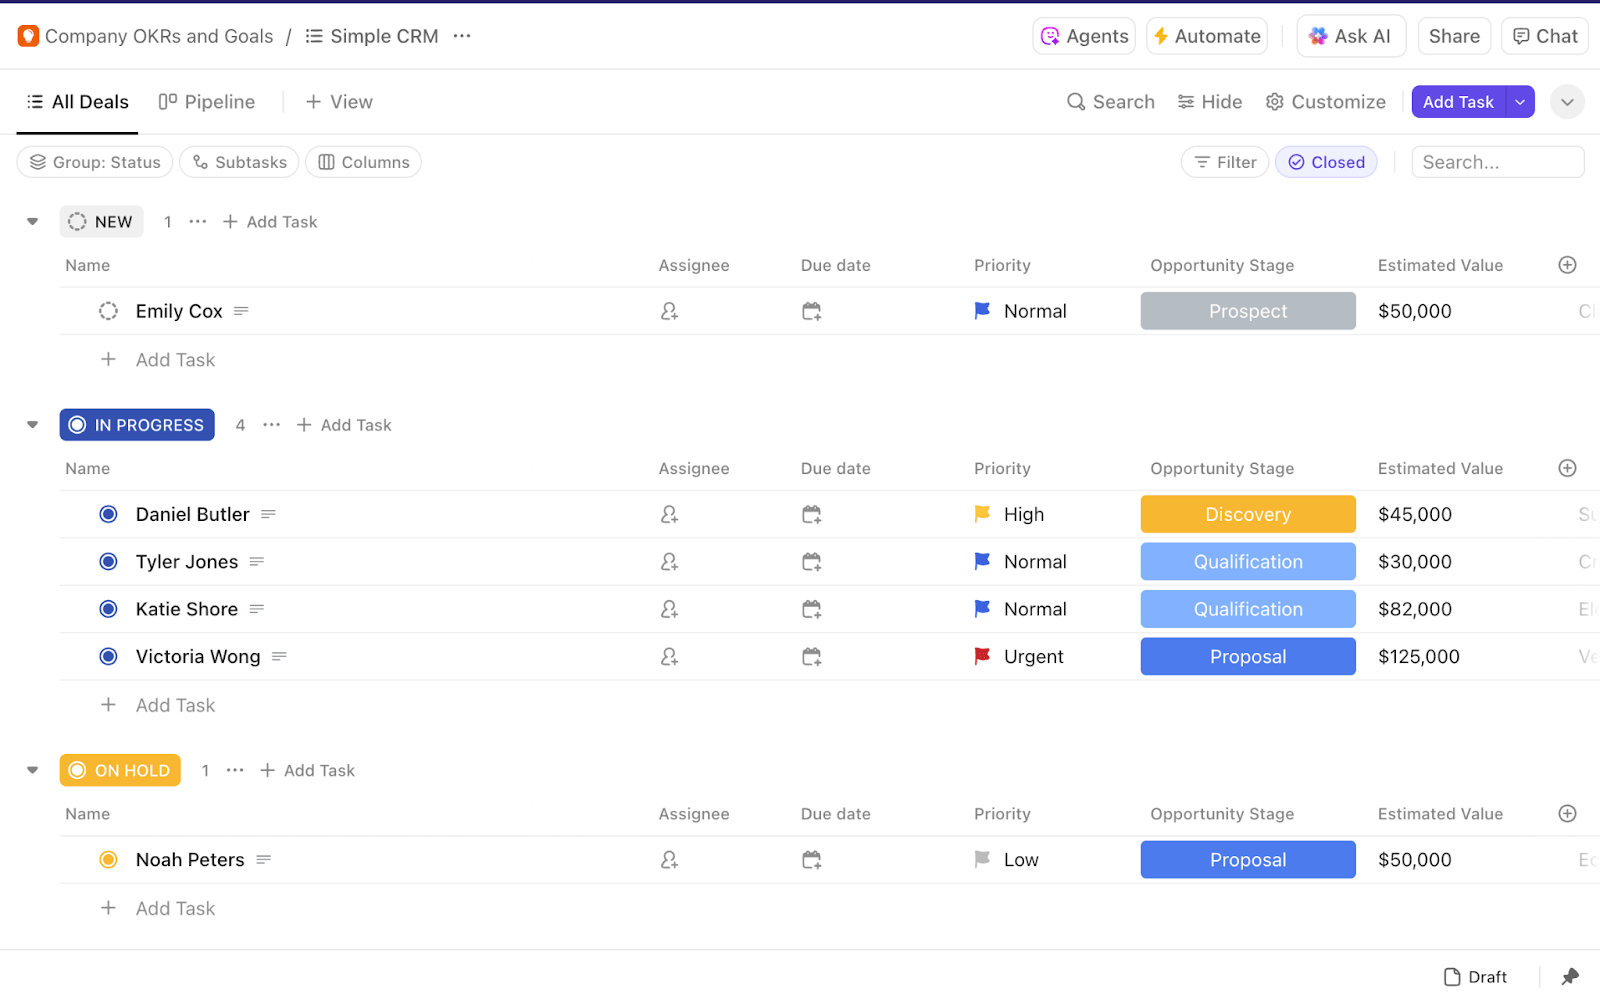
The ClickUp Simple CRM Template is an easy-to-use solution designed for small businesses and startups to manage customer relationships without the complexity of traditional CRM tools. With customizable fields for contact details, deal stages, and priorities, this template centralizes all your customer data in one place.
Perfect for teams that want a streamlined, flexible CRM system, ClickUp’s Simple CRM Template helps you stay organized, improve customer interactions, and grow your business—all within the ClickUp platform.
Before we get into the details, let’s discuss why CRM reporting should be one of your priorities.
CRM reports give you a clear picture of your sales process, what’s moving, what’s stuck, and who’s closing deals. Instead of guessing, you know exactly where things stand.
You can see how leads flow through your pipeline and where most drop off. It’s a simple way to turn raw data into helpful insights about your sales funnel.
Is a deal sitting too long in one stage? Are follow-ups getting missed? Reporting helps you spot issues before they turn into bigger problems.
It’s easier to fix a slow week than a bad quarter. Early signals give you the chance to step in, coach, or adjust before things go off track.
With shared custom reports, your whole team sees the same numbers. There is no confusion, no surprises—just clear, up-to-date information everyone can act on. This helps managers run better check-ins, and reps know exactly what’s expected. No more back-and-forth emails or digging through old notes.
Are you on track to hit monthly targets? Reports can show progress in real time, so you are not scrambling at the end of the quarter. You can break goals down by rep, region, or product to see what’s contributing most to your overall business performance. It turns big goals into manageable checkpoints.
Instead of relying on gut feelings, you can use real data from project reports to decide what to do next, whether it’s adjusting your pitch, changing follow-up timing, or focusing on better leads. You spend less time debating and more time acting. And when plans don’t work, it’s easier to spot why and pivot quickly.
💡 Pro Tip: Want to track goals, leads, and reports in one place? Explore ClickUp for Sales Teams—it’s built to handle every stage of your pipeline, from prospect to close.
74% of salespeople say that CRM systems enhanced their access to customer data, while 64% noted an improvement in managing customer relationships.
But to drive such results, you must know which reports to track. Here are the key types of CRM reports every team should monitor to turn data insights into action.
Sales pipeline reports show how deals progress through each stage, helping you spot issues early and keep momentum. These reports give you a clear picture of pipeline health and where to focus. Here’s what to watch:
⏩ Instant Toolkit: Get started right away with ClickUp’s Sales Pipeline Report Template
A sales activity report tracks the daily actions your sales team takes. It tracks your team’s sales progress with key actions, such as calls, emails, and meetings, across reps or teams. See who’s staying active, who might be falling behind, and where support or coaching is needed.
⏩ Instant Toolkit: Here’s an Activity Report Template for inspiration!
Forecasting reports help you predict future sales and set realistic goals according to current data. They focus on projected revenue and deal win probability, giving your team a clear picture of what’s likely to close.
Such insights and sales forecasts enhance sales performance by enabling more effective resource allocation and high-probability deals. It helps you track key metrics like:
⏩ Instant Toolkit: Check out these free forecast templates!
Customer retention and churn reports provide valuable insights into how well you’re keeping customers and where you might be losing them. These reports analyze customer behavior to identify patterns that lead to loyalty or dropout.
Using CRM reporting tools, you can track retention rates, spot early warning signs of churn, and adjust your strategies to improve business operations. Understanding why paying customers stay or leave helps you create targeted actions that boost satisfaction and long-term growth.
⏩ Instant Toolkit: Here’s a customer retention survey template to make the process smoother!
Support ticket resolution reports give you actionable insights into how quickly your team is solving customer issues. Monitoring customer interactions, responses, and average resolution times helps you improve customer service and increase customer satisfaction.
Most CRM platforms let you create custom CRM reports to focus on what matters most to your team. You can also use third-party analytics tools for even deeper analysis. These reports help you make informed decisions and data-driven decisions that keep your support running smoothly.
⏩ Instant Toolkit: This Help Desk Ticket Template might just be what you need!
🧠 Fun Fact: A Sumerian cuneiform tablet is one of the earliest reporting documents. It was used for tracking beer rations for workers.
Tracking the right metrics can make all the difference in growing your business. In fact, data-driven companies are 23 times more likely to outperform their competitors in acquiring customers, around 19 times more likely to maintain profitability, and almost seven times more likely to keep their customers loyal.
So, here are the essential key performance indicators every business should track using CRM reporting tools to drive business growth and optimize sales strategies:
📮 ClickUp insight: 45% of workers have thought about using automation, but haven’t taken the leap. Factors like limited time, uncertainty about the best tools, and overwhelming choices can hold people back from taking the first step toward automation. ⚒️
With its easy-to-build AI agents and natural language-based commands, ClickUp makes it easy to get started with automations. From auto-assigning tasks to AI-generated project summaries, you can unlock powerful automation and even build custom AI agents in minutes—minus the learning curve.
💫 Real results: QubicaAMF cut reporting time by 40% using ClickUp’s dynamic dashboards and automated charts, transforming hours of manual work into real-time insights.
Building effective CRM reports doesn’t have to be complicated. With the right reporting tools, you can easily gather, organize, and analyze your customer data in just a few steps.
Let’s walk through a simple process to create reports that help your team make smarter decisions and drive better results.
Before diving into data, it’s important to know exactly what you want your CRM report to achieve. Are you trying to understand how much revenue your team brought in last quarter?
Or maybe you want to track the success of your lead generation efforts? Setting clear objectives helps you focus on the right data and avoid information overload.
A good practice is to make your objectives specific and measurable. For example, instead of saying “improve sales,” aim to “increase revenue from new leads by 15% in the next quarter.”
This makes it easier to track progress and adjust strategies. Use goal-tracking apps to monitor how much is actually getting done.

ClickUp Goals lets you set realistic objectives for advanced reporting and helps you stay on track as well.
For example, suppose you want to measure how much revenue your sales team generates each quarter or evaluate your lead generation efforts to gather essential insights.
Start by creating a Goal in ClickUp with that target that says, ‘Generate $500,000 in sales revenue this quarter.’ Then, you break this big goal into smaller, trackable key results like ‘Close 20 deals this month’ or ‘Schedule 50 sales calls per week.’
Now you can assign these Key Results to team members as tasks, so everyone knows what to focus on. As they complete tasks, progress updates automatically roll up into the overall Goal.
Monitor real-time progress with visual charts and sales dashboards and track progress toward related Goals by grouping them into Folders like sprint cycles, OKRs, or weekly employee scorecards. This way, your CRM reports will pull data that’s directly tied to these clearly defined objectives, helping you stay aligned and push your business forward.
👀 Did You Know? The majority of enterprise data, anywhere between 60% to 73%, goes completely unused in analysis.
Once you have set your objective, the next step is figuring out exactly what data to include in your CRM report. The goal here is to keep your report focused and relevant, since too much data can make it harder to spot what matters.
So, think about what you actually need to measure your goal. For example, if you are tracking revenue, you will want deal values, close dates, and sales rep info. If you are focused on leads, you will want the lead source, status, and follow-up activity.
Here are some best practices to help:
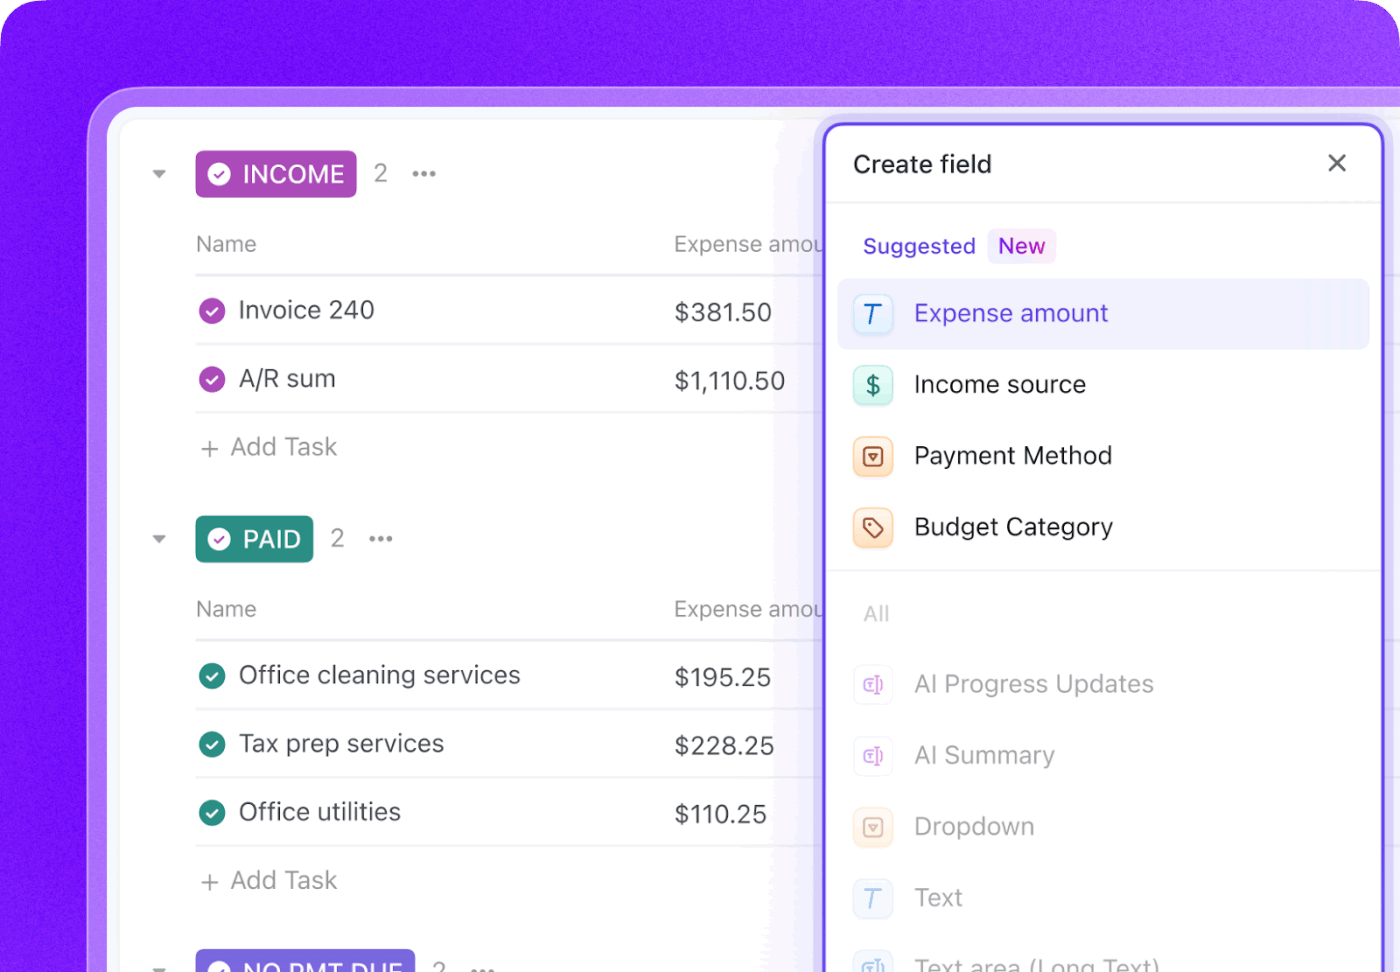
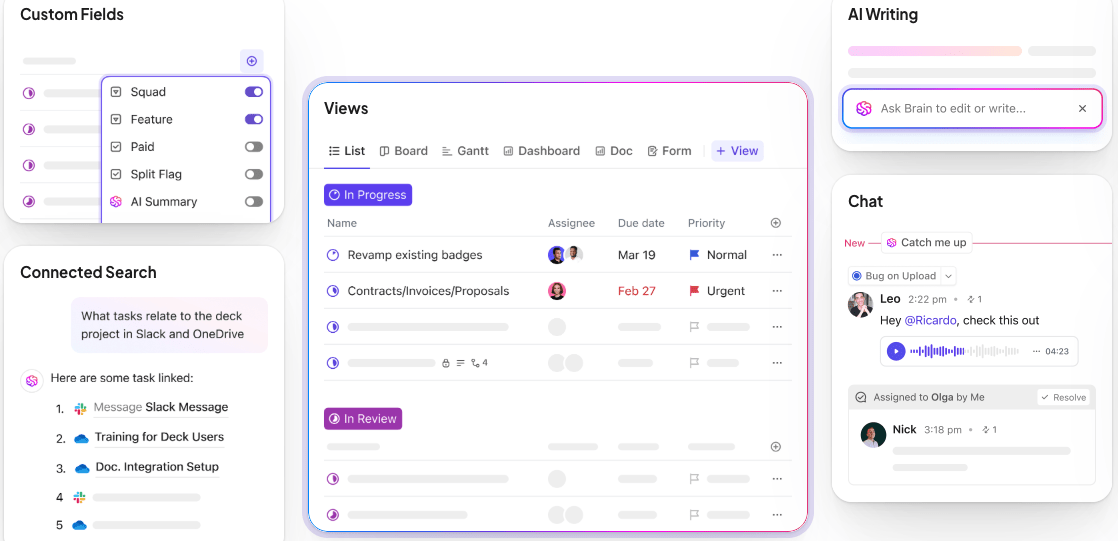
You can make this process smoother by using ClickUp Custom Fields. For instance, you can create fields like:
Once your Custom Fields are in place, use filters to narrow your view. Want to see all deals over ₹50,000 that were closed this quarter? Filter by Deal Value and Close Date. Need to focus on just one initiative from your marketing campaigns? Filter by Lead Source.
These filters help you zero in on what matters so your report stays clean, useful, and tied directly to your goal.
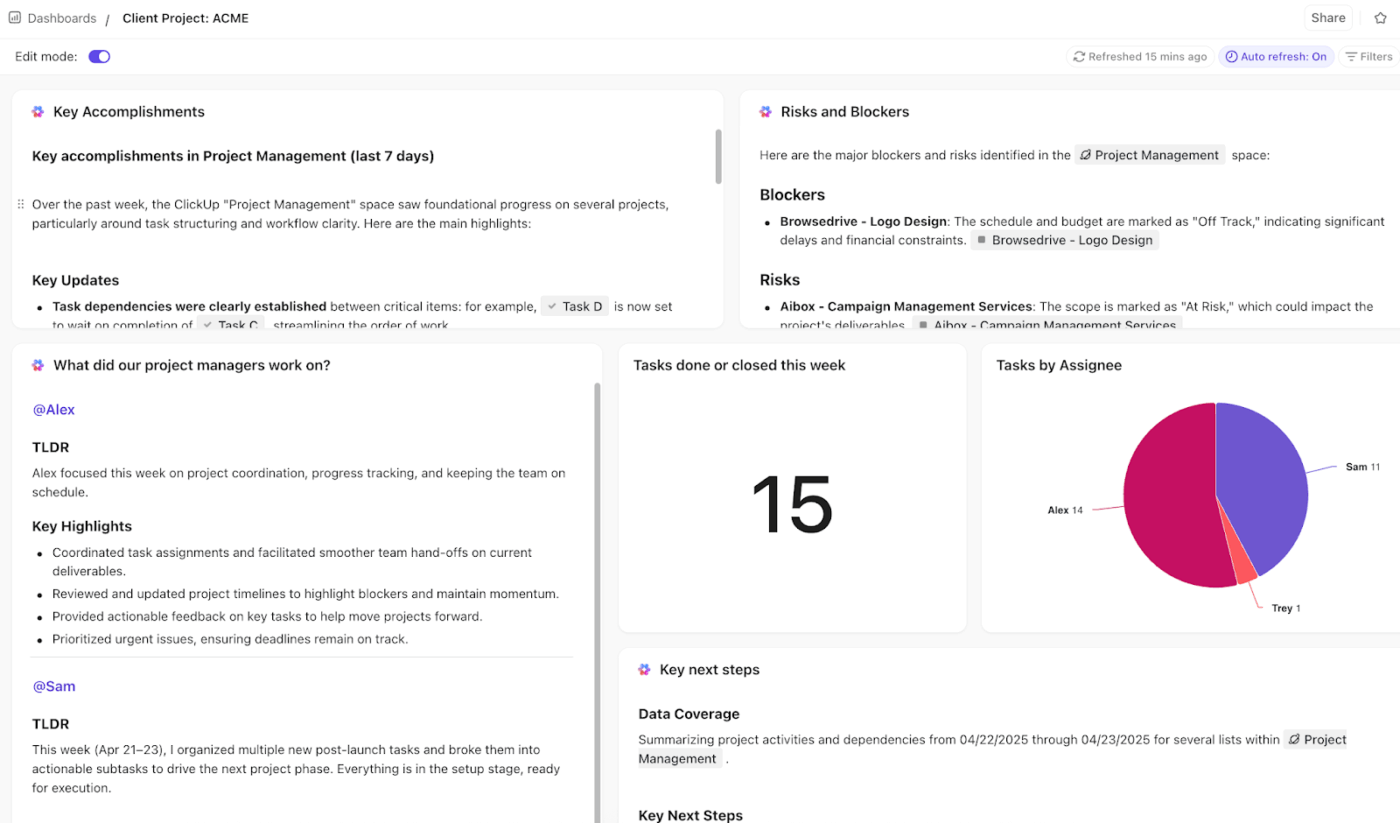
Now that you have sorted your data, the next step is deciding how to present it in a way that’s easy to understand. A well-chosen chart can highlight patterns or problems instantly, while a cluttered one can bury the insight.
The best practice is to match the chart to the message. Use visuals that make comparisons, future trends, and breakdowns easy to understand. Keep it clean, avoid unnecessary colors, and don’t cram too much into one view.

ClickUp Dashboards offers multiple visualization options to choose from, including:
📖 Also read: Project Management Dashboard Examples & Templates
Manually updating reports eats up time, increases the risk of human error, and slows down decision-making. Automating report updates ensures your team always has access to real-time insights without the repetitive grunt work. It frees up bandwidth for higher-impact tasks and helps you maintain accuracy and consistency across all your dashboards.
Here are some best practices you need to follow to automate CRM reports:
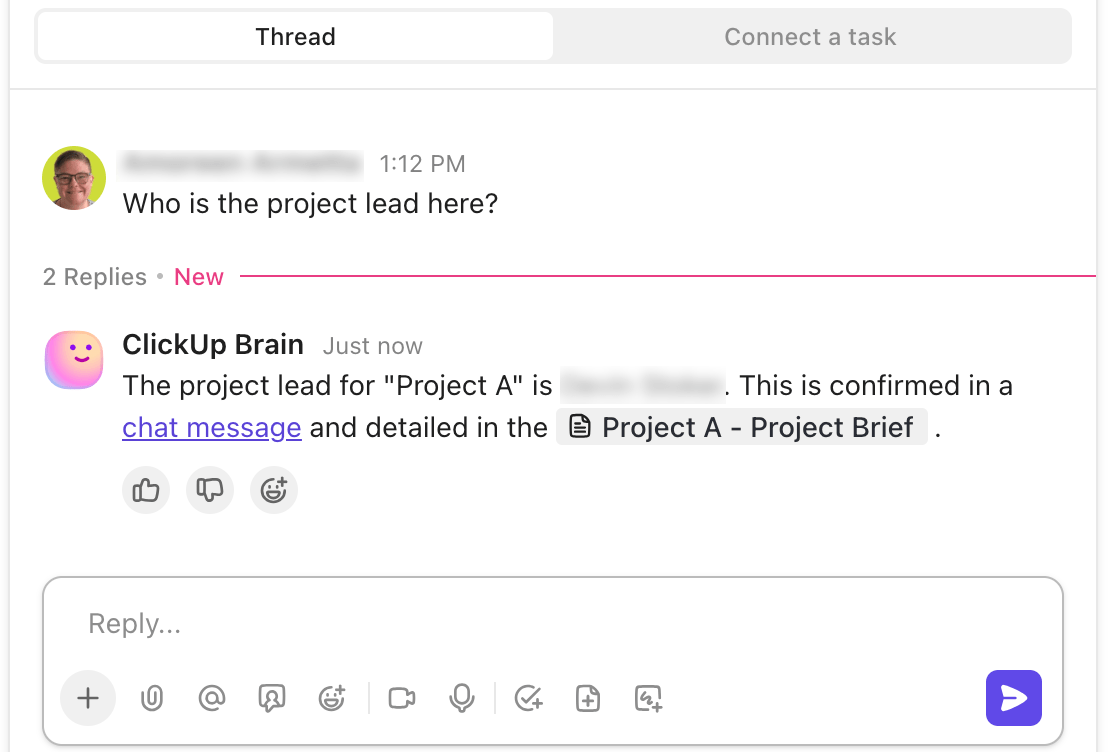
ClickUp Automations offers 100+ action triggers to make it easy to streamline reporting workflows with minimal setup. You can create custom rules using a simple “When this happens, then do that” format.
For example, you can trigger a report update and notification when a task moves to a specific stage or when a custom field changes. That way, the data gets pulled into your CRM dashboard automatically in real time.
Creating reports is only half the battle, but getting them in front of the right people at the right time is what drives action.
Sharing and scheduling reports ensures everyone stays aligned, informed, and ready to respond. Whether it’s weekly sales updates or monthly performance reviews, consistent report distribution builds transparency and momentum across your team.
Plus, when you automate sharing and scheduling, you eliminate the back-and-forth of manually sending reports. This keeps stakeholders in the loop without you having to chase updates or compile data every time.
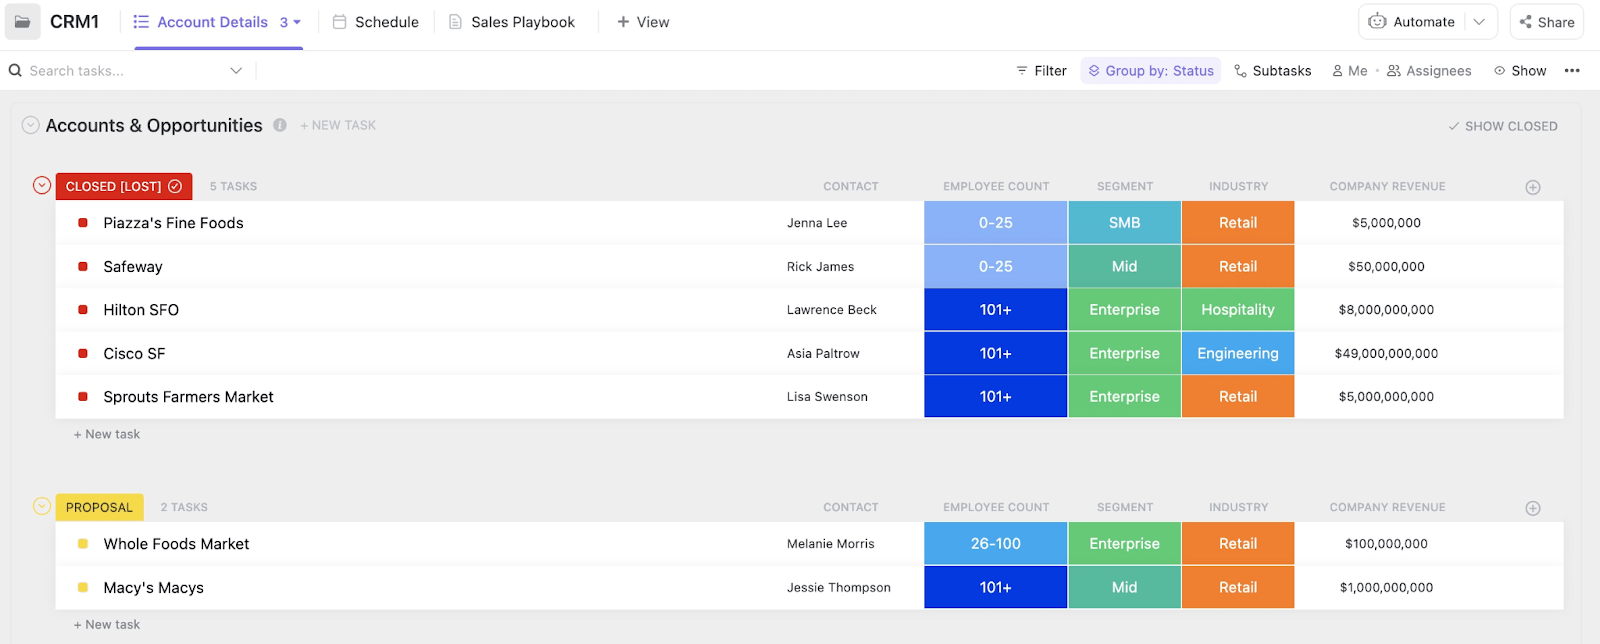
ClickUp makes report sharing simple with built-in scheduling, permissions, and customizable dashboards. If you are overwhelmed by all the CRM data and don’t know how to organize the segments, use the ClickUp CRM Template.
It includes ready-to-use dashboards, contact pipelines, and reporting views, all built for visibility and collaboration. You can schedule this report to be sent via email, link dashboards directly to updates, or automate delivery using ClickUp Automations. It’s everything you need to keep your team and stakeholders up to speed without lifting a finger each time.
Brenna Keenan, Digital Marketing Director at SSM Creative Collective, says about ClickUp CRM:
ClickUp is the best project management and CRM tool that I’ve come across. The versatility allows you to truly tackle all of your tasks in one place without numerous subscriptions to other services.
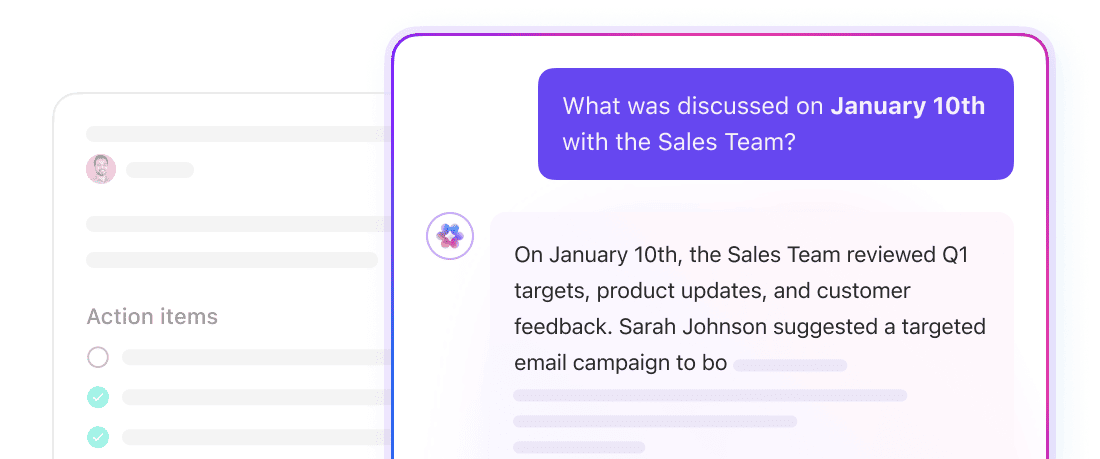
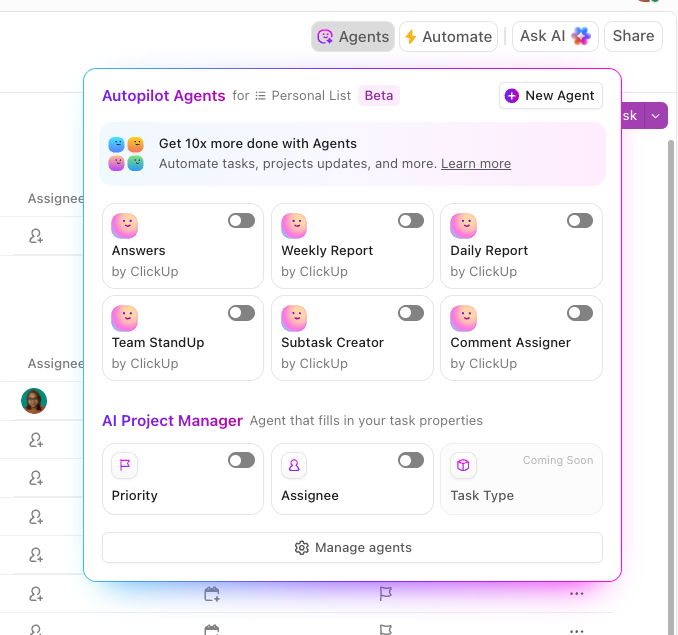
Learn how to create a simple AI agent in ClickUp to automate CRM reporting processes:
🧠 Fun Fact: Charles Minard’s flow map of Napoleon’s Russian invasion is often called the greatest statistical graphic ever drawn. It shows the army’s size shrinking in brutal detail as temperatures drop, a literal data visualization of defeat.
CRM reports are meant to help you make better decisions. But too often, they become cluttered, hard to read, or just plain ignored. Here are some common mistakes that can quietly mess up your reporting, and how to fix them:
With the right setup, clear metrics, and a few smart automations, you can turn your CRM data into a reliable source of truth for your entire team. But to really make reporting effortless, you need a tool that brings everything, data, tasks, templates, and updates, into one place.
ClickUp helps you automate report updates, schedule sharing, reduce manual work, and tailor insights for every stakeholder. From CRM templates to real-time dashboards, it gives you full control over how your data is organized and delivered.
Sign up with ClickUp for free and simplify your reporting workflow, so your team spends less time building reports and more time acting on them.

Melissa Shymko
Max 13min read

Praburam Srinivasan
Max 12min read

Sudarshan Somanathan
Max 18min read

© 2026 ClickUp