


Still downloading templates?
There’s an easier way. Try a free AI Agent in ClickUp that actually does the work for you—set up in minutes, save hours every week.
Sorry, there were no results found for “”
Sorry, there were no results found for “”
Sorry, there were no results found for “”
If you work in an agile team, you know how tough it is to get real-time visibility into project progress and team performance.
The battle against scattered information across emails, spreadsheets, and meetings is real! With frequent misalignments and rework, getting your efforts to sync with team goals can be challenging.
Agile dashboards provide a centralized and visual representation of key metrics related to the agile methodology, such as sprint burndown charts, velocity, and backlog status.
They help you quickly assess the status of ongoing tasks, identify bottlenecks, and make informed decisions. Most successful agile teams use a variety of dashboards to organize projects and stay competitive. Today, we’re distilling how you can build the best agile dashboards for your software team.
💡 Pro Tip: Don’t wait for weekly standups to find out what’s slowing your team down. An agile dashboard updates in real time, so blockers, progress, and wins are visible to everyone, anytime. It’s a total game-changer for async teams!
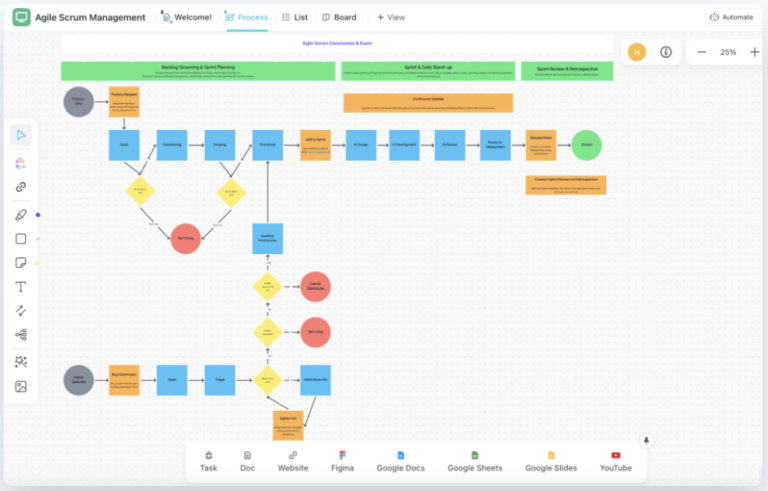
Whether you’re new to agile scrum or a long-time practitioner, ClickUp’s Agile Scrum Management Template will help you get the job done quickly and efficiently—all in one place!
Use this seven-stage guide whenever you want to build an agile dashboard with a data-driven culture:
🔍 Insight: Your dashboard is only as useful as the goals behind it. When teams skip this step, they end up tracking too much or the wrong stuff—leading to more confusion, not less. Define what success looks like before you design.
Here are some tips to manage an agile dashboard effectively:
Treat the dashboard as a team tool, not a solo project. Involve everyone in discussions, feedback, and improvement efforts.
Rotate dashboard ownership among project managers and project stakeholders periodically to foster diverse perspectives on project activities and prevent information silos.
Organize regular workshops or training sessions to explain the dashboard’s purpose, how important metrics are, and how to interpret them effectively.
Foster a data-driven culture where everyone feels comfortable using and discussing the information.
Allow team members to customize their team dashboards with the relevant information, metrics, and visualizations specific to their roles and responsibilities. This enhances ownership and engagement with the data.
Schedule dedicated time for team discussions around the dashboard.
Analyze trends, identify roadblocks, and brainstorm solutions together. Encourage open communication and diverse perspectives.
Don’t let the data sit idle. Instead, translate the learning into actionable steps.
Use the insights for sprint planning, allocating tasks, and identifying areas for improvement in your development process.
Recognize and reward team members who leverage the dashboard to make informed decisions that benefit the project. This reinforces the value of using data and encourages continued engagement.
Regularly solicit feedback from your team on the dashboard’s effectiveness. For instance, ask them what information is missing and what features need improvement. Then, use this feedback to continuously iterate and refine the dashboard to better meet your team’s needs.
Ensure data is accurate and up-to-date through automated feeds and regular refreshes.
Don’t let real-time data lag slow down informed decision-making.
Integrate the dashboard with other project management tools and data sources to create a holistic view of project health and performance.
This avoids siloed information and promotes cross-functional collaboration.
Gamify the experience! Introduce friendly competition or reward systems based on dashboard usage or data-driven achievements. This can make diving into actual and expected metrics more engaging and enjoyable.
🎯 Did You Know? Agile dashboards aren’t just reporting tools—they’re decision-making hubs. When teams engage with them regularly, sprint efficiency can improve by up to 30%. The secret? Keep the dashboard actionable, collaborative, and a little bit fun!
Managing agile projects requires a platform that adapts to your methodology, not vice versa. ClickUp is the ideal project management platform that boosts your team’s productivity with Agile dashboards.
ClickUp consolidates all Agile workflows—tasks, docs, dashboards, and communication—into one platform. This eliminates the need to juggle multiple tools, reducing manual work and “toggle tax.”
📮ClickUp Insight: Low-performing teams are 4 times more likely to juggle 15+ tools, while high-performing teams maintain efficiency by limiting their toolkit to 9 or fewer platforms. But how about using one platform?
As the everything app for work, ClickUp brings your tasks, projects, docs, wikis, chat, and calls under a single platform, complete with AI-powered workflows. Ready to work smarter? ClickUp works for every team, makes work visible, and allows you to focus on what matters while AI handles the rest.
Use ClickUp’s robust suite of tools and features to support various agile methods and processes seamlessly. Here’s how ClickUp Agile Project Management Software works:
Take control of the entire product lifecycle, from idea to release. Create product workflows that adapt to your needs, streamline handoffs between teams, and easily share everything in one place.
Use ClickUp Custom fields to capture specific data points unique to your projects, product managers, and workflows.
Save time on planning and documentation with ClickUp AI. Generate product roadmaps, create test plans, write technical specifications, and more with expert-crafted AI tools for agile teams right within ClickUp.

Here’s a sample output using ClickUp Brain 👇

Automate repetitive tasks (like status updates, notifications, or applying templates) to save time.
You can also integrate ClickUp with popular agile tools and your favorite messaging and collaboration software. Connect ClickUp with Jira software or its alternatives, or integrate GitHub and GitLab for continuous integration, seamless data flow, and unified management
Real-time collaboration: Edit tasks, leave comments, and share updates instantly, fostering team alignment and transparency
Team roles and permissions: Assign specific roles and permissions to team members based on their needs and responsibilities
Goal setting and tracking: Set clear goals for sprints and projects, track progress visually, and also celebrate achievements together through ClickUp Sprints
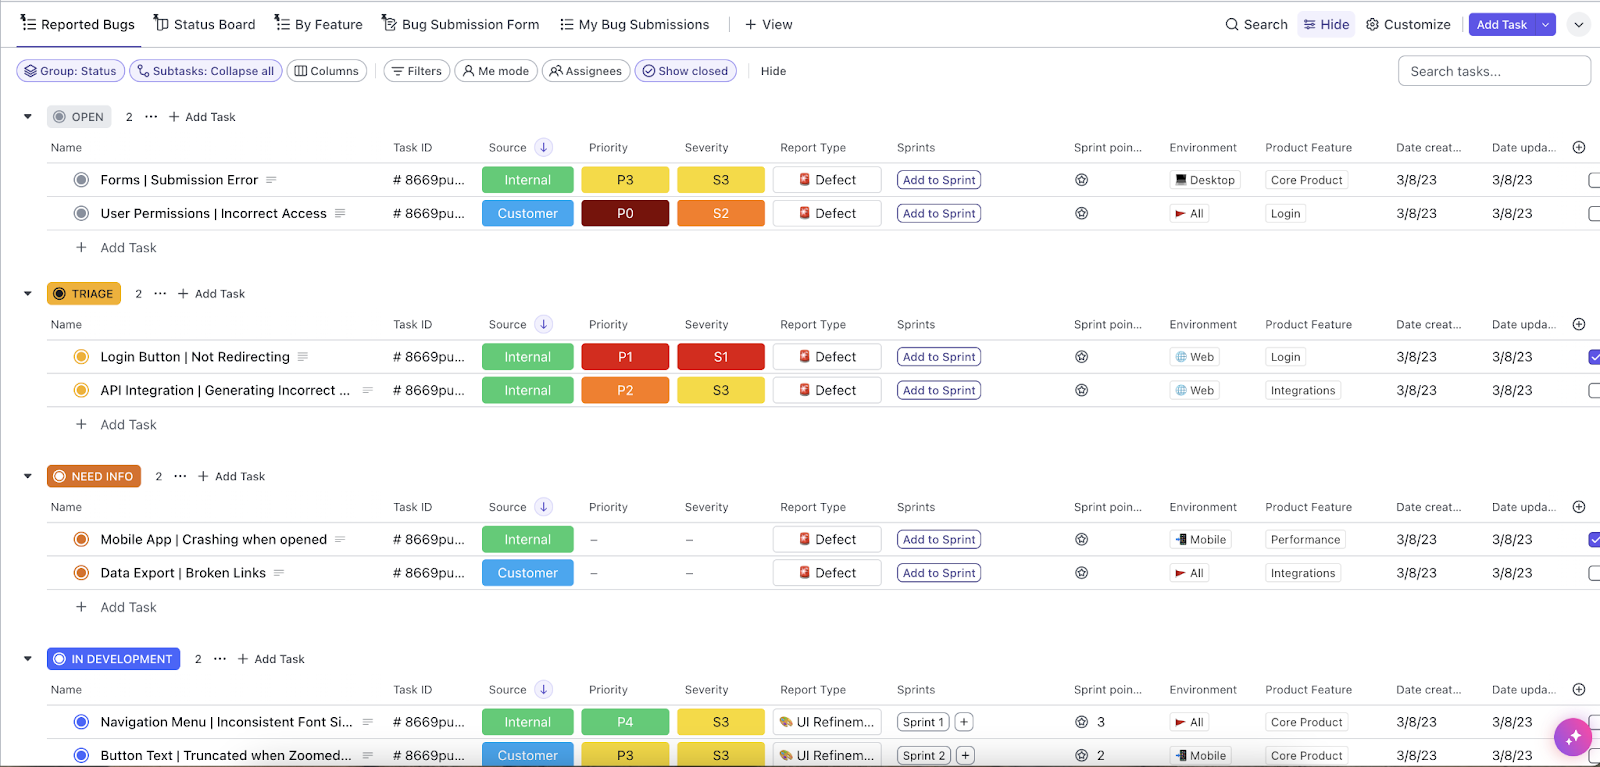
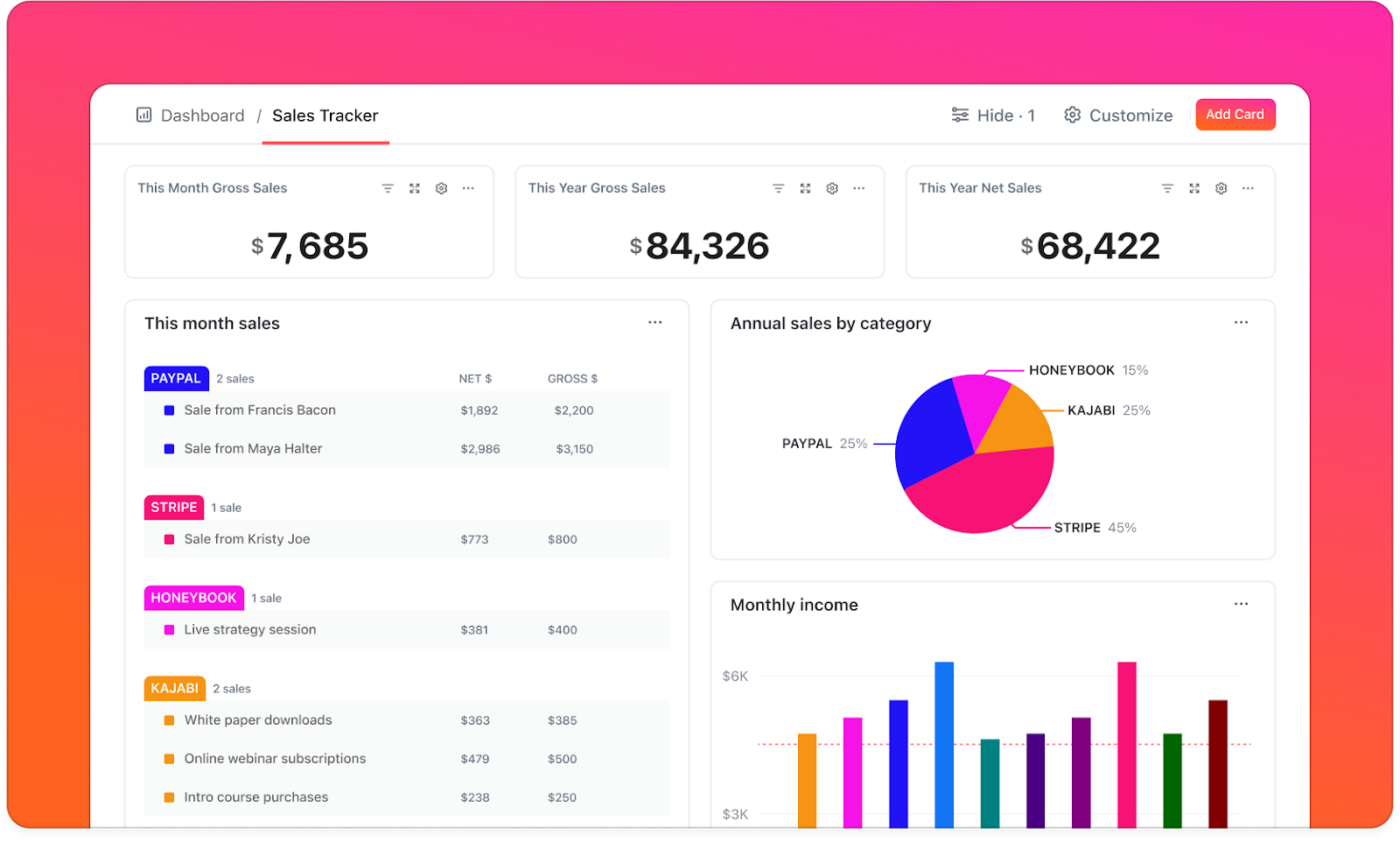
Create personalized ClickUp Dashboards with relevant metrics and data visualization elements by adding widgets to visualize task status, sprint data, team goals, etc.
Agile teams using ClickUp spend less time on admin and more time delivering value—improving morale, transparency, and speed.
Watch this video 👇 to know more about ClickUp Agile cards and dashboards, advanced sprint settings, new task types, and more.
Agile dashboards are like visual control centers for project managers and software development teams using agile methodologies. They dive deep into your software development workflow and offer a real-time granular view of key metrics, progress, high-priority issues, and potential bottlenecks in an easy-to-understand, highly visual, and actionable format.
An agile dashboard brings transparency into your project health. It allows you to make better data-driven decisions by enhancing visibility into the team’s performance and sprint progress.
You can also use agile dashboards to track key performance indicators aligned with agile principles like velocity, burn-down rate, and lead time to stay informed of your team’s progress.
Moreover, agile dashboards are pretty adaptable to specific team needs and workflows. You only need to integrate them into your existing project management tools and other data sources to access real-time updates and information.
Using a dashboard with agile templates to manage software development projects comes with handy benefits, such as:
Moreover, you can quickly and easily identify and address resource constraints, scope change, and workflow hurdles before they derail your team’s progress.
🎯 Fun Fact: One agile coach compared dashboards to airplane cockpits: “You wouldn’t fly without instruments—so why manage a sprint without one?” Dashboards give you the altitude, speed, and fuel levels of your project at a glance.
Agile dashboards can help break down the work of scrum teams in various ways. For example, velocity tracking simplifies how you monitor your team’s ability to deliver work across sprints. Similarly, the sprint goal burn-down helps visualize progress towards the current sprint and goals against the time remaining in the current sprint. And there are more such elements.
Check this breakdown of how Scrum’s key elements are typically represented in an agile dashboard, with their benefits:


Agile dashboards upgrade your productivity and performance with real-time insights and actionable data to optimize your agile journey. While you track core metrics like velocity, cycle time, lead time, and burn-down, don’t forget to customize your metrics to reflect your unique workflow or team dynamics.
In addition, the dashboards help you monitor trends in sprint health and key metrics over time and highlight areas for improvement. You can analyze sprint health and completion data to adjust future scope and resource allocation for optimal performance.
📊 Insight: Agile dashboards turn scattered project data into a single, live snapshot of your team’s progress. When built right, they shift the focus from chasing updates to solving real problems—together.
Knowing where your project stands and where you’re headed through agile dashboards clarifies your goals. Ensure you steer your project with insights, not guesswork!
You need real-time visibility to promote data-driven decision-making across teams. Agile dashboards are your mission control centers for performance metrics, bottleneck identifiers, and project-tracking devices. Anticipate challenges, optimize your workflows, and also improve processes constantly as you hit your goals faster.
Looking ahead, the future of agile dashboards looks promising. Advanced AI and machine learning capabilities will enable predictive analytics for proactive insights. In addition, integration with next-gen development tools and automation platforms will streamline data collection and analysis, reducing manual effort.
More importantly, the focus on agile approaches will shift towards personalized dashboards for individual roles and preferences. As agile methodologies evolve, so will their companions, the agile dashboards.
But remember, agile dashboards are tools and partners in your agile journey. Consistent, adequate investment in automated testing strategies by the engineering team enables agility. Try ClickUp, and watch your agile workflows reach new heights of success.
Try ClickUp for free now!
An agile dashboard uses intuitive data-visualization elements to represent key metrics and data points that provide real-time insights into agile software development projects’ progress, health, and performance.
It acts as a control center for your team, offering transparency, facilitating collaboration, and guiding data-driven decision-making.
While closely related to an agile dashboard, a Scrum dashboard provides real-time insights and data points relevant to the Scrum framework.
It is a visual aid for Scrum teams to monitor their progress within sprints, helping them stay informed, collaborate effectively, and make data-driven decisions.
A sprint dashboard is a specific type of agile dashboard designed to offer real-time insights and data points related to the progress of a particular sprint within an agile project management framework.
It acts as a visual command center for the sprint team, enabling them to monitor their progress, identify potential roadblocks, and make data-driven decisions to achieve sprint goals.

© 2026 ClickUp

There’s an easier way. Try a free AI Agent in ClickUp that actually does the work for you—set up in minutes, save hours every week.