


Still downloading templates?
There’s an easier way. Try a free AI Agent in ClickUp that actually does the work for you—set up in minutes, save hours every week.
Sorry, there were no results found for “”
Sorry, there were no results found for “”
Sorry, there were no results found for “”

Over 50% of users leave an app or tool if they don’t intuitively understand how to use it.
That means more than half of your new users may be walking away simply because they never figured out how your product fits into their life and work.
You want enthusiastic users who recognize the value of your product and make it an integral part of their workflow. This is where user activation comes in.
In this blog, we’ll explore the role of user activation as a core part of the customer journey. We’ll also understand why it’s critical to your product’s success, how to measure user activation rates, and how to increase user activation at every stage of the user lifecycle.
User activation is the moment when a new user experiences the core value of a product. It usually occurs after they complete their initial onboarding and then perform key actions that let them enjoy the benefits of the product. At that point, they transition from a new signup to someone who uses your product to solve a problem. Once this happens, the user is considered activated.
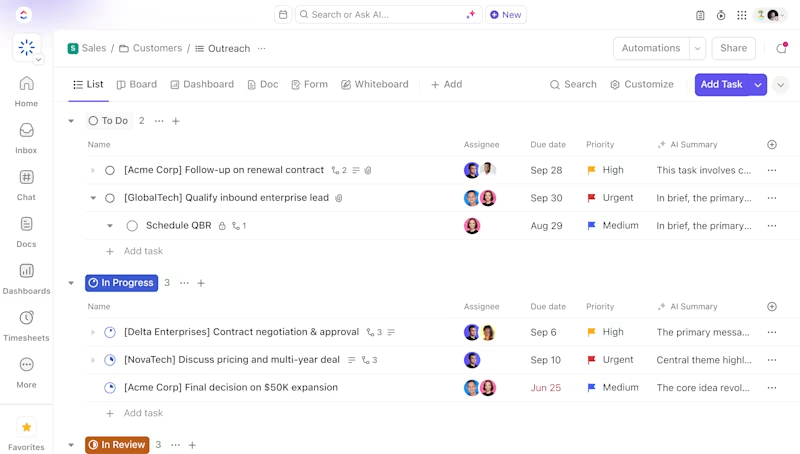
Imagine a ClickUp customer trying the tool for the first time. They build out a project, set up a dashboard, create their first Super Agent, or reach another key milestone. At some point, it just clicks, and the user realizes how the tool will redefine how they work for the foreseeable future.
User activation has now occurred. Now it’s far more likely that the user starts using ClickUp consistently, and down the line, they could even become brand ambassadors and recommend your product to others without expecting a monetary reward.
It’s important to remember that the exact milestones vary across products.
For example:
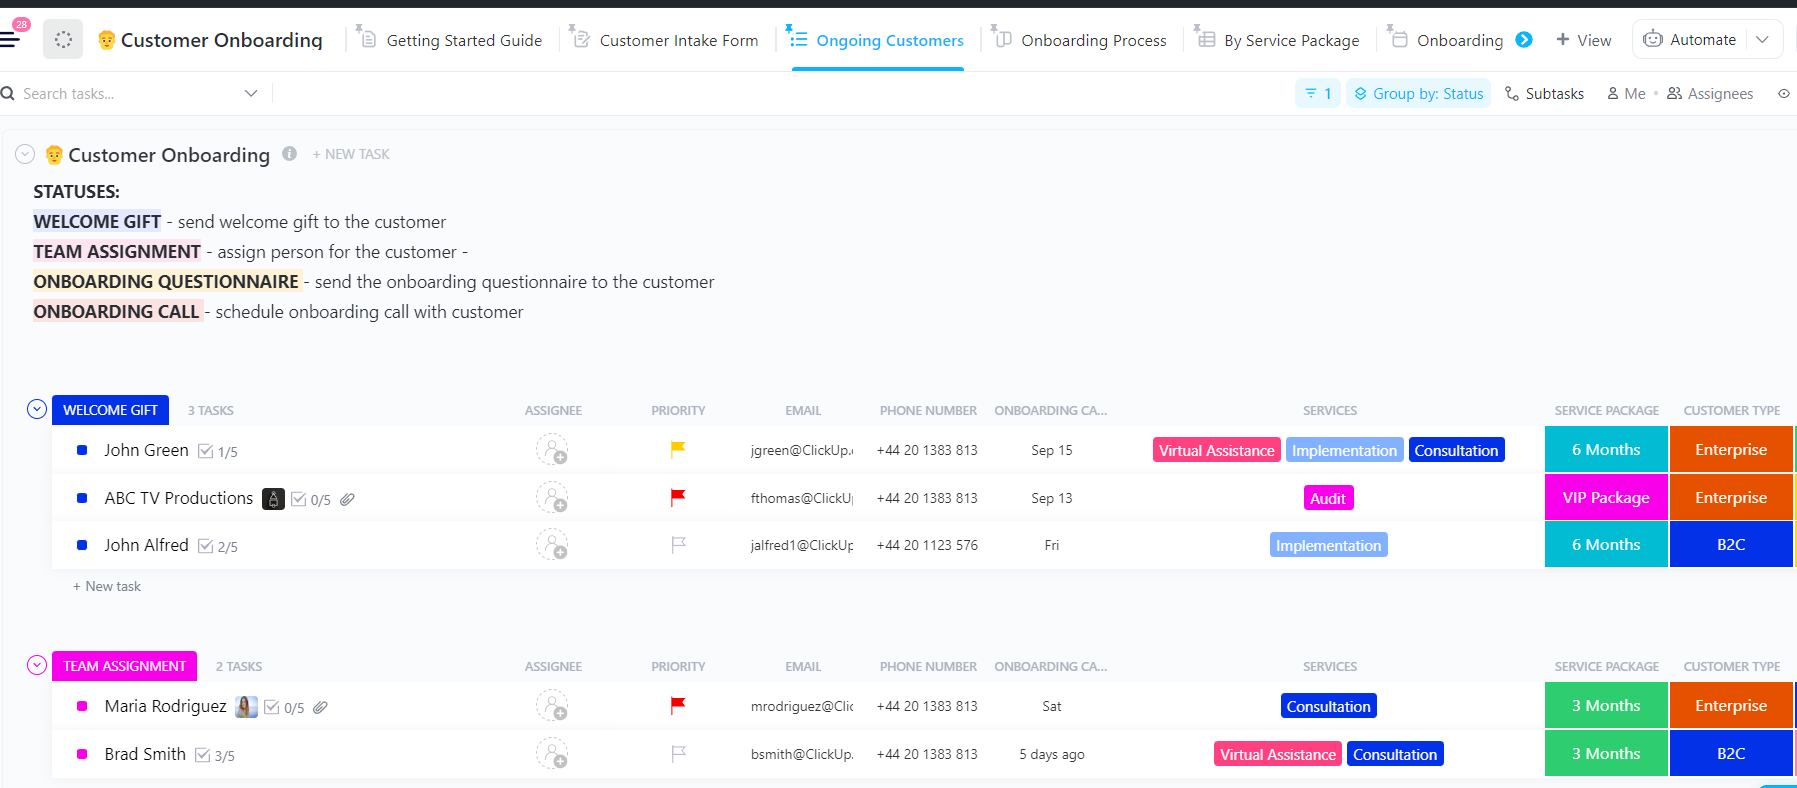
Customer onboarding is where first impressions are made, and let’s be honest, it’s also where things can easily get complicated. The ClickUp Customer Onboarding Template helps your team bring structure and warmth to every new relationship.
These two concepts are often confused, but they happen at different stages of the user journey.
While the Aha! moment captures the user’s initial realization of your product’s value, activation refers to what happens afterward.
Here’s a breakdown of user activation vs. the Aha! moment:
| Aspect | Aha! Moment | User Activation |
| Type | Emotional insight | Behavioral milestone |
| Focus | Understanding value | Experiencing value |
| Timing | Earlier (during onboarding or first impression) | Later (after key actions are taken) |
| Metric | Hard to quantify | Measurable via user actions |
| Example | ‘Wow, I can organize team conversations here!’ | Sends the first message to a teammate |
| Goal | Spark interest and motivation | Confirm usefulness and drive retention |
To identify what drives that Aha moment, you can also test out user research methods to visualize what users think, feel, and expect during early user interactions.
🧠 Fun fact: The original version of the Empathy Map was developed by the team at XPLANE as part of their ‘Gamestorming’ toolkit. It later made its way into both the Stanford school curriculum and articles in the Harvard Business Review.
This means that what now feels like a simple four-quadrant tool (Says, Thinks, Does, Feels) has its roots in creative facilitation and has been adopted academically and commercially to help teams shift from assumptions to real user empathy.
Here’s why you need user activation in the first place:
📌 Case Study: Miro’s Activation Story: According to Kate Syuma, Miro’s former Head of Growth Design, Miro split activation into three stages—Setup, Aha, and Habit—ensuring users not only signed up but also experienced core value and formed long-term habits.
Early on, an overly polished onboarding flow led to worse “invite teammates” and “start from a template” rates, proving that beauty alone isn’t enough.

During their growth phase, Miro introduced a robo-collaboration onboarding experience and later simplified it to a “Say Hi” reaction prompt. It was a low-friction step that nudged first-time collaborators into action (and boosted their Aha moment).
They combined both qualitative (user interviews) and quantitative data analysis to define activation metrics, linking activation directly to long-term retention and usage.
Every experiment followed this process: launch → learn → iterate. The team would only scale initiatives that moved the needle. They transformed customer activation and onboarding from a cost center into a growth driver.
Poor user activation doesn’t just slow growth—it quietly drains revenue, product momentum, and team capacity. When new users fail to reach their Aha! moment, every acquisition dollar becomes less effective and every retention metric slips.
Understanding the true cost of weak activation is the first step toward fixing it. That said, let’s look at what that lack of activation really costs 👇
| Category | Problem | Example and Insight |
| Wasted Customer Acquisition Cost (CAC) | Users sign up but never reach value, wasting acquisition spend | If only 20% activate, your $50 CAC becomes $250 per active user |
| Lost revenue and Lower Lifetime Value (LTV) | Inactive users don’t upgrade, renew, or spend | Poor activation can halve your LTV: CAC ratio |
| Higher churn rates | Users drop off early before experiencing value | Early churn often stems from onboarding or activation issues |
| Opportunity cost | Potential growth lost from small activation inefficiencies | A 10% activation lift can boost MRR by ~40% over 12 months |
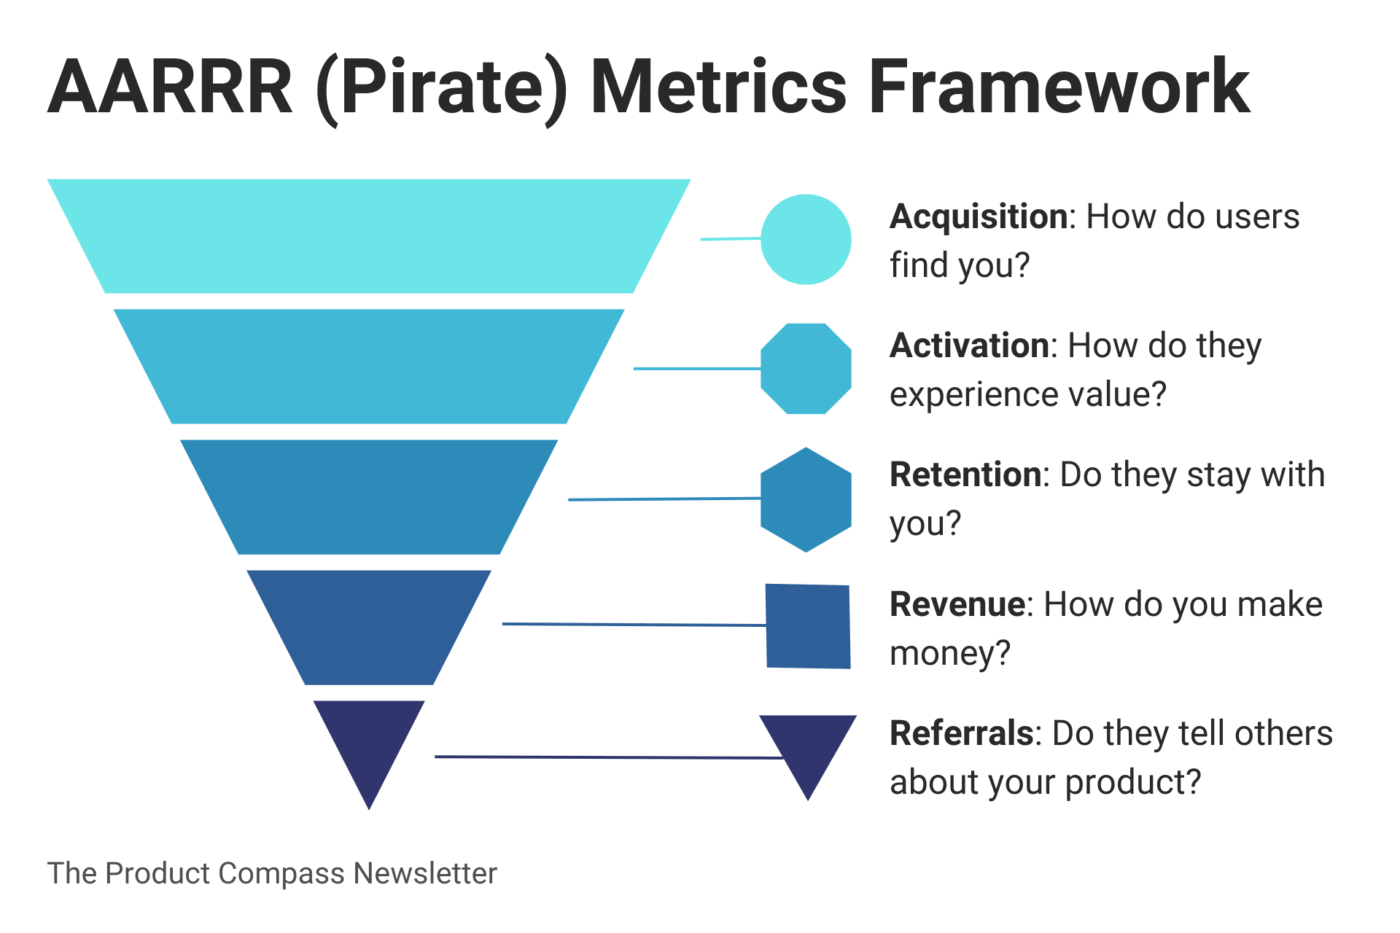
👀 Did You Know? Activation is the lever that unlocks the AARRR funnel.
As Dave McClure’s Startup Metrics for Pirates highlights, every growth metric depends on one thing: how quickly users reach their first success milestone. Activation is the moment the entire funnel either accelerates or collapses because:
In other words: activation isn’t just one stage of the funnel—it’s the engine that powers every downstream metric. When it’s weak, growth becomes unpredictable and expensive. When it’s strong, every part of the product begins to compound.
When users sign up but don’t activate, the underlying issues typically fall into one of three categories: product experience, technical or setup barriers, and engagement or motivation gaps.
📌 Figma’s early activation challenges: Even one of the world’s most successful PLG products struggled with activation in its early days, facing issues that map directly to common SaaS onboarding barriers.
Here’s what Claire Butler, Figma’s first business hire, had to say about gating product features at the user activation phase:
When you think about gating your product, consider how you can funnel customers toward your magic moment and get them to experience that as quickly as possible.
Here are some strategies that will help you design smoother flows, identify friction early, and create experiences that convert new users into loyal long-term customers.
User onboarding is your product’s first impression, setting the tone for everything that follows. If it’s clunky, confusing, or overloaded with information, users won’t stick around long enough to see the value you worked so hard to build.
In fact, poor onboarding is the third most important reason customers churn, right after wrong product fit and lack of engagement.
The key is to make those first few minutes feel gentle and effortless. Start by walking through your own onboarding process as if you’ve never seen the product before. Where do you hesitate? Where do things drag on? Those moments are your friction points. Simplify them.
A few ways to make onboarding smoother:
But onboarding is never a one-and-done project. It’s a living, breathing part of your product that constantly needs fresh eyes and smarter tweaks.
Dropbox’s onboarding is often cited as clean, simple, and intuitive. It provides just enough guidance to help users upload their first file, share a folder, or sync a device, without overwhelming them with unnecessary features.
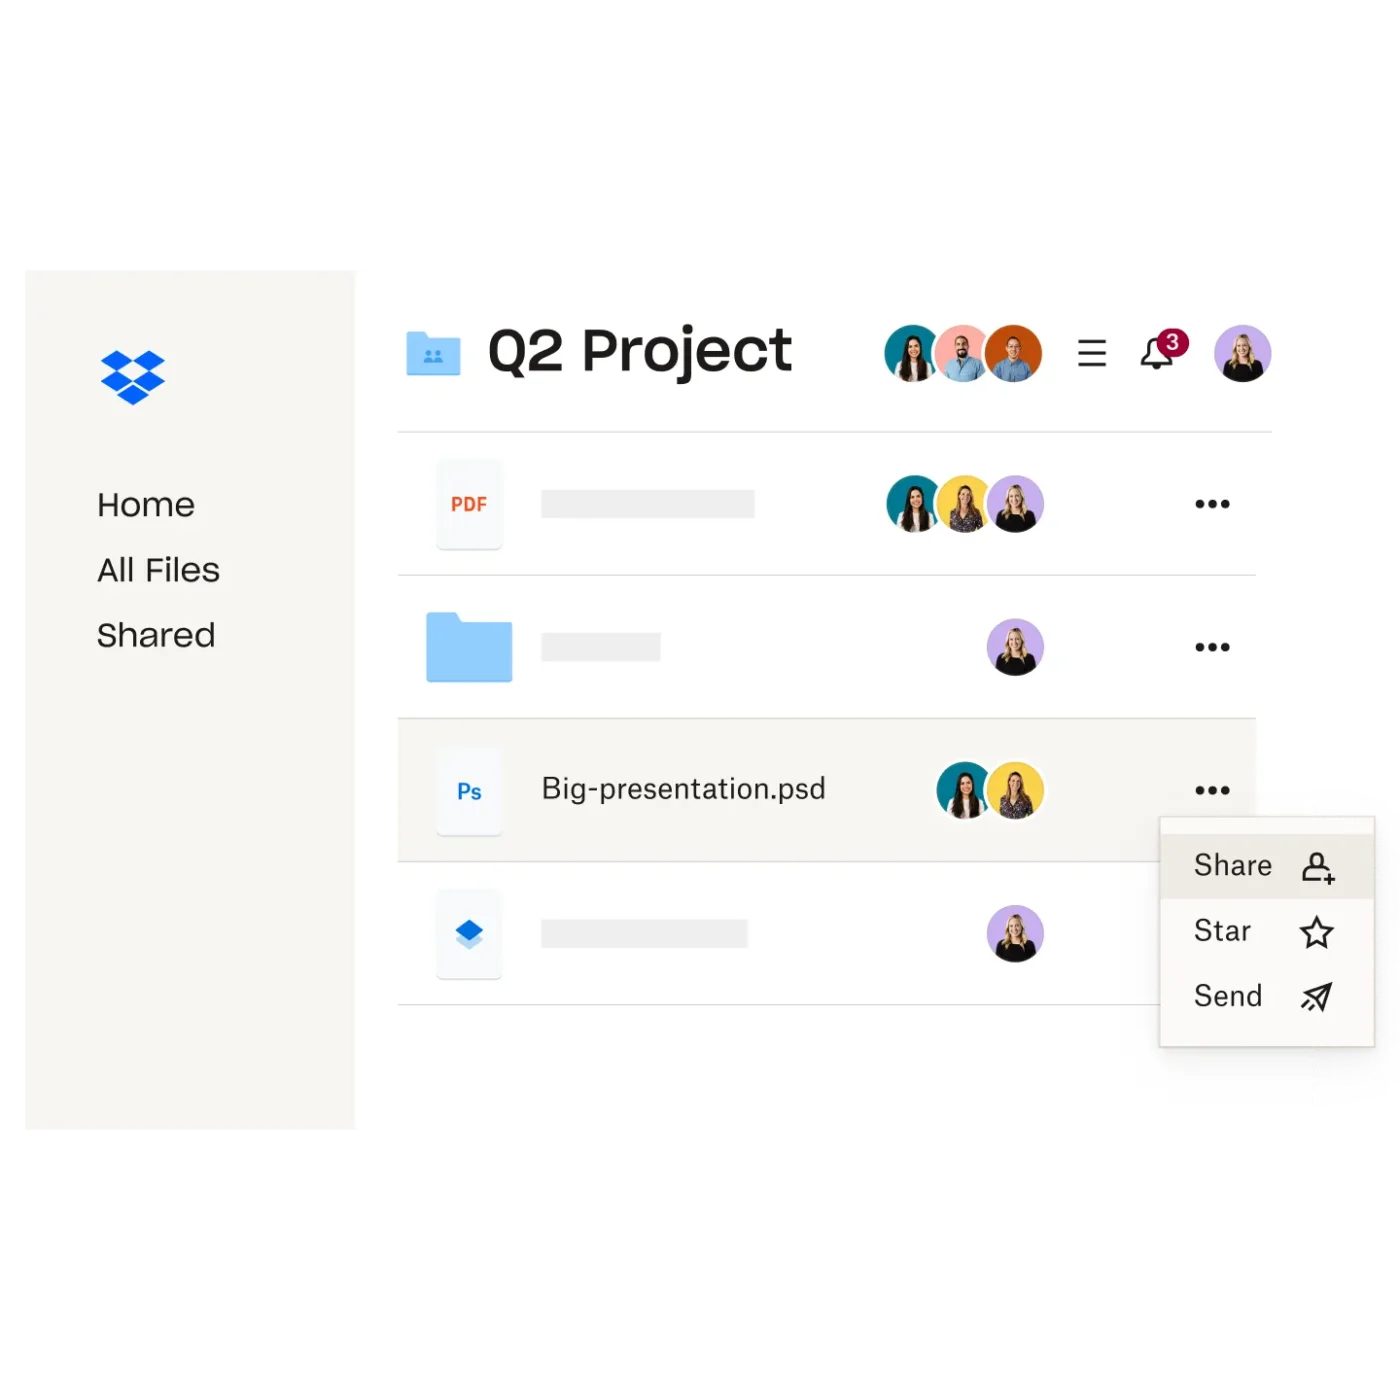
By making early steps easy, rewarding, and directly tied to value (e.g., “upload a file → see how syncing works”), Dropbox reduced friction and helped users experience “first value” quickly—which boosted activation, retention, and long-term engagement.
User activation is the critical bridge between signup and becoming an engaged customer. It’s not enough to get people to create accounts—you need coordinated efforts across product, marketing, and customer success to guide users toward their first meaningful action. This is where ClickUp comes in.
It is the world’s first Converged AI Workspace, bringing together all work apps, data, and workflows. Your activation experiments, onboarding task flows, user journey maps, and customer success playbooks live in one workspace.
To nail your journey, mapping and flow diagrams become essential. With ClickUp Whiteboards, product teams can:
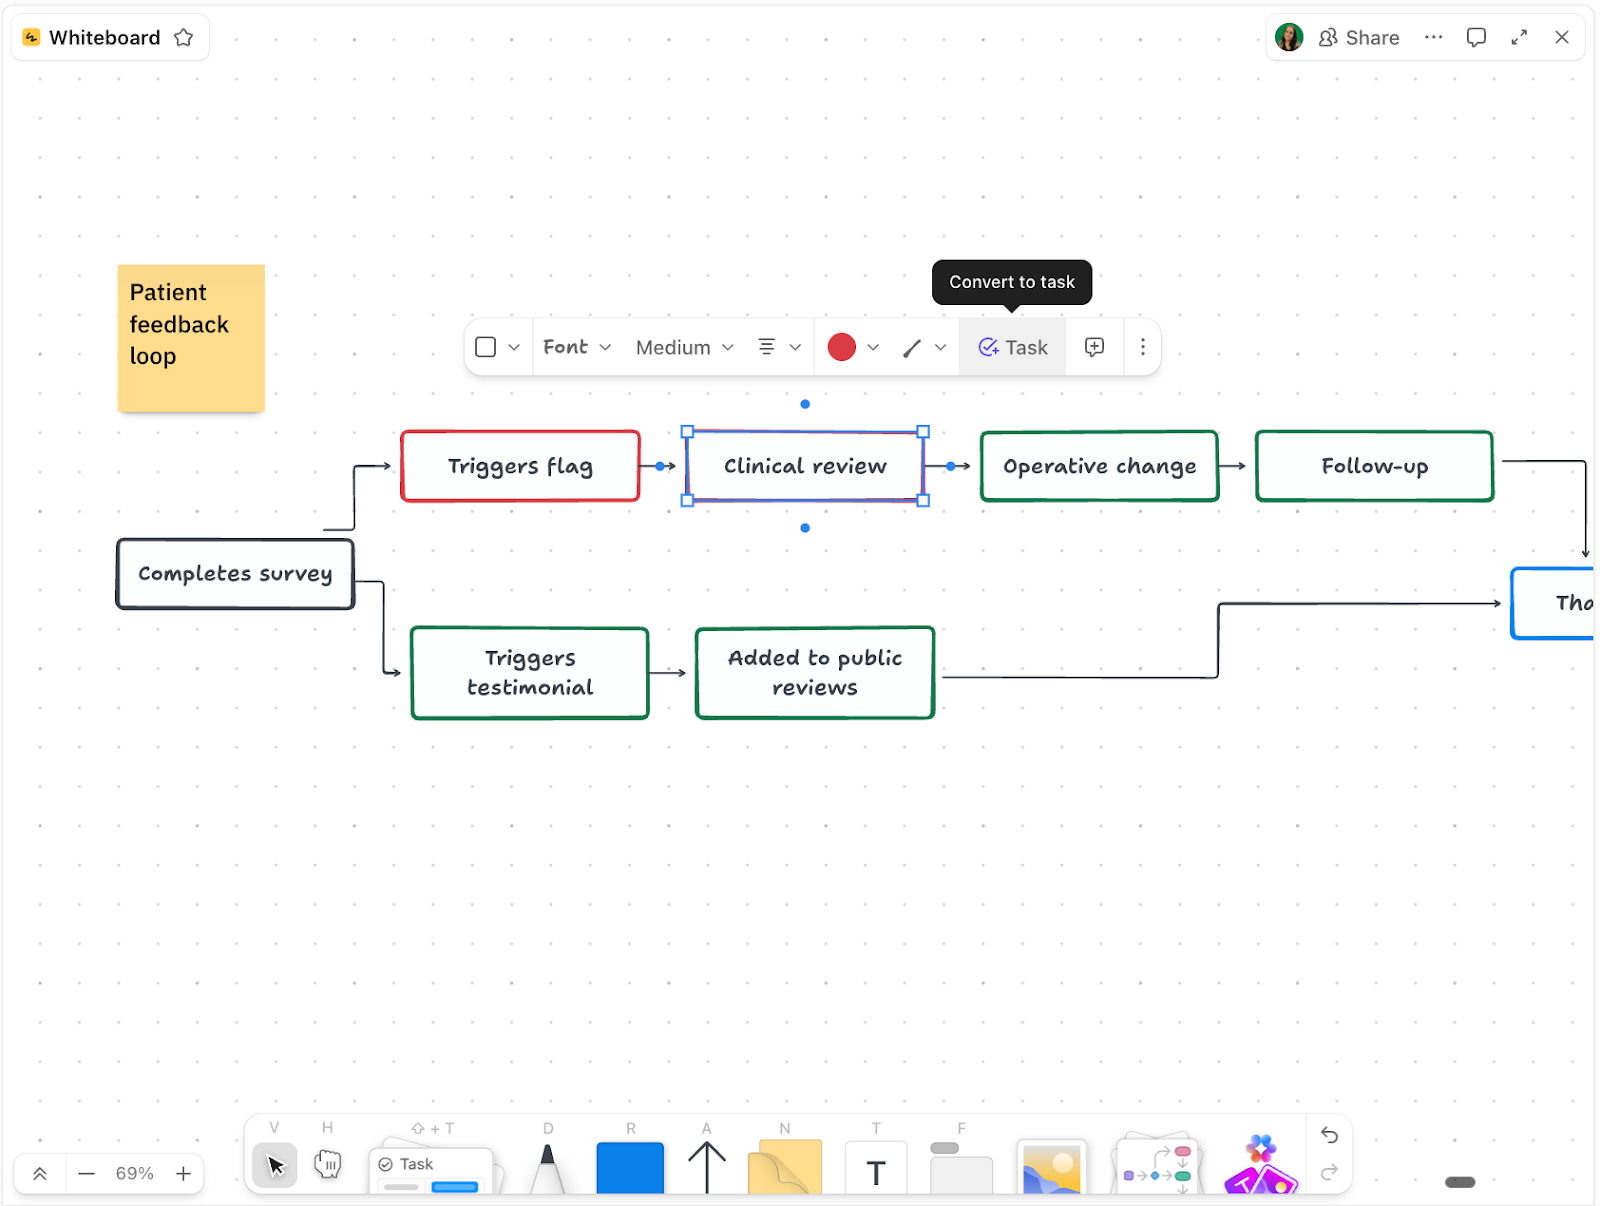
By visualizing onboarding as a connected journey rather than a set of isolated screens, teams can spot blockers earlier, streamline the path to value, and systematically improve customer activation.
And if you need help nailing the copy, ClickUp Brain can help. It helps you write and refine product messaging that’s simple, consistent, and activation-driven.

ClickUp Brain’s writing assistant can rephrase tooltips, draft CTAs, and help you test out alternative versions of your onboarding dialogues.
💡 Pro Tip: Use ClickUp AI Notetaker to record and summarize user research calls and feedback. Get instant transcripts and action items that are ready to turn into tasks.
Clear education reduces confusion, shortens the learning curve, and ensures new users know exactly what to do next. By simplifying feature discovery and guiding users through their first meaningful action, products dramatically improve activation and long-term retention.
Strong user education typically includes:
Remember that the goal isn’t to teach users everything—it’s to teach them just enough to achieve their first success moment. When onboarding provides the right information at the right time, users feel confident, supported, and capable of making progress.
Slack uses simple, interactive cues like “Create a channel” or “Send a message” to walk users through the product, helping them hit quick wins without overwhelming them.

Plus, the Slackbot guides users through early steps, provides clarifying examples, and even responds to basic commands, making the learning experience feel conversational rather than technical.
💡 Pro Tip: To improve activation, you also need a system that helps you act on user insights—fast. That’s where ClickUp CRM steps in.
Growth teams use ClickUp CRM to map every user’s onboarding journey like a customer pipeline. With ClickUp CRM, you can:
User activation isn’t guesswork; it’s experimentation. A/B testing allows product teams to compare two (or more) onboarding flows to determine which one gets users to their first value moment more quickly.
By systematically testing variations in copy, UI layout, tutorial length, checklists, or guided actions, teams can pinpoint what actually drives behavior rather than relying on assumptions.
Even small tweaks like a clearer CTA, fewer onboarding steps can produce meaningful lifts in activation.
💡 Pro Tip: Record ClickUp Clips of actual users navigating through different test variations during moderated testing sessions or user interviews. Screen recordings show exactly where users hesitate, what elements they click first, or where they abandon the activation flow—context that conversion metrics alone can’t reveal.
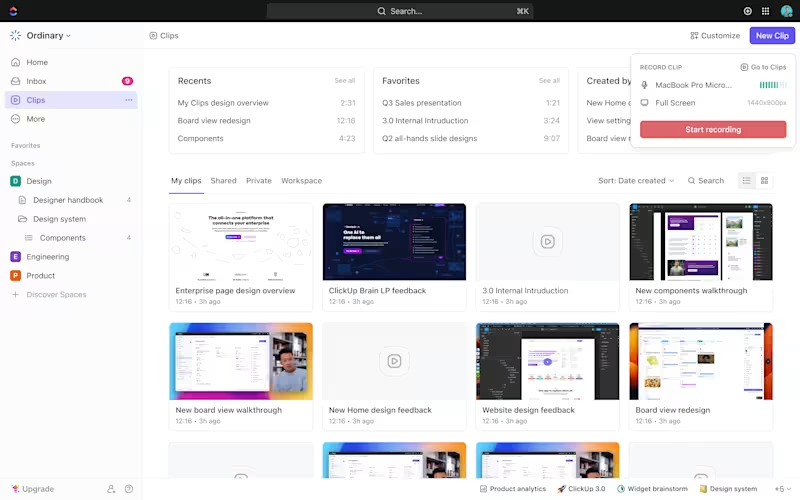
Embed these clips directly into your A/B test documentation or activation project tasks so the entire team can see real user behavior, not just statistical outcomes, when deciding which variation to implement.
Pinterest is widely recognized for its rigorous A/B testing culture, particularly in areas such as onboarding and early user flows.
One major A/B test focused on simplifying the initial interest-selection flow. By reducing the number of required selections and improving clarity in the prompts, Pinterest saw a significant increase in new-user activation because users reached their personalized feed faster.
They also tested variations of their “Save Your First Pin” tutorial. The version that immediately encouraged users to take a simple action (saving a pin) outperformed more passive variants, meaning more users hit their first success moment within minutes.
A/B testing your activation flow requires documenting test hypotheses, tracking multiple variations, analyzing results, and preserving learnings for future experiments.
ClickUp Docs provides a centralized knowledge base for your entire testing program so insights don’t get lost in scattered spreadsheets or old Slack threads.

Here’s how:
💡 Pro Tip: Product teams today have more customer data than ever, but insight is still hard to find. AI agents help clean, analyze, and interpret data instantly, so you spend less time chasing dashboards and more time making decisions.
📋 In this video, we’ll break down:
✅ How AI agents automate data cleaning, summaries, and anomaly detection
✅ How AI helps you move from raw data → insights → actions
✅ The best tools for visualization, predictive analytics, and no-code analysis
✅ How ClickUp AI Agents turn data into decisions inside one workspace
Whether you work in design, growth, marketing, or product, these AI agents help you get clearer answers, faster.
Everyone loves a good win. Whether it’s crossing something off a to-do list or unlocking a tiny badge, progress does feel satisfying. Gamification leverages that feeling to draw users deeper into the product experience. That is because gamification taps into a few universal motivators: progress, reward, and recognition.
But how can you do it right? This is how:
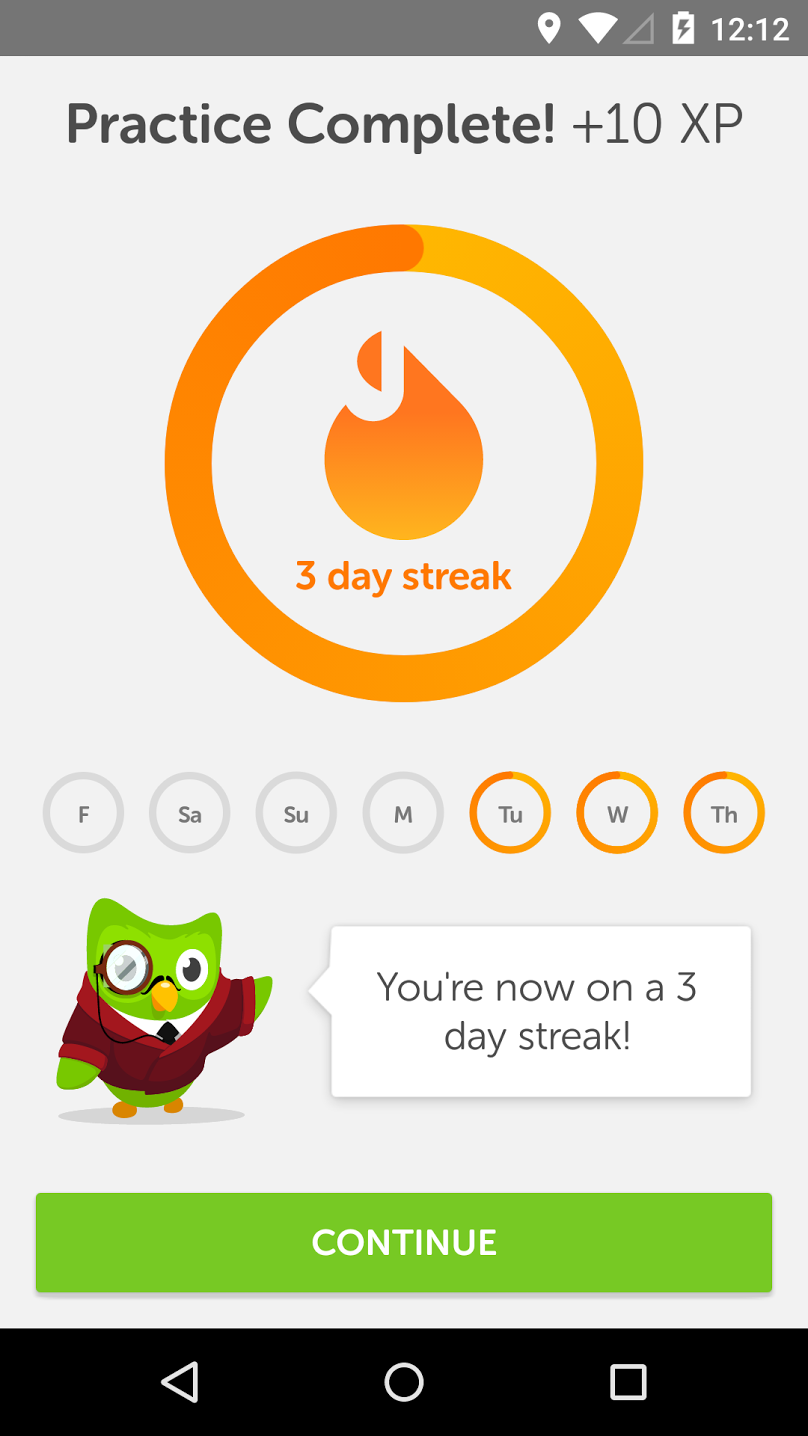
For example, Duolingo uses streaks, XP points, and gamified progress markers to keep users returning and completing lessons, which increases early activation rates.
Imagine two users sign up for your product on the same day. One is a solo freelancer while the other is a team lead at a 50-person company. If you show them the same onboarding flow, one of them will be confused. The freelancer doesn’t need the ‘invite your team’ steps. The team lead doesn’t want to sit through beginner tutorials.
So, how do you ensure both have a great first experience? Well, this is how:
💡 Pro Tip: Set up ClickUp Automations to automatically create follow-up tasks when users hit (or miss) key activation milestones. For example, when a user completes their first core action, trigger an automation that assigns a customer success task to send a personalized congratulations email or product tip.
When users haven’t logged in for three days after signing up, automatically create a re-engagement task for your team to reach out. These automated workflows ensure that no user is missed during critical activation windows, eliminating the need for manual monitoring.
Canva’s success stems from a highly effective onboarding process that includes user segmentation, interactive tutorials, and ongoing feedback loops.
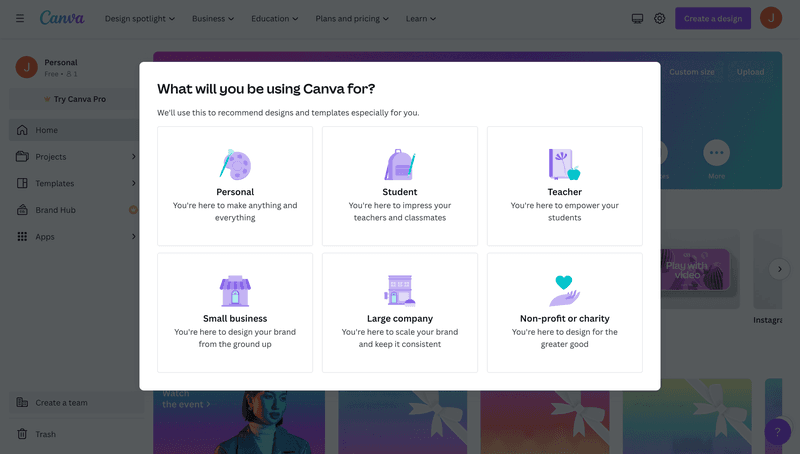
New users receive a tailored experience, based on their role or objectives, and are shown hands-on tutorials and templates, so they don’t start with a blank slate. This makes the first tasks easier and helps them see value almost immediately.
You need a way to collect this customer data, store it, and use it to customize what users see next. ClickUp Forms to the rescue!
You can ask onboarding questions, add conditional logic to adapt the form based on answers, and store everything using ClickUp Custom Fields.
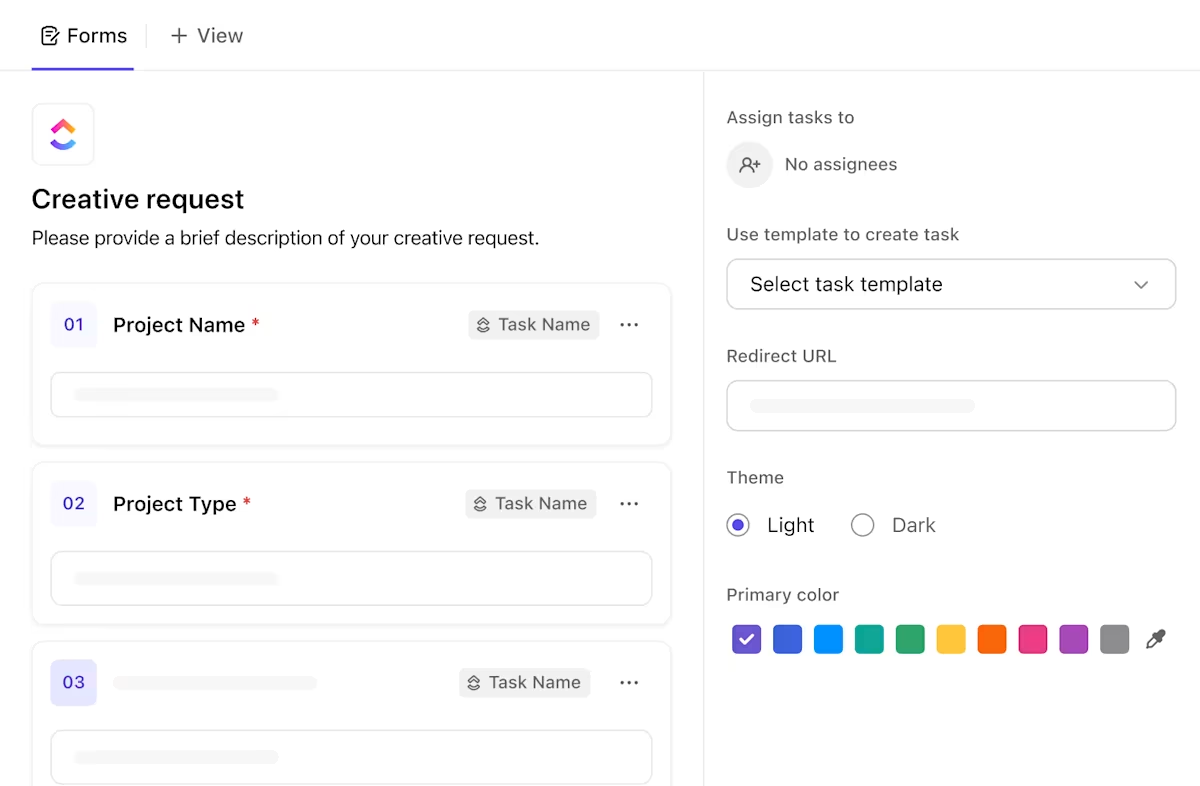
Once someone submits, ClickUp can automatically create a personalized task list, tag the right owner, and update your Dashboard.
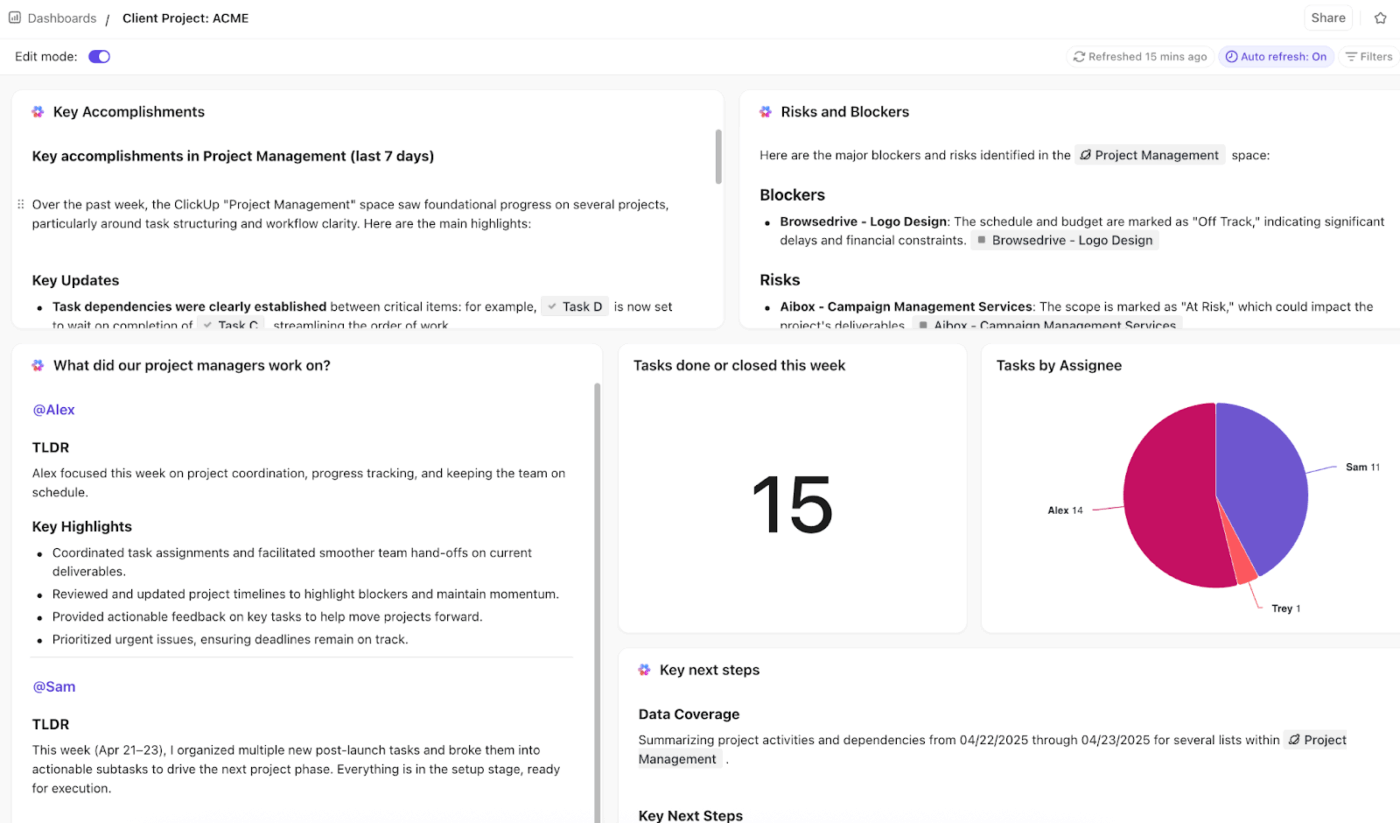
💡 Pro Tip: You would need a centralized dashboard to monitor all this. ClickUp Dashboards come to your rescue. They give you a real-time view of every activation milestone in one place. That means:

You can’t improve what you don’t measure. Here are the metrics you should be tracking to know if your user activation efforts are paying off:
This metric tracks the percentage of users who complete all onboarding steps (tutorials, profile setup, or product tour). It helps identify whether users are dropping off during setup or education steps, which can signal friction in the early experience.
🛠️ Formula: Onboarding Completion Rate = (Users Who Complete Onboarding ÷ Users Who Started Onboarding) × 100
📚 Read More: The 8 Step Guide to Client Onboarding
This is the most direct measure of activation. It shows the percentage of new users who complete the key actions that define success in your product. These actions could be setting up an account, creating a project, or inviting a teammate—anything that indicates genuine user engagement.
🛠️ Activation Rate Formula: Activation Rate = (Number of Activated Users ÷ Total New Users) × 100
This metric (sometimes called TTFV) tells you how long it takes a new user to experience success for the first time. The shorter this time, the faster you’re proving value.
🛠️ How to measure: Record the time between signup and the completion of the first key action, such as sending a message, uploading a file, or launching a campaign.
To understand why TTFV increases or decreases, pair it with qualitative feedback tools:
User retention rate measures the percentage of users who continue using your product over a given period (often weekly or monthly). It is your North Star metric to understand daily active users and their ongoing trends.
🛠️ Formula: Retention Rate = (Returning Users ÷ Total Users at Start of Period) × 100
Referral rate tells you how many users invite or refer others to your product. It’s one of the best indicators of satisfaction and perceived value because users rarely recommend tools they don’t trust or enjoy using.
🛠️ Formula: Referral Rate = (Number of Referred Users ÷ Total Active Users) × 100
The churn rate is the percentage of users (or customers) who stop using your product or cancel their subscription over a specific time period. It is especially important if your business relies heavily on subscription or recurring revenue streams.
🛠️ Formula: Churn Rate = (Inactive Users During Period ÷ Total Users at Start of Period) × 100
This metric is one of the most critical indicators of user activation for products with a free trial. You get to see how many free trial users become paying customers after the set period ends. It shows the perceived value and pricing fit of the product.
🛠️ Formula: Trial-to-Paid Conversion Rate = (Trial Users Converted to Paid ÷ Total Trial Users) × 100
⚡ Template Archive: If you’re setting up KPIs for the first time, start with the ClickUp KPI Template. It lets you define measurable activation goals, set target values, and assign owners before connecting to your Dashboard for real-time tracking.
User stickiness measures how frequently users return to your product within a given period. It compares active users’ engagement over a narrower time frame with their engagement over a broader period. A higher ratio indicates good engagement and user retention.
🛠️ Formula: User Stickiness = Daily Active Users (DAU) ÷ Monthly Active Users (MAU) × 100
Once activation stabilizes, track feature usage to see if users keep exploring and engaging with key features. It helps you identify what resonates with your audience and where product education might be falling short.
🛠️ Formula: Feature Usage Rate = (Number of Unique Feature Users ÷ Total Number of Users) × 100
Activation forms the bridge between acquisition and long-term value. When activation improves, renewals, upgrades, and referrals typically follow.
🛠️ Users who activate within 48 hours renew more often or upgrade faster. This goes to prove that strong onboarding helps retain users. We’ve curated a list of free analytics templates that you can use for this.
💡 Pro Tip: You’ve built your dashboard and added a few widgets. Now, imagine a single widget that displays the numbers and explains their meaning. That’s what ClickUp AI Cards do!
Pick the right card for your needs:
Improving activation is an ongoing process of understanding how users discover value and helping them reach it faster. These best practices will help your product teams design onboarding flows that lead to consistent engagement and encourage users to explore premium features.
Look for the behaviors that separate your most engaged users from everyone else. These patterns reveal which user actions consistently lead to activation.
Once mapped, use them to guide new users toward similar paths early in their journey.
Pair interviews with quick studies from proven user research methods to learn how real users interpret your onboarding and how this can help in retaining users.
Reaching the ‘Aha! moment’ can take time, especially for complex products. Help users experience a preview of value early on:
Don’t wait for users to ask for help. Try to anticipate their needs.
Sometimes a little motivation goes a long way. Incentives can nudge users toward completing key activation milestones. This is what we mean:
👀 Did you know? Dropbox increased its user base by nearly 3,900% after introducing referral-based rewards, offering extra storage space when users completed onboarding steps or invited friends.
User activation is a continuous process that defines how users connect with your product and the value they derive from it.
The faster they reach that point of value, the stronger your retention and revenue growth.
ClickUp helps you map activation customer journeys, remove friction, and measure success across every stage. This way, you can build onboarding workflows, track activation numbers, and optimize each touchpoint, all under one roof.
User activation is the stage in a SaaS customer journey when new users begin to realize the product’s actual value. For example, in ClickUp, activation might happen when a new user creates their first workspace, adds a few tasks, and invites teammates to collaborate.
Track user behavior metrics such as user activation rate, time-to-first-value, and feature engagement. These indicators show how quickly users move from signup to meaningful use.
Some of the most common mistakes in the user activation process are lengthy setup flows, unclear value propositions, and feature overload. Make sure your onboarding flows are centered on both new and existing customer expectations.
ClickUp’s pre-built templates for customer onboarding and KPI tracking help you standardize your activation journey, define clear milestones, and give every new user a guided path to their “aha” moment.
From there, ClickUp’s AI ecosystem amplifies activation with advanced features such as:
ClickUp Brain rewrites onboarding copy, simplifies tooltips, and generates activation messaging that’s clearer and more intuitive for new users
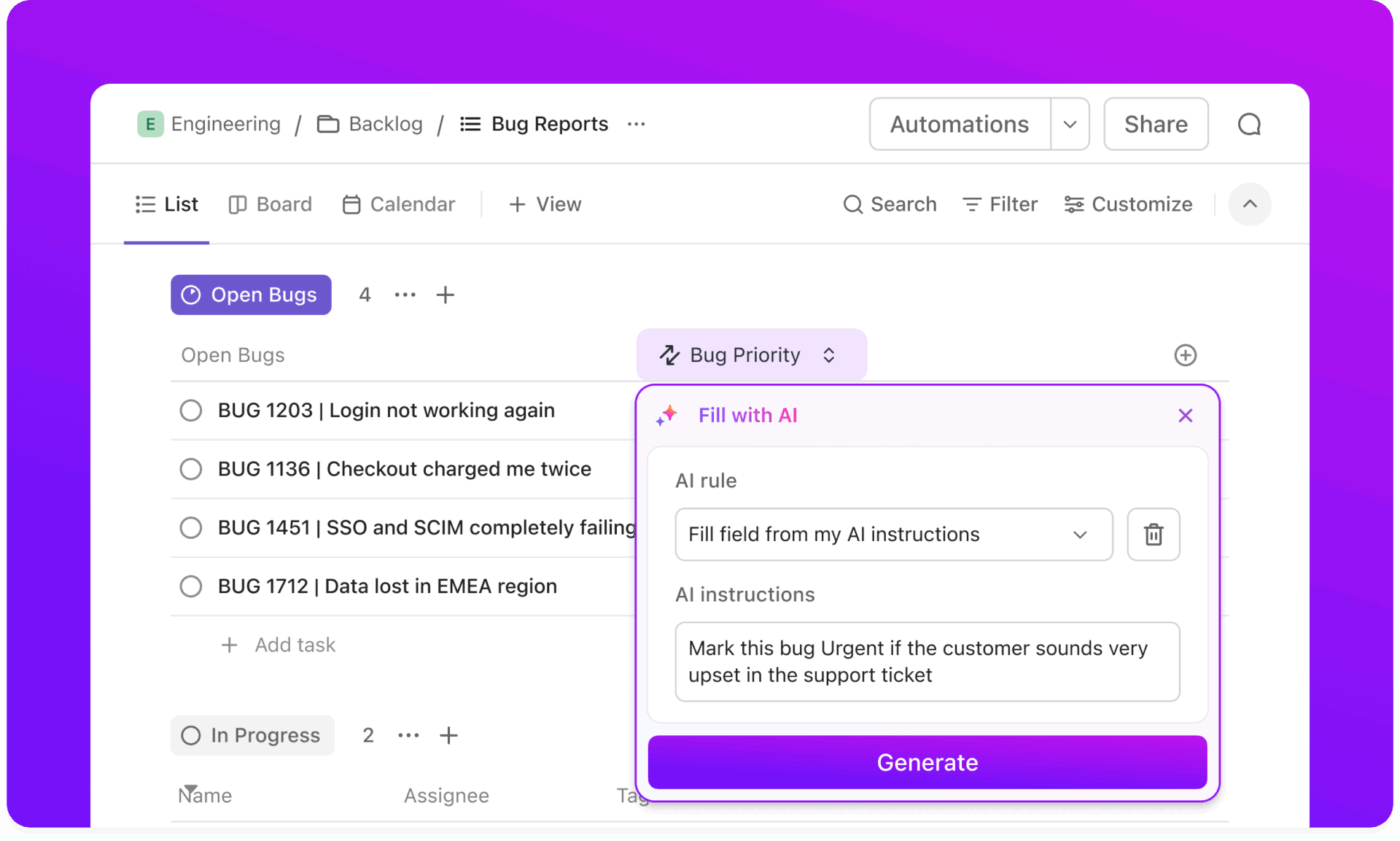
ClickUp Automations removes manual steps by auto-assigning tasks, updating statuses, tagging lifecycle stages, and nudging teams when users stall
AI Agents interpret context from tasks, comments, and user attributes to run intelligent, multi-step workflows that keep onboarding flows moving without human intervention
ClickUp Dashboards give you a real-time view of user activation milestones—time-to-first-value, drop-off points, feature adoption, and segment performance—so you can act on insights
There’s no fixed number or point, but ideally, users should reach value within minutes of signing up. The shorter the path to the first win, the stronger your activation rate and long-term retention. Focus on reducing time-to-value and removing unnecessary steps from your user onboarding process.

© 2026 ClickUp

There’s an easier way. Try a free AI Agent in ClickUp that actually does the work for you—set up in minutes, save hours every week.