


Still downloading templates?
There’s an easier way. Try a free AI Agent in ClickUp that actually does the work for you—set up in minutes, save hours every week.
Sorry, there were no results found for “”
Sorry, there were no results found for “”
Sorry, there were no results found for “”
Some databases rely on relationships with stronger entities to remain functional.
Imagine you’re designing a database for a hospital. In a hospital database, a patient’s record is independent, but treatment notes depend on it.
These context-dependent entities are called weak entities. They rely on stronger entities to give them meaning and purpose, making them a vital part of relational database design.
In this blog, we’ll explain the concept of weak entities in ER diagrams to help you design efficient and intuitive databases.
⏰ 60-Second Summary
The definition of a weak entity is a database component that can’t be uniquely identified by its attributes alone. It depends on a strong (or owner) entity for its identification.
This concept is central to Entity-Relationship (ER) models in database design.
📌 Example: In a university database, the dependent may represent family members of a professor. The dependent cannot be uniquely identified without referencing the professor’s ID, making it a weak entity. Combining the professor’s ID and the dependent’s name forms a composite key.
To understand weak entities better, let’s look at their characteristics:
A weak entity has three primary components: the partial key, the identifying relationship, and the composite key.
A strong entity in a data model has a unique identifier and can exist independently of other entities. It has a primary key that identifies it and can interact with other entities within the model.
📌 Example: A person can be identified by their Social Security Number (SSN), or an employee can be identified by their employee ID, making these codes strong entities.
The distinction between strong and weak entities helps define and place them in the right category. This creates a structured and efficient database with real-world use cases.
Let’s look at their differences. 👇
| Feature | Weak entity | Strong entity |
| Primary key | Lacks a primary key but has a partial discriminator key | Features a primary key that uniquely identifies each instance |
| Independence | Dependent on a strong entity for its existence | Independent; it can exist without another entity |
| Representation in ER diagram | Represented by a double rectangle | Represented by a single rectangle |
| Relationship representation | Relationship with a strong entity is represented by a double diamond | The relationship between two strong entities is shown with a single diamond |
| Participation constraints | Always has total participation in its identifying relationship | May or may not have total participation in relationships |
| Example | Invoice item (related to invoice) Room book (related to hotel) Order details (related to the order) | Customer entityProduct Employee |
📖 Also Read: 10 Free Context Diagram Templates
Weak entities add complexity to your database by introducing functional dependencies that need clear representation.
Let’s understand this better. 💪
Foreign keys link weak entities to their corresponding strong entities. These keys are derived from the primary key of the strong entity, allowing the weak entity to be uniquely identified.
For example, in a University database, a ‘Section’ weak entity set might include a foreign key pointing to the ‘Course’ entity’s ID alongside its attributes, such as the section number.
💡 Pro Tip: Consider business logic when forming a UML diagram or ERD. These factors may affect how weak entities relate to strong entities over time.
While weak entities lack a primary key, they have unique constraints, called unique keys, to ensure that attribute combinations (with foreign keys) remain distinct across records.
Furthermore, you can employ surrogate keys to simplify identification. These system-generated IDs serve as unique identifiers within the database and are often highlighted in ER diagrams.
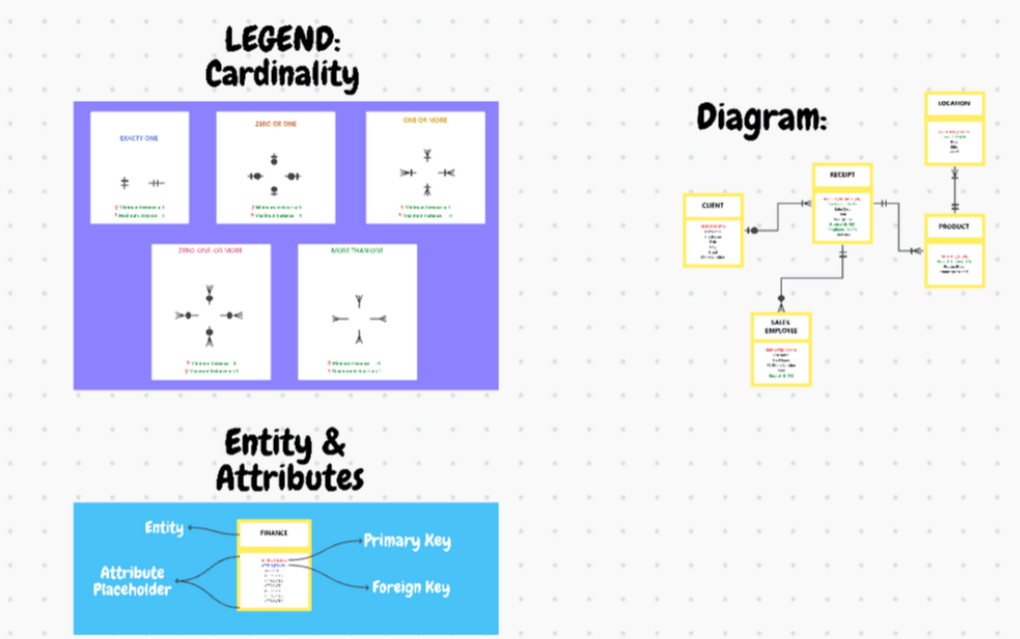
In ER diagrams, weak entities follow specific conventions to highlight their dependencies. A weak entity is represented by a double rectangle, and the relationship connecting it to a strong entity is drawn with a double diamond. This distinct visual style emphasizes their interdependence.
Let’s take a real-life diagram example to understand:

ClickUp Whiteboards is an excellent database design tool to visually represent complex relationships in ER diagrams, such as weak entities. It allows you to create dynamic database models to better understand interdependencies.
Whiteboards let you draw and manipulate these elements effortlessly, turning abstract database concepts into tangible, organized diagrams.
You can add rich text formatting, tables, and content blocks to clearly define each entity and its attributes, ensuring your diagram is functional and visually engaging.
💡 Pro Tip: Prioritize simplicity in your designs. Avoid cluttering diagrams with unnecessary information. Use clear labels, simple shapes, and well-organized structures to make them easy to interpret.
Effective database design requires the right ERD tools to create and visualize structures with complex relationships.
Diagramming tools like Miro, Lucidchart, and ClickUp are great for building clear, organized database representations. These tools simplify defining entity relationships, creating schemas, and identifying weak entities.
Among these, ClickUp, the everything app for work, stands out for its project and task management capabilities. Its suite of tools facilitates seamless real-time collaboration, sharing, and documentation within software teams.
With ClickUp Whiteboards, you can draw, annotate, and integrate database models directly into project workflows. This means you can connect ER diagrams to tasks, projects, and discussions to streamline the design process and keep everyone aligned.
You can also turn your brainstorming sessions into actionable plans without switching tools. While mapping out ideas or workflows on a Whiteboard, you can create ClickUp Tasks directly from your notes or shapes. Got a great idea? Highlight it and turn it into a task with deadlines, assignees, and priorities—all without leaving the Whiteboard.

And it doesn’t stop there. Whiteboards connect seamlessly with ClickUp Docs, allowing you to attach visual plans directly to your project briefs or training materials. This keeps your diagrams and documentation organized and accessible in one place.

This integration makes it easy to move from big-picture brainstorming to detailed execution.
The Entity Relationship Diagram Template is a solid tool for visualizing and managing complex data sets without technical expertise. You can create visual representations of database relationships to help your team understand how different entities connect.
The template unlocks new insights into your data set, identifies potential issues, improves data modeling accuracy, and reduces structure errors. Of course, it also saves time in the development process.
Designing databases with weak entities requires a thoughtful approach to ensure efficiency and clarity.
Let’s explore some best practices to help you effectively incorporate weak entities into your relational database. 📄
💡 Pro Tip: Use high color contrast to make your diagrams more readable and accessible. Provide alternative texts or annotations for complex visuals, non-obvious symbols, relationships, or custom notations to help all team members understand.
Let’s explore some practical, relatable examples to help you understand how versatile weak entities are.
📖 Also Read: How to Create an Excel Database
Weak entities add complexity and depth to your database, creating dependencies that must be represented clearly.
ClickUp helps you create and collaborate on these diagrams. Its features, like ClickUp Whiteboards, let you visualize weak entities and their relationships in real time, making it perfect for team projects.
Sign up to ClickUp for free today! ✅

© 2026 ClickUp

There’s an easier way. Try a free AI Agent in ClickUp that actually does the work for you—set up in minutes, save hours every week.